About the Authors
Paul C. Zikopoulos, B.A., M.B.A.
,
is the Director of Technical Professionals for IBM Software Group’s Information Management division and addition-ally leads the World Wide Database Competitive and Big Data SWAT teams. Paul is an internationally recognized award-winning writer and speaker with more than 18 years of experience in Information Management. Paul has written more than 350 magazine articles and 14 books on database technolo-gies, including DB2 pureScale: Risk Free Agile Scaling (McGraw-Hill, 2010);Break Free with DB2 9.7: A Tour of Cost-Slashing New Features (McGraw-Hill, 2010); Information on Demand: Introduction to DB2 9.5 New Features (McGraw-Hill, 2007); DB2 Fundamentals Certification for Dummies (For Dummies, 2001);
DB2 for Windows for Dummies (For Dummies, 2001), and more. Paul is a DB2 Certified Advanced Technical Expert (DRDA and Clusters) and a DB2 Certi-fied Solutions Expert (BI and DBA). In his spare time, he enjoys all sorts of sporting activities, including running with his dog, Chachi; avoiding punches in his MMA training; trying to figure out why his golf handicap has unex-plainably decided to go up; and trying to understand the world according to Chloë, his daughter. You can reach him at [email protected]. Also, keep up with Paul’s take on Big Data by following him on Twitter @BigData_paulz.
Chris Eaton, B.Sc., is a worldwide technical specialist for IBM’s Information Management products focused on Database Technology, Big Data, and Workload Optimization. Chris has been working with DB2 on the Linux, UNIX, and Windows platform for more than 19 years in numerous roles, from support, to development, to product management. Chris has spent his career listening to clients and working to make DB2 a better product. He is the author of several books in the data management space, including The High Availability Guide to DB2 (IBM Press, 2004), IBM DB2 9 New Features
(McGraw-Hill, 2007),and Break Free with DB2 9.7: A Tour of Cost-Slashing New Features (McGraw-Hill, 2010). Chris is also an international award-winning speaker, having presented at data management conferences across the globe, and he has one of the most popular DB2 blogs located on IT Toolbox at http://it.toolbox.com/blogs/db2luw.
Information Architect. Dirk has a Bachelor’s degree in Computer Science and a Bachelor of Arts degree (Honors in English) from the University of New Brunswick.
Thomas Deutsch, B.A, M.B.A., serves as a Program Director in IBM’s Big Data business. Tom has spent the last couple of years helping customers with Apache Hadoop, identifying architecture fit, and managing early stage proj-ects in multiple customer engagements. He played a formative role in the transition of Hadoop-based technologies from IBM Research to IBM Software Group, and he continues to be involved with IBM Research Big Data activities and the transition of research to commercial products. Prior to this role, Tom worked in the CTO office’s Information Management division. In that role, Tom worked with a team focused on emerging technologies and helped cus-tomers adopt IBM’s innovative Enterprise Mashups and Cloud offerings. Tom came to IBM through the FileNet acquisition, where he had responsibil-ity for FileNet’s flagship Content Management product and spearheaded FileNet product initiatives with other IBM software segments including the Lotus and InfoSphere segments. With more than 20 years in the industry and a veteran of two startups, Tom is an expert on the technical, strategic, and business information management issues facing the enterprise today. Tom earned a Bachelor’s degree from the Fordham University in New York and an MBA from the Maryland University College.
About the Technical Editor
Understanding Big Data
Analytics for Enterprise Class
Hadoop and Streaming Data
Paul C. Zikopoulos
Chris Eaton
Dirk deRoos
Thomas Deutsch
George Lapis
Copyright © 2012 by The McGraw-Hill Companies. All rights reserved. Except as permitted under the United States Copyright Act of 1976, no part of this publication may be reproduced or distributed in any form or by any means, or stored in a database or retrieval system, without the prior written permission of the publisher.
ISBN: 978-0-07-179054-3
MHID: 0-07-179054-3
The material in this eBook also appears in the print version of this title: ISBN: 978-0-07-179053-6, MHID: 0-07-179053-5.
All trademarks are trademarks of their respective owners. Rather than put a trademark symbol after every occurrence of a trademarked name, we use names in an editorial fashion only, and to the benefi t of the trademark owner, with no intention of infringement of the trademark. Where such designations appear in this book, they have been printed with initial caps.
McGraw-Hill eBooks are available at special quantity discounts to use as premiums and sales promotions, or for use in corporate training programs. To contact a representative please e-mail us at [email protected].
Information has been obtained by McGraw-Hill from sources believed to be reliable. However, because of the possibility of human or mechanical error by our sources, McGraw-Hill, or others, McGraw-Hill does not guarantee the accuracy, adequacy, or completeness of any information and is not responsible for any errors or omissions or the results obtained from the use of such information.
TERMS OF USE
This is a copyrighted work and The McGraw-Hill Companies, Inc. (“McGrawHill”) and its licensors reserve all rights in and to the work. Use of this work is subject to these terms. Except as permitted under the Copyright Act of 1976 and the right to store and retrieve one copy of the work, you may not decompile, disassemble, reverse engineer, reproduce, modify, create derivative works based upon, transmit, distribute, disseminate, sell, publish or sublicense the work or any part of it without McGraw-Hill’s prior consent. You may use the work for your own noncommercial and personal use; any other use of the work is strictly prohibited. Your right to use the work may be terminated if you fail to comply with these terms.
My fifteenth book in my eighteenth year at IBM—it’s hard to believe so much time has passed and Information Management technology has become
not just my career, but somewhat of a hobby (insert image of Chloe reading this in a couple of years once she learns the universal “loser” gesture).
I often dedicate my books to people in my life: This book I actually want to dedicate to the company in my life that turned 100 years old on August 12,
2011:IBM. In this day and age of fluid careers, the U.S. Department of Labor has remarked that the average learner will have 10 to 14 jobs by the time they are 38; 1 in 4 workers have been with their employer less than a year; and 1 in 2 workers have been with their employer less than 5 years. Sometimes I get asked about my 18-year tenure at IBM in a tone of disbelief
for my generation. In my 18 years at IBM, I’ve had the honor to learn and participate in the latest technologies, marketing, sales, technical sales,
writing, usability design, development, partner programs, channels, education, support, services, public speaking, competitive analysis, and always learning more. IBM has always been a place that nurtures excel-lence and opportunity for those thirsty to make a difference, and I’ve got a thirst not yet quenched. IBM deeply encourages learning from others—and I often wonder if other people feel like they won the lottery with a mentoring team (Martin Wildberger, Bob Piciano, Dale Rebhorn, and Alyse Passarelli) like the one I have. Thanks to IBM for providing an endless cup of
opportu-nity and learning experiences.
Finally, to my two gals, whose spirits always run through my soul: Grace Madeleine Zikopoulos and Chloë Alyse Zikopoulos.
—Paul Zikopoulos
This is the fourth book that I have authored, and every time I dedicate the book to my wife and family. Well this is no exception, because it’s their support that makes this all possible, as anyone who has ever spent hours
and hours of their own personal time writing a book can attest to.
To my wife, Teresa, who is always supporting me 100 percent in all that I do, including crazy ideas like writing a book. She knows full well how much time it takes to write a book since she is a real author herself and yet she still
books (not that they are really interested in any of this stuff since they are both under ten). Daddy is finished writing his book so let’s go
outside and play.
—Chris Eaton
I’d like to thank Sandra, Erik, and Anna for supporting me, and giving me the time to do this. Also, thanks to Paul for making this book happen and
asking me to contribute.
—Dirk deRoos
I would like to thank my ridiculously supportive wife and put in writing for Lauren and William that yes, I will finally take them to Disneyland again now that this is published. I’d also like to thank Anant Jhingran for both the
coaching and opportunities he has entrusted in me.
—Thomas Deutsch
“If you love what you do, you will never work a day in your life.” I dedicate this book to all my colleagues at IBM that I worked with over the years who
helped me learn and grow and have made this saying come true for me.
—George Lapis
Thanks to my IBM colleagues in Big Data Research and Development for the exciting technologies I get to work on every day. I also want to thank Paul for the opportunity to contribute to this book. Last but not least, and
most importantly, for my wife, Amy, and my twins, Tiffany and Ronald, thank you for everything you do, the joy you bring, and for supporting the
time it took to work on this book.
ix
CONTENTS AT A GLANCE
PART I
Big Data: From the Business Perspective
1 What Is Big Data? Hint: You’re a Part of It Every Day . . . 3
2 Why Is Big Data Important? . . . 15
3 Why IBM for Big Data? . . . 35
PART II
Big Data: From the Technology Perspective
4 All About Hadoop: The Big Data Lingo Chapter . . . 51
5 InfoSphere BigInsights: Analytics
for Big Data At Rest . . . 81
6 IBM InfoSphere Streams: Analytics
xi
CONTENTS
Foreword . . . xv
Acknowledgments . . . xxi
About this Book . . . xxiii
PART I
Big Data: From the Business Perspective
1 What Is Big Data? Hint: You’re a Part of It Every Day . . . 3Characteristics of Big Data . . . 5
Can There Be Enough? The Volume of Data . . . 5
Variety Is the Spice of Life . . . 7
How Fast Is Fast? The Velocity of Data . . . 8
Data in the Warehouse and Data in Hadoop (It’s Not a Versus Thing) . . . 9
Wrapping It Up . . . 12
2 Why Is Big Data Important? . . . 15
When to Consider a Big Data Solution . . . 15
Big Data Use Cases: Patterns for Big Data Deployment . . . . 17
IT for IT Log Analytics . . . 18
The Fraud Detection Pattern . . . 20
They Said What? The Social Media Pattern . . . 24
The Call Center Mantra: “This Call May Be Recorded for Quality Assurance Purposes” . . . 26
Risk: Patterns for Modeling and Management . . . 29
Big Data and the Energy Sector . . . 31
3 Why IBM for Big Data? . . . 35
Big Data Has No Big Brother: It’s Ready, but Still Young . . . 37
What Can Your Big Data Partner Do for You? . . . 39
The IBM $100 Million Big Data Investment . . . 40
A History of Big Data Innovation . . . 40
xii Contents
Contents xiii
Compression . . . 95
Splittable Compression . . . 96
Compression and Decompression . . . 97
Administrative Tooling . . . 99
Security . . . 102
Enterprise Integration . . . 103
Netezza . . . 103
DB2 for Linux, UNIX, and Windows . . . 104
JDBC Module . . . 104
InfoSphere Streams . . . 105
InfoSphere DataStage . . . 105
R Statistical Analysis Applications . . . 106
Improved Workload Scheduling: Intelligent Scheduler . . . 106
Adaptive MapReduce . . . 107
Data Discovery and Visualization: BigSheets . . . 109
Advanced Text Analytics Toolkit . . . 112
Machine Learning Analytics . . . 118
Large-Scale Indexing . . . 118
BigInsights Summed Up . . . 121
6 IBM InfoSphere Streams: Analytics for Big Data in Motion . . . 123
InfoSphere Streams Basics . . . 124
Industry Use Cases for InfoSphere Streams . . . 125
How InfoSphere Streams Works . . . 129
What’s a Stream? . . . 130
The Streams Processing Language . . . 131
Source and Sink Adapters . . . 133
Operators . . . 134
Streams Toolkits . . . 137
Enterprise Class . . . 138
High Availability . . . 139
Consumability: Making the Platform Easy to Use . . . 140
xv
FOREWORD
Executive Letter from Rob Thomas
There’s an old story about two men working on a railroad track many years back. As they are laying track in the heat of the day, a person drives by in a car and rolls down the window (not enough to let the air conditioning out, but enough to be heard). He yells, “Tom, is that you?” Tom, one of the men working on the track, replies, “Chris, it’s great to see you! It must have been 20 years . . . How are you?” They continue the conversation and Chris eventu-ally drives off. When he leaves, another worker turns to Tom and says, “I know that was the owner of the railroad and he’s worth nearly a billion dol-lars. How do you know him?” Tom replies, “Chris and I started working on the railroad, laying track, on the same day 20 years ago. The only difference between Chris and me is that I came to work for $1.25/hour and he came to work for the railroad.”
*****
Perspective. Aspiration. Ambition. These are the attributes that separate those who come to work for a paycheck versus those who come to work to change the world. The coming of the Big Data Era is a chance for everyone in the technology world to decide into which camp they fall, as this era will bring the biggest opportunity for companies and individuals in technology since the dawn of the Internet.
Let’s step back for a moment and look at how the technology world has changed since the turn of the century:
•
80 percent of the world’s information is unstructured.•
Unstructured information is growing at 15 times the rate of structured information.•
Raw computational power is growing at such an enormous rate that today’s off-the-shelf commodity box is starting to display the power that a supercomputer showed half a decade ago.xvi Foreword
This is the new normal. These aspects alone will demand a change in our approach to solving information-based problems. Does this mean that our investments in the past decade are lost or irrelevant? Of course not! We will still need relational data stores and warehouses, and that footprint will continue to expand. However, we will need to augment those traditional approaches with technology that will allow enterprises to benefit from the Big Data Era.
The Big Data Era will be led by the individuals and companies that deliver a platform suitable for the new normal—a platform consisting of exploration and development toolsets, visualization techniques, search and discovery, native text analytics, machine learning, and enterprise stability and security, among other aspects. Many will talk about this, few will deliver.
I’m participating here because I know we can change the technology world, and that’s much more satisfying than $1.25/hour. Welcome to the Big Data Era.
Rob Thomas
IBM Vice President, Business Development
Executive Letter from Anjul Bhambhri
It was in the 1970s when the first prototype of a relational database system,
Foreword xvii
these warehouses into data marts for faster decisions that are tightly associ-ated with specific lines of business needs. These developments, over a short period of ten years in the 1990s, made the IT department a key competitive differentiator for every business venture. Thousands of applications were born—some horizontal across industries, some specific to domains such as purchasing, shipping, transportation, and more. Codenames such as ERP (Enterprise Resource Planning), SCM (Supply Chain Management), and oth-ers became commonplace.
By the late 1990s, inevitably, different portions of an organization used different data management systems to store and search their critical data, leading to federated database engines (under the IBM codename Garlic). Then, in 2001, came the era of XML. The DB2 pureXML technology offers sophisticated capabilities to store, process, and manage XML data in its na-tive hierarchical format. Although XML allowed a flexible schema and ease of portability as key advantages, the widespread use of e-mail, accumulation of back office content, and other technologies led to the demand for content management systems and the era of analyzing unstructured and semistruc-tured data in enterprises was born. Today, the advent of the Internet, cou-pled with complete democratization of content creation and distribution in multiple formats, has led to the explosion of all types of data. Data is now not only big, both in terms of volume and variety, but it has a velocity compo-nent to it as well. The ability for us to glean the nuggets of information em-bedded in such a cacophony of data, at precisely the time of need, makes it very exciting. We are sitting at the cusp of another evolution, popularly called as Big Data.
xviii Foreword
appliances (such as Netezza or the Smart Analytics System), as well as analy-sis and reporting tools (such as SPSS or Cognos).
Across industries and sectors (consumer goods, financial services, govern-ment, insurance, telecommunications, and more), companies are assessing how to manage the volume, variety, and velocity of their untapped information in an effort to find ways to make better decisions about their business. This explo-sion of data comes from a variety of data sources such as sensors, smart devices, social media, billions of Internet and smartphone users, and more. This is data that arrives in massive quantities in its earliest and most primitive form.
Organizations seeking to find a better way, which differentiates them from their competitors, want to tap into the wealth of information hidden in this explosion of data around them to improve their competitiveness, effi-ciency, insight, profitability, and more. These organizations recognize the value delivered by analyzing all their data (structured, semistructured, and unstructured) coming from a myriad of internal and external sources. This is the realm of “Big Data.” While many companies appreciate that the best Big Data solutions work across functional groups touching many positions, few corporations have figured out how to proceed. The challenge for the enter-prise is to have a data platform that leverages these large volumes of data to derive timely insight, while preserving their existing investments in Infor-mation Management. In reality, the best Big Data solutions will also help organizations to know their customer better than ever before.
To address these business needs, this book explores key case studies of how people and companies have approached this modern problem. The book diligently describes the challenges of harnessing Big Data and provides examples of Big Data solutions that deliver tangible business benefits.
Foreword xix
people who are passionate about our customers’ success, dedicated to their work, and are continually innovating. It is a privilege to work with them.
Thank you, and enjoy the book.
Anjul Bhambhri
xxi
ACKNOWLEDGMENTS
Collectively, we
want to thank the following people, without whom this book would not have been possible: Shivakumar (Shiv) Vaithyanathan, Roger Rea, Robert Uleman, James R. Giles, Kevin Foster, Ari Valtanen, Asha Marsh, Nagui Halim, Tina Chen, Cindy Saracco, Vijay R. Bommireddipalli, Stewart Tate, Gary Robinson, Rafael Coss, Anshul Dawra, Andrey Balmin, Manny Corniel, Richard Hale, Bruce Brown, Mike Brule, Jing Wei Liu, Atsushi Tsuchiya, Mark Samson, Douglas McGarrie, Wolfgang Nimfuehr, Richard Hennessy, Daniel Dubriwny, our Research teams, and all the others in our business who make personal sacrifices day in and day out to bring you the IBM Big Data platform.Rob Thomas and Anjul Bhambhri deserve a special mention because their passion is contagious—thanks to both of you.
We especially want to give a heartfelt thanks to our terrific Distinguished Engineer (DE), Steve Brodsky, and the two lead Senior Technical Staff Members (STSMs) on BigInsights: Shankar Venkataraman, and Bert Van der Linden; without their dedication and efforts, this book would not be possible. IBM is an amazing place to work, and becomes unparalleled when you get to work, day in and day out, beside the kind of brainpower these guys have and their good natured willingness to share it and make us all smarter. We would also be remiss not to thank Steven Sit, who at the last minute came in to be our technical editor (and part-time researcher, though we failed to tell him that when we approached him with the role).
xxii Acknowledgments
xxiii
ABOUT THIS BOOK
This book’s
authoring team is well seasoned in traditional database tech-nologies, and although we all have different backgrounds and experiences at IBM, we all recognize one thing: Big Data is an inflection point when it comes to information technologies: in short, Big Data is a Big Deal! In fact, Big Data is going to change the way you do things in the future, how you gain insight, and how you make decisions (this change isn’t going to be a replacement for the way things are done today, but rather a highly valued and much anticipated extension).Recognizing this inflection point, we decided to spend our recent careers submersing ourselves in Big Data technologies and figured this book was a great way to get you caught up fast if it’s all new to you. We hope to show you the unique things IBM is doing to embrace open source Big Data technologies, such as Hadoop, and extending it into an enterprise ready Big Data Platform. The IBM Big Data platform uses Hadoop as its core (there is no forking of the Apache Hadoop code and BigInsights always maintains backwards compat-ibility with Hadoop) and marries that to enterprise capabilities provided by a proven visionary technology leader that understands the benefits a platform can provide. IBM infuses its extensive text analytics and machine learning intellectual properties into such a platform, hardens it with an industry tried, tested, and true enterprise-grade file system, provides enterprise integration, security, and more. We are certain you can imagine the possibilities. IBM’s goal here isn’t to get you a running Hadoop cluster—that’s something we do along the path; rather, it’s to give you a new way to gain insight into vast amounts of data that you haven’t easily been able to tap into before; that is, until a technology like Hadoop got teamed with an analytics leader like IBM. In short, IBM’s goal is to help you meet your analytics challenges and give you a platform to create an end-to-end solution.
xxiv About this Book
spectrum, an automatic transmission doesn’t give you granular control when you need it, but is far easier to operate. IBM’s Big Data platform has morphed itself a Porsche-like Doppelkupplung transmission—you can use it in auto-matic mode to get up and running quickly with text analysis for data in mo-tion and data-at-rest, and you can take control and extend or roll your own analytics to deliver localized capability as required. Either way, IBM will get you to the end goal faster than anyone.
When IBM introduced the world to what’s possible in a Smarter Planet a number of years ago, the company recognized that the world had become
instrumented. The transistor has become the basic building block of the digital age. Today, an average car includes more than a million lines of code; there are 3 million lines of code tracking your checked baggage (with that kind of effort, it’s hard to believe that our bags get lost as often as they do); and more than a billion lines of code are included in the workings of the latest Airbus plane.
Quite simply (and shockingly), we now live in a world that has more than a billion transistors per human, each one costing one ten-millionth of a cent; a world with more than 4 billion mobile phone subscribers and about 30 billion radio frequency identification (RFID) tags produced globally within two years. These sensors all generate data across entire ecosystems (supply chains, healthcare facilities, networks, cities, natural systems such as waterways, and so on); some have neat and tidy data structures, and some don’t. One thing these instrumented devices have in common is that they all generate data, and that data holds an opportunity cost. Sadly, due to its voluminous and non-uniform nature, and the costs associated with it, much of this data is sim-ply thrown away or not persisted for any meaningful amount of time, dele-gated to “noise” status because of a lack of efficient mechanisms to derive value from it.
About this Book xxv
Finally, our Smarter Planet has become intelligent. New computing mod-els can handle the proliferation of end user devices, sensors, and actuators, connecting them with back-end systems. When combined with advanced analytics, the right platform can turn mountains of data into intelligence that can be translated into action, turning our systems into intelligent processes. What this all means is that digital and physical infrastructures of the world have arguably converged. There’s computational power to be found in things we wouldn’t traditionally recognize as computers, and included in this is the freeform opportunity to share with the world what you think about pretty much anything. Indeed, almost anything—any person, object, process, or service, for any organization, large or small—can become digitally aware and networked. With so much technology and networking abundantly avail-able, we have to find cost-efficient ways to gain insight from all this accumu-lating data.
A number of years ago, IBM introduced business and leaders to a Smarter Planet: directional thought leadership that redefined how we think about technology and its problem-solving capabilities. It’s interesting to see just how much foresight IBM had when it defined a Smarter Planet, because all of those principles seem to foreshadow the need for a Big Data platform.
Big Data has many use cases; our guess is that we’ll find it to be a ubiqui-tous data analysis technology in the coming years. If you’re trying to get a handle on brand sentiment, you finally have a cost-efficient and capable framework to measure cultural decay rates, opinions, and more. Viral mar-keting is nothing new. After all, one of its earliest practitioners was Pyotr Smirnov (yes, the vodka guy). Smirnov pioneered charcoal filtration, and to get his message out, he’d hire people to drink his vodka at establishments everywhere and boisterously remark as to its taste and the technology be-hind it. Of course, a Smarter Planet takes viral to a whole new level, and a Big Data platform provides a transformational information management plat-form that allows you to gain insight into its effectiveness.
xxvi About this Book
Data platform can deliver ground-breaking capability when it comes to fraud detection algorithms and risk modeling with expanded models that are built on more and more identified causal attributes, with more and more history—the uses are almost limitless.
This book is organized into two parts. Part I—Big Data: From the Business Perspective focuses on the who (it all starts with a kid’s stuffed toy—read the book if that piqued your curiosity), what, where, why, and when (it’s not too late, but if you’re in the Information Management game, you can’t afford to delay any longer) of Big Data. Part I is comprised of three chapters.
Chapter 1 talks about the three defining characteristics of Big Data: volume
(the growth and run rates of data), variety (the kinds of data such as sensor logs, microblogs—think Twitter and Facebook—and more), and velocity (the source speed of data flowing into your enterprise). You’re going to hear these three terms used a lot when it comes to Big Data discussions by IBM, so we’ll often refer to them as “the 3 Vs”, or “V3” throughout this book and in our
speaking engagements. With a firm definition of the characteristics of Big Data you’ll be all set to understand the concepts, use cases, and reasons for the technologies outlined in the remainder of this book. For example, think of a typical day, and focus on the 30 minutes (or so) it takes for one of us to drive into one of the IBM labs: in the amount of time it takes to complete this trip, we’ve generated and have been subjected to an incredible number of Big Data events.
From taking your smartphone out of its holster (yes, that’s a recorded event for your phone), to paying road tolls, to the bridge one of us drives over, to changing an XM radio station, to experiencing a media impression, to checking e-mails (not while driving of course), to badging into the office, to pressing Like on an interesting Facebook post, we’re continually part of Big Data’s V3. By the way, as we’ve implied earlier, you don’t have to breathe
oxygen to generate V3 data. Traffic systems, bridges, engines on airplanes,
your satellite receiver, weather sensors, your work ID card, and a whole lot more, all generate data.
About this Book xxvii
we will contrast and compare Big Data solutions with traditional warehouse solutions that are part of every IT shop. We will say it here and often within the book: Big Data complements existing analysis systems, it does not re-place them (in this chapter we’ll give you a good analogy that should get the point across quite vividly).
Without getting into the technology aspects, Chapter 3 talks about why we think IBM’s Big Data platform is the best solution out there (yes, we work for IBM, but read the chapter; it’s compelling!). If you take a moment to consider Big Data, you’ll realize that it’s not just about getting up and running with Hadoop (the key open source technology that provides a Big Data engine) and operationally managing it with a toolset. Consider this: we can’t think of a single customer who gets excited about buying, managing, and installing tech-nology. Our clients get excited about the opportunities their technologies al-low them to exploit to their benefits; our customers have a vision of the picture they want to paint and we’re going to help you turn into Claude Monet. IBM not only helps you flatten the time it takes to get Big Data up and running, but the fact that IBM has an offering in this space means it brings a whole lot more to the table: a platform. For example, if there’s one concept that IBM is synony-mous with, it is enterprise class. IBM understands fault tolerance, high avail-ability, security, governance, and robustness. So when you step back from the open source Big Data Hadoop offering, you’ll see that IBM is uniquely posi-tioned to harden it for the enterprise. But BigInsights does more than just make Hadoop enterprise reliable and scalable; it makes the data stored in Hadoop easily exploitable without armies of Java programmers and Ph.D. statisticians. Consider that BigInsights adds analytic toolkits, resource management, com-pression, security, and more; you’ll actually be able to take an enterprise-hard-ened Hadoop platform and quickly build a solution without having to buy piece parts or build the stuff yourself.
If you recall earlier in this foreword, we talked about how Big Data tech-nologies are not a replacement for your current techtech-nologies—rather, they are a complement. This implies the obvious: you are going to have to inte-grate Big Data with the rest of your enterprise infrastructure, and you’ll have
governance requirements as well. What company understands data integra-tion and governance better than IBM? It’s a global economy, so if you think
xxviii About this Book
world-class researchers, mathematicians, statisticians, and more: there’s lots of this caliber talent in the halls of IBM, many working on Big Data problems. Think Watson (famous for its winning Jeopardy! performance) as a proof point of what IBM is capable of providing. Of course, you’re going to want support for your Big Data platform, and who can provide direct-to-engineer support, around the world, in a 24×7 manner? What are you going to do with your Big Data? Analyze it! The lineage of IBM’s data analysis platforms (SPSS, Cognos, Smart Analytics Systems, Netezza, text annotators, speech-to-text, and so much more—IBM has spent over $14 billion in the last five years on analytic acquisitions alone) offer immense opportunity for year-after-year extensions to its Big Data platform.
Of course we would be remiss not to mention how dedicated IBM is to the open source community in general. IBM has a rich heritage of supporting open source. Contributions such as the de facto standard integrated develop-ment environdevelop-ment (IDE) used in open source—Eclipse, Unstructured Infor-mation Management Architecture (UIMA), Apache Derby, Lucene, XQuery, SQL, and Xerces XML processor—are but a few of the too many to mention. We want to make one thing very clear—IBM is committed to Hadoop open source. In fact, Jaql (you will learn about this in Chapter 4) was donated to the open source Hadoop community by IBM. Moreover, IBM is continually working on additional technologies for potential Hadoop-related donations. Our development labs have Hadoop committers that work alongside other Hadoop committers from Facebook, LinkedIn, and more. Finally, you are likely to find one of our developers on any Hadoop forum. We believe IBM’s commitment to open source Hadoop, combined with its vast intellectual property and research around enterprise needs and analytics, delivers a true Big Data platform.
Part II—Big Data: From the Technology Perspective starts by giving you some basics about Big Data open source technologies in Chapter 4. This chap-ter lays the “ground floor” with respect to open source technologies that are synonymous with Big Data—the most common being Hadoop (an Apache top-level project whose execution engine is behind the Big Data movement). You’re not going to be a Hadoop expert after reading this chapter, but you’re going to have a basis for understanding such terms as Pig, Hive, HDFS,
About this Book xxix
Chapter 5 is one of the most important chapters in this book. This chapter introduces you to the concept that splits Big Data into two key areas that only IBM seems to be talking about when defining Big Data: Big Data in mo-tion and Big Data at rest. In this chapter, we focus on the at-rest side of the Big Data equation and IBM’s InfoSphere BigInsights (BigInsights), which is the enterprise capable Hadoop platform from IBM. We talk about the IBM technologies we alluded to in Chapter 3—only with technical explanations and illustrations into how IBM differentiates itself with its Big Data plat-form. You’ll learn about how IBM’s General Parallel File system (GPFS), synonymous with enterprise class, has been extended to participate in a Ha-doop environment as GPFS shared nothing cluster (SNC). You’ll learn about how IBM’s BigInsights platform includes a text analytics toolkit with a rich annotation development environment that lets you build or customize text annotators without having to use Java or some other programming lan-guage. You’ll learn about fast data compression without GPL licensing con-cerns in the Hadoop world, special high-speed database connector technol-ogies, machine learning analytics, management tooling, a flexible workload governor that provides a richer business policy–oriented management framework than the default Hadoop workload manager, security lockdown, enhancing MapReduce with intelligent adaptation, and more. After reading this chapter, we think the questions or capabilities you will want your Big Data provider to answer will change and will lead you to ask questions that prove your vendor actually has a real Big Data platform. We truly believe your Big Data journey needs to start with a Big Data platform—powerful analytics tooling that sits on top of world class enterprise-hardened and ca-pable technology.
xxx About this Book
chapter detailing the capabilities that make Streams enterprise-ready, such as high availability, scalability, ease of use, and how it integrates into your existing infrastructure.
We understand that you will spend the better part of a couple of hours of your precious time to read this book; we’re confident by the time you are finished, you’ll have a good handle on the Big Data opportunity that lies ahead, a better understanding of the requirements that will ensure that you have the right Big Data platform, and a strong foundational knowledge as to the business opportunities that lie ahead with Big Data and some of the tech-nologies available.
When we wrote this book, we had to make some tough trade-offs because of its limited size. These decisions were not easy; sometimes we felt we were cheating the technical reader to help the business reader, and sometimes we felt the opposite. In the end, we hope to offer you a fast path to Big Data knowledge and understanding of the unique position IBM is in to make it more and more of a reality in your place of business.
As you travel the roads of your Big Data journey, we think you will find something that you didn’t quite expect when you first started it; since it’s not an epic movie, we’ll tell you now and in a year from now, let us know if we were right. We think you’ll find that not only will Big Data technologies be-come a rich repository commonplace in the enterprise, but also an application platform (akin to WebSphere). You’ll find the need for declarative languages that can be used to build analytic applications in a rich ecosystem that is more integrated than ever into where the data is stored. You’ll find yourself in need of object classes that provide specific kinds of analytics and you’ll demand a development environment that lets you reuse components and customize at will. You’ll require methods to deploy these applications (in a concept similar to Blackberry’s AppWorld or Apple’s AppStore), visualization capabilities, and more.
About this Book xxxi
1
Part I
Big Data:
3
1
What Is Big Data? Hint:
You’re a Part of It Every Day
4 Understanding Big Data
Quite simply, the Big Data era is in full force today because the world is changing. Through instrumentation, we’re able to sense more things, and if we can sense it, we tend to try and store it (or at least some of it). Through advances in communications technology, people and things are becoming increasingly interconnected—and not just some of the time, but all of the time. This interconnectivity rate is a runaway train. Generally referred to as ma-chine-to-machine (M2M), interconnectivity is responsible for double-digit year over year (YoY) data growth rates. Finally, because small integrated circuits are now so inexpensive, we’re able to add intelligence to almost everything.
Even something as mundane as a railway car has hundreds of sensors. On a railway car, these sensors track such things as the conditions experienced by the rail car, the state of individual parts, and GPS-based data for shipment tracking and logistics. After train derailments that claimed extensive losses of life, governments introduced regulations that this kind of data be stored and analyzed to prevent future disasters. Rail cars are also becoming more intelli-gent: processors have been added to interpret sensor data on parts prone to wear, such as bearings, to identify parts that need repair before they fail and cause further damage—or worse, disaster. But it’s not just the rail cars that are intelligent—the actual rails have sensors every few feet. What’s more, the data storage requirements are for the whole ecosystem: cars, rails, railroad crossing sensors, weather patterns that cause rail movements, and so on. Now add this to tracking a rail car’s cargo load, arrival and departure times, and you can very quickly see you’ve got a Big Data problem on your hands. Even if every bit of this data was relational (and it’s not), it is all going to be raw and have very different formats, which makes processing it in a traditional relational system impractical or impossible. Rail cars are just one example, but every-where we look, we see domains with velocity, volume, and variety combining to create the Big Data problem.
What Is Big Data? Hint: You’re a Part of It Every Day 5
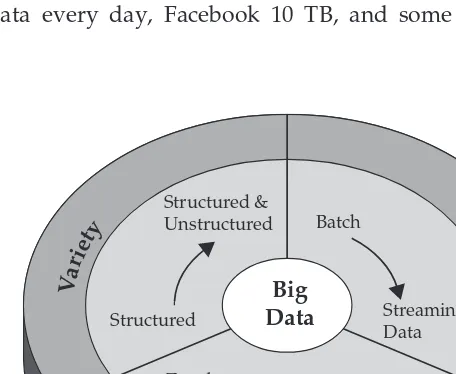
Characteristics of Big Data
Three characteristics define Big Data: volume, variety, and velocity (as shown in Figure 1-1). Together, these characteristics define what we at IBM refer to as “Big Data.” They have created the need for a new class of capabilities to augment the way things are done today to provide better line of site and controls over our existing knowledge domains and the ability to act on them.
The IBM Big Data platform gives you the unique opportunity to extract insight from an immense volume, variety, and velocity of data, in context, beyond what was previously possible. Let’s spend some time explicitly defining these terms.
Can There Be Enough? The Volume of Data
The sheer volume of data being stored today is exploding. In the year 2000, 800,000 petabytes (PB) of data were stored in the world. Of course, a lot of the data that’s being created today isn’t analyzed at all and that’s another prob-lem we’re trying to address with BigInsights. We expect this number to reach 35 zettabytes (ZB) by 2020. Twitter alone generates more than 7 terabytes
6 Understanding Big Data
terabytes of data every hour of every day of the year. It’s no longer unheard of for individual enterprises to have storage clusters holding petabytes of data. We’re going to stop right there with the factoids: Truth is, these esti-mates will be out of date by the time you read this book, and they’ll be fur-ther out of date by the time you bestow your great knowledge of data growth rates on your friends and families when you’re done reading this book.
When you stop and think about it, it’s little wonder we’re drowning in data. If we can track and record something, we typically do. (And notice we didn’t mention the analysis of this stored data, which is going to become a theme of Big Data—the newfound utilization of data we track and don’t use for decision making.) We store everything: environmental data, financial data, medical data, surveillance data, and the list goes on and on. For exam-ple, taking your smartphone out of your holster generates an event; when your commuter train’s door opens for boarding, that’s an event; check in for a plane, badge into work, buy a song on iTunes, change the TV channel, take an electronic toll route—everyone of these actions generates data. Need more? The St. Anthony Falls Bridge (which replaced the 2007 collapse of the I-35W Mississippi River Bridge) in Minneapolis has more than 200 embed-ded sensors positioned at strategic points to provide a fully comprehensive monitoring system where all sorts of detailed data is collected and even a shift in temperature and the bridge’s concrete reaction to that change is avail-able for analysis. Okay, you get the point: There’s more data than ever before and all you have to do is look at the terabyte penetration rate for personal home computers as the telltale sign. We used to keep a list of all the data warehouses we knew that surpassed a terabyte almost a decade ago—suffice to say, things have changed when it comes to volume.
What Is Big Data? Hint: You’re a Part of It Every Day 7
something great, or may be nothing at all, but the “don’t know” is the prob-lem (or the opportunity, depending how you look at it).
The conversation about data volumes has changed from terabytes to pet-abytes with an inevitable shift to zettpet-abytes, and all this data can’t be stored in your traditional systems for reasons that we’ll discuss in this chapter and others.
Variety Is the Spice of Life
The volume associated with the Big Data phenomena brings along new chal-lenges for data centers trying to deal with it: its variety. With the explosion of sensors, and smart devices, as well as social collaboration technologies, data in an enterprise has become complex, because it includes not only traditional re-lational data, but also raw, semistructured, and unstructured data from web pages, web log files (including click-stream data), search indexes, social media forums, e-mail, documents, sensor data from active and passive systems, and so on. What’s more, traditional systems can struggle to store and perform the required analytics to gain understanding from the contents of these logs be-cause much of the information being generated doesn’t lend itself to tradi-tional database technologies. In our experience, although some companies are moving down the path, by and large, most are just beginning to understand the opportunities of Big Data (and what’s at stake if it’s not considered).
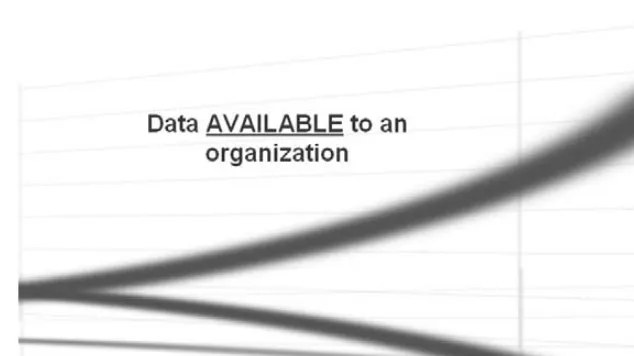
Figure 1-2 The volume of data available to organizations today is on the rise, while
8 Understanding Big Data
Quite simply, variety represents all types of data—a fundamental shift in analysis requirements from traditional structured data to include raw, semis-tructured, and unstructured data as part of the decision-making and insight process. Traditional analytic platforms can’t handle variety. However, an orga-nization’s success will rely on its ability to draw insights from the various kinds of data available to it, which includes both traditional and nontraditional.
When we look back at our database careers, sometimes it’s humbling to see that we spent more of our time on just 20 percent of the data: the relational kind that’s neatly formatted and fits ever so nicely into our strict schemas. But the truth of the matter is that 80 percent of the world’s data (and more and more of this data is responsible for setting new velocity and volume records) is unstructured, or semistructured at best. If you look at a Twitter feed, you’ll see structure in its JSON format—but the actual text is not structured, and under-standing that can be rewarding. Video and picture images aren’t easily or ef-ficiently stored in a relational database, certain event information can dynami-cally change (such as weather patterns), which isn’t well suited for strict schemas, and more. To capitalize on the Big Data opportunity, enterprises must be able to analyze all types of data, both relational and nonrelational: text, sensor data, audio, video, transactional, and more.
How Fast Is Fast? The Velocity of Data
Just as the sheer volume and variety of data we collect and store has changed, so, too, has the velocity at which it is generated and needs to be handled. A con-ventional understanding of velocity typically considers how quickly the data is arriving and stored, and its associated rates of retrieval. While managing all of that quickly is good—and the volumes of data that we are looking at are a con-sequence of how quick the data arrives—we believe the idea of velocity is actu-ally something far more compelling than these conventional definitions.
What Is Big Data? Hint: You’re a Part of It Every Day 9
Sometimes, getting an edge over your competition can mean identifying a trend, problem, or opportunity only seconds, or even microseconds, before someone else. In addition, more and more of the data being produced today has a very short shelf-life, so organizations must be able to analyze this data in near real time if they hope to find insights in this data. Big Data scale
streams computing is a concept that IBM has been delivering on for some time and serves as a new paradigm for the Big Data problem. In traditional pro-cessing, you can think of running queries against relatively static data: for example, the query “Show me all people living in the New Jersey flood zone” would result in a single result set to be used as a warning list of an incoming weather pattern. With streams computing, you can execute a process similar to a continuous query that identifies people who are currently “in the New Jersey flood zones,” but you get continuously updated results, because loca-tion informaloca-tion from GPS data is refreshed in real time.
Dealing effectively with Big Data requires that you perform analytics against the volume and variety of data while it is still in motion, not just after it is at rest. Consider examples from tracking neonatal health to financial markets; in every case, they require handling the volume and variety of data in new ways. The velocity characteristic of Big Data is one key differentiator that makes IBM the best choice for your Big Data platform. We define it as an
inclusional shift from solely batch insight (Hadoop style) to batch insight combined with streaming-on-the-wire insight, and IBM seems to be the only vendor talking about velocity being more than how fast data is generated (which is really part of the volume characteristic).
Now imagine a cohesive Big Data platform that can leverage the best of both worlds and take streaming real-time insight to spawn further research based on emerging data. As you think about this, we’re sure you’ll start to share the same excitement we have around the unique proposition available with an IBM Big Data platform.
Data in the Warehouse and Data in
Hadoop (It’s Not a Versus Thing)
10 Understanding Big Data
platform is well suited to deal with semistructured and unstructured data, as well as when a data discovery process is needed. That isn’t to say that Hadoop can’t be used for structured data that is readily available in a raw format; because it can, and we talk about that in Chapter 2.
In addition, when you consider where data should be stored, you need to understand how data is stored today and what features characterize your persistence options. Consider your experience with storing data in a tradi-tional data warehouse. Typically, this data goes through a lot of rigor to make it into the warehouse. Builders and consumers of warehouses have it etched in their minds that the data they are looking at in their warehouses must shine with respect to quality; subsequently, it’s cleaned up via cleans-ing, enrichment, matchcleans-ing, glossary, metadata, master data management, modeling, and other services before it’s ready for analysis. Obviously, this can be an expensive process. Because of that expense, it’s clear that the data that lands in the warehouse is deemed not just of high value, but it has a broad purpose: it’s going to go places and will be used in reports and dash-boards where the accuracy of that data is key. For example, Sarbanes-Oxley (SOX) compliance, introduced in 2002, requires the CEO and CFO of publicly traded companies on U.S.-based exchanges to certify the accuracy of their financial statements (Section 302, “Corporate Responsibility for Financial Re-ports”). There are serious (we’re talking the potential for jail time here) pen-alties associated if the data being reported isn’t accurate or “true.” Do you think these folks are going to look at reports of data that aren’t pristine?
In contrast, Big Data repositories rarely undergo (at least initially) the full quality control rigors of data being injected into a warehouse, because not only is prepping data for some of the newer analytic methods characterized by Hadoop use cases cost prohibitive (which we talk about in the next chap-ter), but the data isn’t likely to be distributed like data warehouse data. We could say that data warehouse data is trusted enough to be “public,” while Hadoop data isn’t as trusted (public can mean vastly distributed within the company and not for external consumption), and although this will likely change in the future, today this is something that experience suggests char-acterizes these repositories.
What Is Big Data? Hint: You’re a Part of It Every Day 11
Hadoop-based repository scheme where the entire business entity is likely to be stored and the fidelity of the Tweet, transaction, Facebook post, and more is kept intact. Data in Hadoop might seem of low value today, or its value nonquantified, but it can in fact be the key to questions yet unasked. IT de-partments pick and choose high-valued data and put it through rigorous cleansing and transformation processes because they know that data has a
high known value per byte(a relative phrase, of course). Why else would a company put that data through so many quality control processes? Of course, since the value per byte is high, the business is willing to store it on rela-tively higher cost infrastructure to enable that interactive, often public, navi-gation with the end user communities, and the CIO is willing to invest in cleansing the data to increase its value per byte.
With Big Data, you should consider looking at this problem from the op-posite view: With all the volume and velocity of today’s data, there’s just no way that you can afford to spend the time and resources required to cleanse and document every piece of data properly, because it’s just not going to be economical. What’s more, how do you know if this Big Data is even valu-able? Are you going to go to your CIO and ask her to increase her capital expenditure (CAPEX) and operational expenditure (OPEX) costs by four-fold to quadruple the size of your warehouse on a hunch? For this reason, we like to characterize the initial nonanalyzed raw Big Data as having a lowvalue per byte, and, therefore, until it’s proven otherwise, you can’t afford to take the path to the warehouse; however, given the vast amount of data, the po-tential for great insight (and therefore greater competitive advantage in your own market) is quite high if you can analyze all of that data.
At this point, it’s pertinent to introduce the idea of cost per compute, which follows the same pattern as the value per byte ratio. If you consider the focus on the quality data in traditional systems we outlined earlier, you can con-clude that the cost per compute in a traditional data warehouse is relatively high (which is fine, because it’s a proven and known higher value per byte), versus the cost of Hadoop, which is low.
12 Understanding Big Data
Indeed, some warehouses are built with a predefined corpus of questions in mind. Although such a warehouse provides some degree of freedom for query and mining, it could be that it’s constrained by what is in the schema (most unstructured data isn’t found here) and often by a performance envelope that can be a functional/operational hard limit. Again, as we’ll reiterate often in this book, we are not saying a Hadoop platform such as IBM InfoSphere BigInsights is a replacement for your warehouse; instead, it’s a complement.
A Big Data platform lets you store all of the data in its native business object format and get value out of it through massive parallelism on readily available components. For your interactive navigational needs, you’ll con-tinue to pick and choose sources and cleanse that data and keep it in ware-houses. But you can get more value out of analyzing more data (that may even initially seem unrelated) in order to paint a more robust picture of the issue at hand. Indeed, data might sit in Hadoop for a while, and when you discover its value, it might migrate its way into the warehouse when its value is proven and sustainable.
Wrapping It Up
We’ll conclude this chapter with a gold mining analogy to articulate the points from the previous section and the Big Data opportunity that lies be-fore you. In the “olden days” (which, for some reason, our kids think is a time when we were their age), miners could actually see nuggets or veins of gold; they clearly appreciated the value and would dig and sift near previous gold finds hoping to strike it rich. That said, although there was more gold out there—it could have been in the hill next to them or miles away—it just wasn’t visible to the naked eye, and it became a gambling game. You dug like crazy near where gold was found, but you had no idea whether more gold would be found. And although history has its stories of gold rush fevers, nobody mobilized millions of people to dig everywhere and anywhere.
What Is Big Data? Hint: You’re a Part of It Every Day 13
process lots of dirt and keep the flakes of gold you find. The flakes of gold are then taken for integration and put together to make a bar of gold, which is stored and logged in a place that’s safe, governed, valued, and trusted.
15
2
Why Is Big Data Important?
This chapter’s
title describes exactly what we’re going to cover: Why is Big Data important? We’re also going to discuss some of our real customer experiences, explaining how we’ve engaged and helped develop new ap-plications and potential approaches to solving previously difficult—if not impossible—challenges for our clients. Finally, we’ll highlight a couple us-age patterns that we repeatedly encounter in our engus-agements that cry out for the kind of help IBM’s Big Data platform, comprised of IBM InfoSphere BigInsights (BigInsights) and IBM InfoSphere Streams (Streams), can offer.When to Consider a Big Data Solution
The term Big Data can be interpreted in many different ways and that’s why in Chapter 1 we defined Big Data as conforming to the volume, velocity, and variety (V3) attributes that characterize it. Note that Big Data solutions aren’t
a replacement for your existing warehouse solutions, and in our humble opinion, any vendor suggesting otherwise likely doesn’t have the full gambit of experience or understanding of your investments in the traditional side of information management.
16 Understanding Big Data
•
Big Data solutions are ideal for analyzing not only raw structured data, but semistructured and unstructured data from a wide variety of sources.•
Big Data solutions are ideal when all, or most, of the data needs to be analyzed versus a sample of the data; or a sampling of data isn’t nearly as effective as a larger set of data from which to derive analysis.•
Big Data solutions are ideal for iterative and exploratory analysis when business measures on data are not predetermined.When it comes to solving information management challenges using Big Data technologies, we suggest you consider the following:
•
Is the reciprocal of the traditional analysis paradigm appropriate for the business task at hand? Better yet, can you see a Big Data platform complementing what you currently have in place for analysis and achieving synergy with existing solutions for better business outcomes? For example, typically, data bound for the analytic warehouse has tobe cleansed, documented, and trusted before it’s neatly placed into a strict warehouse schema (and, of course, if it can’t fit into a traditional row and column format, it can’t even get to the warehouse in most cases). In contrast, a Big Data solution is not only going to leverage data not typically suitable for a traditional warehouse environment, and in massive amounts of volume, but it’s going to give up some of the formalities and “strictness” of the data. The benefit is that you can preserve the fidelity of data and gain access to mountains of
information for exploration and discovery of business insights before
running it through the due diligence that you’re accustomed to; the data that can be included as a participant of a cyclic system, enriching the models in the warehouse.
•
Big Data is well suited for solving information challenges that don’t natively fit within a traditional relational database approach for handling the problem at hand.Why Is Big Data Important? 17
A good analogy here is your left and right hands; each offers individual strengths and optimizations for a task at hand. For example, if you’ve ever played baseball, you know that one hand is better at throwing and the other at catching. It’s likely the case that each hand could try to do the other task that it isn’t a natural fit for, but it’s very awkward (try it; better yet, film your-self trying it and you will see what we mean). What’s more, you don’t see baseball players catching with one hand, stopping, taking off their gloves, and throwing with the same hand either. The left and right hands of a base-ball player work in unison to deliver the best results. This is a loose analogy to traditional database and Big Data technologies: Your information plat-form shouldn’t go into the future without these two important entities work-ing together, because the outcomes of a cohesive analytic ecosystem deliver premium results in the same way your coordinated hands do for baseball. There exists some class of problems that don’t natively belong in traditional databases, at least not at first. And there’s data that we’re not sure we want in the warehouse, because perhaps we don’t know if it’s rich in value, it’s unstructured, or it’s too voluminous. In many cases, we can’t find out the value per byte of the data until after we spend the effort and money to put it into the warehouse; but we want to be sure that data is worth saving and has a high value per byte before investing in it.
Big Data Use Cases:
Patterns for Big Data Deployment
This chapter is about helping you understand why Big Data is important. We could cite lots of press references around Big Data, upstarts, and chatter, but that makes it sound more like a marketing sheet than an inflection point. We believe the best way to frame why Big Data is important is to share with you a number of our real customer experiences regarding usage patterns they are facing (and problems they are solving) with an IBM Big Data platform. These patterns represent great Big Data opportunities—business problems that weren’t easy to solve before—and help you gain an understanding of how Big Data can help you (or how it’s helping your competitors make you less competitive if you’re not paying attention).
18 Understanding Big Data
this book) is applicable to every industry we serve. We could cover hun-dreds of use cases in this chapter, but in the interest of space, we’ll discuss six that expose some of the most common usage patterns we see. Although the explanations of the usage patterns might be industry-specific, many are broadly cross-industry applicable (which is how we settled on them). You’ll find a common trait in all of the usage patterns discussed here: They all involve a new way of doing things that is now more practical and finally possible with Big Data technologies.
IT for IT Log Analytics
Log analytics is a common use case for an inaugural Big Data project. We like to refer to all those logs and trace data that are generated by the operation of your IT solutions as data exhaust. Enterprises have lots of data exhaust, and it’s pretty much a pollutant if it’s just left around for a couple of hours or days in case of emergency and simply purged. Why? Because we believe data exhaust has concentrated value, and IT shops need to figure out a way to store and extract value from it. Some of the value derived from data ex-haust is obvious and has been transformed into value-added click-stream data that records every gesture, click, and movement made on a web site.
Some data exhaust value isn’t so obvious. At the DB2 development labs in Toronto (Ontario, Canada) engineers derive terrific value by using BigIn-sights for performance optimization analysis. For example, consider a large, clustered transaction-based database system and try to preemptively find out where small optimizations in correlated activities across separate servers might be possible. There are needles (some performance optimizations) within a haystack (mountains of stack trace logs across many servers). Try-ing to find correlation across tens of gigabytes of per core stack trace infor-mation is indeed a daunting task, but a Big Data platform made it possible to identify previously unreported areas for performance optimization tuning.
Why Is Big Data Important? 19
We think that IT yearns (or should yearn) for log longevity. We also think that both business and IT know there is value in these logs, and that’s why we of-ten see lines of business duplicating these logs and ending up with scattershot retention and nonstandard (or duplicative) analytic systems that vary greatly by team. Not only is this ultimately expensive (more aggregate data needs to be stored—often in expensive systems), but since only slices of the data are available, it is nearly impossible to determine holistic trends and issues that span such a limited retention time period and views of the information.
Today this log history can be retained, but in most cases, only for several days or weeks at a time, because it is simply too much data for conventional systems to store, and that, of course, makes it impossible to determine trends and issues that span such a limited retention time period. But there are more reasons why log analysis is a Big Data problem aside from its voluminous nature. The nature of these logs is semistructured and raw, so they aren’t al-ways suited for traditional database processing. In addition, log formats are constantly changing due to hardware and software upgrades, so they can’t be tied to strict inflexible analysis paradigms. Finally, not only do you need to perform analysis on the longevity of the logs to determine trends and pat-terns and to pinpoint failures, but you need to ensure the analysis is done on all the data.
Log analytics is actually a pattern that IBM established after working with a number of companies, including some large financial services sector (FSS) companies. We’ve seen this use case come up with quite a few customers since; for that reason, we’ll call this pattern IT for IT. If you can relate, we don’t have to say anything else. If you’re new to this usage pattern and won-dering just who’s interested in IT for IT Big Data solutions, you should know that this is an internal use case within an organization itself. For example, often non-IT business entities want this data provided to them as a kind of service bureau. An internal IT for IT implementation is well suited for any organization with a large data center footprint, especially if it is relatively complex. For example, service-oriented architecture (SOA) applications with lots of moving parts, federated data centers, and so on, all suffer from the same issues outlined in this section.