Python Data Visualization
Cookbook
Second Edition
Over 70 recipes, based on the principal concepts
of data visualization, to get you started with popular
Python libraries
Igor Milovanović
Dimitry Foures
Giuseppe Vettigli
Python Data Visualization Cookbook
Second Edition
Copyright © 2015 Packt Publishing
All rights reserved. No part of this book may be reproduced, stored in a retrieval system, or transmitted in any form or by any means, without the prior written permission of the publisher, except in the case of brief quotations embedded in critical articles or reviews.
Every effort has been made in the preparation of this book to ensure the accuracy of the information presented. However, the information contained in this book is sold without warranty, either express or implied. Neither the authors, nor Packt Publishing, and its dealers and distributors will be held liable for any damages caused or alleged to be caused directly or indirectly by this book.
Packt Publishing has endeavored to provide trademark information about all of the companies and products mentioned in this book by the appropriate use of capitals. However, Packt Publishing cannot guarantee the accuracy of this information.
First published: November 2013
Second edition: November 2015
Production reference: 1261115
Published by Packt Publishing Ltd. Livery Place
35 Livery Street
Birmingham B3 2PB, UK.
ISBN 978-1-78439-669-5
Credits
Authors
Igor Milovanović
Dimitry Foures
Giuseppe Vettigli
Reviewer
Kostiantyn Kucher
Commissioning Editor Akram Hussain
Acquisition Editor Meeta Rajani
Content Development Editor Mayur Pawanikar
Technical Editor
Anushree Arun Tendulkar
Copy Editor Charlotte Carneiro
Project Coordinator Nidhi Joshi
Proofreader
Safis Editing
Indexer Rekha Nair
Graphics Jason Monteiro
Production Coordinator Manu Joseph
About the Authors
Igor Milovanović
is an experienced developer, with strong background in Linux system knowledge and software engineering education, he is skilled in building scalable data-driven distributed software rich systems.Evangelist for high-quality systems design who holds strong interests in software architecture and development methodologies, Igor is always persistent on advocating methodologies which promote high-quality software, such as test-driven development, one-step builds and continuous integration.
He also possesses solid knowledge of product development. Having field experience and official training, he is capable of transferring knowledge and communication flow from business to developers and vice versa.
Igor is most grateful to his girlfriend for letting him spent hours on the work instead with her and being avid listener to his endless book monologues. He thanks his brother for being the strongest supporter. He is thankful to his parents to let him develop in various ways and become a person he is today.
Dimitry Foures
is a data scientist with a background in applied mathematics and theoretical physics. After completing his undergraduate studies in physics at ENS Lyon (France), he studied fluid mechanics at École Polytechnique in Paris where he obtained a first class master's. He holds a PhD in applied mathematics from the University of Cambridge. He currently works as a data scientist for a smart-energy startup in Cambridge, in close collaboration with the university.About the Reviewer
Kostiantyn Kucher
was born in Odessa, Ukraine. He received his master's degree in computer science from Odessa National Polytechnic University in 2012, and he has used Python as well as matplotlib and PIL for machine learning and image recognition purposes.Since 2013, Kostiantyn has been a PhD student in computer science specializing in information visualization. He conducts his research under the supervision of Prof. Dr. Andreas Kerren with the ISOVIS group at the Computer Science department of Linnaeus University (Växjö, Sweden).
www.PacktPub.com
Support files, eBooks, discount offers, and more
For support files and downloads related to your book, please visit www.PacktPub.com.Did you know that Packt offers eBook versions of every book published, with PDF and ePub files available? You can upgrade to the eBook version at www.PacktPub.com and as a print book customer, you are entitled to a discount on the eBook copy. Get in touch with us at [email protected] for more details.
At www.PacktPub.com, you can also read a collection of free technical articles, sign up for a range of free newsletters and receive exclusive discounts and offers on Packt books and eBooks.
TM
https://www2.packtpub.com/books/subscription/packtlib
Do you need instant solutions to your IT questions? PacktLib is Packt's online digital book library. Here, you can search, access, and read Packt's entire library of books.
Why Subscribe?
f Fully searchable across every book published by Packt
f Copy and paste, print, and bookmark content
f On demand and accessible via a web browser
Free Access for Packt account holders
Table of Contents
Preface v
Chapter 1: Preparing Your Working Environment
1
Introduction 1
Installing matplotlib, NumPy, and SciPy 2
Installing virtualenv and virtualenvwrapper 4
Installing matplotlib on Mac OS X 7
Installing matplotlib on Windows 9
Installing Python Imaging Library (PIL) for image processing 10
Installing a requests module 11
Customizing matplotlib's parameters in code 12
Customizing matplotlib's parameters per project 14
Chapter 2: Knowing Your Data
17
Introduction 17
Importing data from CSV 18
Importing data from Microsoft Excel files 20
Importing data from fixed-width data files 23
Importing data from tab-delimited files 25
Importing data from a JSON resource 27
Exporting data to JSON, CSV, and Excel 29
Importing and manipulating data with Pandas 34
Importing data from a database 35
Cleaning up data from outliers 40
Reading files in chunks 45
Reading streaming data sources 47
Importing image data into NumPy arrays 49
Generating controlled random datasets 55
Table of Contents
Chapter 3: Drawing Your First Plots and Customizing Them
69
Introduction 70
Defining plot types – bar, line, and stacked charts 70
Drawing simple sine and cosine plots 76
Defining axis lengths and limits 79
Defining plot line styles, properties, and format strings 82
Setting ticks, labels, and grids 87
Adding legends and annotations 90
Moving spines to the center 93
Making histograms 95
Making bar charts with error bars 97
Making pie charts count 100
Plotting with filled areas 102
Making stacked plots 104
Drawing scatter plots with colored markers 107
Chapter 4: More Plots and Customizations
111
Introduction 111
Setting the transparency and size of axis labels 112
Adding a shadow to the chart line 114
Adding a data table to the figure 118
Using subplots 120
Customizing grids 123
Creating contour plots 128
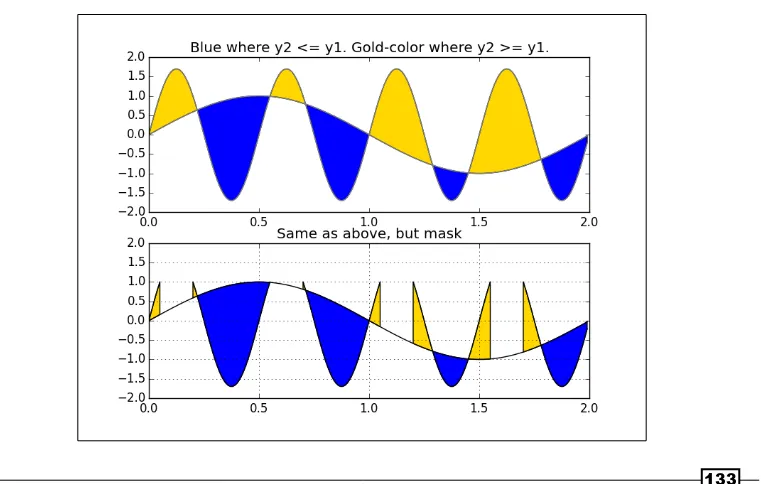
Filling an under-plot area 131
Drawing polar plots 134
Visualizing the filesystem tree using a polar bar 136
Customizing matplotlib with style 140
Chapter 5: Making 3D Visualizations
143
Introduction 143
Creating 3D bars 143
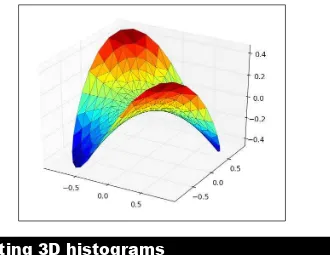
Creating 3D histograms 147
Animating in matplotlib 150
Animating with OpenGL 154
Chapter 6: Plotting Charts with Images and Maps
159
Introduction 159
Processing images with PIL 160
Plotting with images 166
Displaying images with other plots in the figure 171
Table of Contents
Plotting data on a map using the Google Map API 179
Generating CAPTCHA images 185
Chapter 7: Using the Right Plots to Understand Data
191
Introduction 191
Understanding logarithmic plots 192
Understanding spectrograms 195
Creating stem plot 200
Drawing streamlines of vector flow 204
Using colormaps 208
Using scatter plots and histograms 213
Plotting the cross correlation between two variables 221
Importance of autocorrelation 224
Chapter 8: More on matplotlib Gems
229
Introduction 229
Drawing barbs 229
Making a box-and-whisker plot 233
Making Gantt charts 236
Making error bars 241
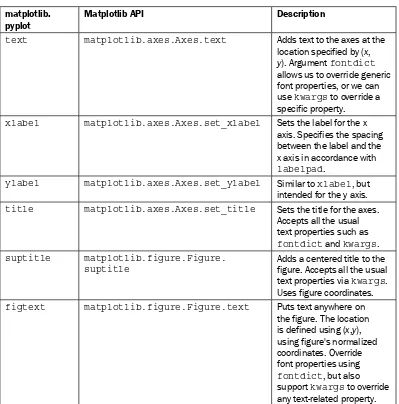
Making use of text and font properties 244
Rendering text with LaTeX 251
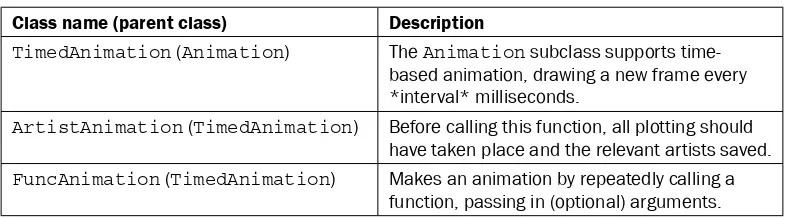
Understanding the difference between pyplot and OO API 255
Chapter 9:
Visualizations on the Clouds with Plot.ly
261
Introduction 261
Creating line charts 262
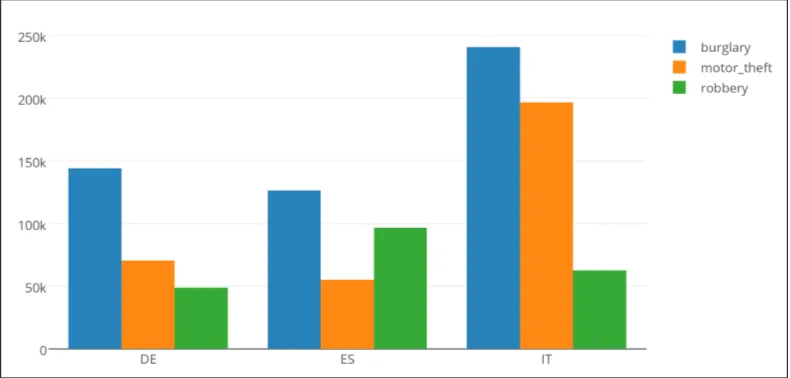
Creating bar charts 266
Plotting a 3D trefoil knot 269
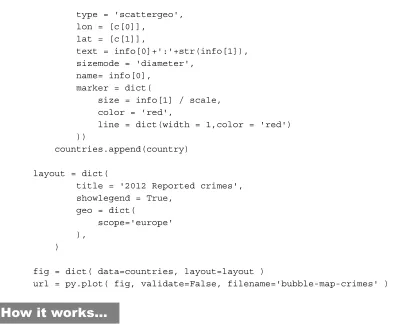
Visualizing maps and bubbles 272
Preface
The best data is the data that we can see and understand. As developers and data scientists, we want to create and build the most comprehensive and understandable visualizations. It is not always simple; we need to find the data, read it, clean it, filter it, and then use the right tool to visualize it. This book explains the process of how to read, clean, and visualize the data into information with straight and simple (and sometimes not so simple) recipes.
How to read local data, remote data, CSV, JSON, and data from relational databases are all explained in this book.
Some simple plots can be plotted with one simple line in Python using matplotlib, but performing more advanced charting requires knowledge of more than just Python. We need to understand information theory and human perception aesthetics to produce the most appealing visualizations.
This book will explain some practices behind plotting with matplotlib in Python, statistics used, and usage examples for different charting features that we should use in an optimal way.
What this book covers
Chapter 1, Preparing Your Working Environment, covers a set of installation recipes and advice on how to install the required Python packages and libraries on your platform.
Chapter 2, Knowing Your Data, introduces you to common data formats and how to read and write them, be it CSV, JSON, XSL, or relational databases.
Chapter 3, Drawing Your First Plots and Customizing Them, starts with drawing simple plots and covers some customization.
Chapter 4, More Plots and Customizations, follows up from the previous chapter and covers more advanced charts and grid customization.
Chapter 6, Plotting Charts with Images and Maps, deals with image processing, projecting data onto maps, and creating CAPTCHA test images.
Chapter 7, Using Right Plots to Understand Data, covers explanations and recipes on some more advanced plotting techniques such as spectrograms and correlations.
Chapter 8, More on matplotlib Gems, covers a set of charts such as Gantt charts, box plots, and whisker plots, and it also explains how to use LaTeX for rendering text in matplotlib.
Chapter 9, Visualizations on the Clouds with Plot.ly, introduces how to use Plot.ly to create and share your visualizations on its cloud environment.
What you need for this book
For this book, you will need Python 2.7.3 or a later version installed on your operating system.
Another software package used in this book is IPython, which is an interactive Python environment that is very powerful and flexible. This can be installed using package managers for Linux-based OSes or prepared installers for Windows and Mac OS X.
If you are new to Python installation and software installation in general, it is highly recommended to use prepackaged scientific Python distributions such as Anaconda, Enthought Python Distribution or Python(x, y).
Other required software mainly comprises Python packages that are all installed using the Python installation manager, pip, which itself is installed using Python's easy_install setup tool.
Who this book is for
Python Data Visualization Cookbook, Second Edition is for developers and data scientists who already use Python and want to learn how to create visualizations of their data in a practical way. If you have heard about data visualization but don't know where to start, this book will guide you from the start and help you understand data, data formats, data visualization, and how to use Python to visualize data.
Preface
Sections
In this book, you will find several headings that appear frequently (Getting ready, How to do it, How it works, There's more, and See also).
To give clear instructions on how to complete a recipe, we use these sections as follows:
Getting ready
This section tells you what to expect in the recipe, and describes how to set up any software or any preliminary settings required for the recipe.
How to do it…
This section contains the steps required to follow the recipe.
How it works…
This section usually consists of a detailed explanation of what happened in the previous section.
There's more…
This section consists of additional information about the recipe in order to make the reader more knowledgeable about the recipe.
See also
This section provides helpful links to other useful information for the recipe.
Conventions
In this book, you will find a number of styles of text that distinguish between different kinds of information. Here are some examples of these styles and an explanation of their meaning.
A block of code is set as follows:
def my_function(x): return x*x
When we wish to draw your attention to a particular part of a code block, the relevant lines or items are set in bold:
for a in range(10): print a
Any command-line input or output is written as follows:
$ sudo python setup.py install
Warnings or important notes appear in a box like this.
Tips and tricks appear like this.
Reader feedback
Feedback from our readers is always welcome. Let us know what you think about this book—what you liked or may have disliked. Reader feedback is important for us to develop titles that you really get the most out of.
To send us general feedback, simply send an e-mail to [email protected], and mention the book title via the subject of your message.
If there is a topic that you have expertise in and you are interested in either writing or contributing to a book, see our author guide on www.packtpub.com/authors.
Customer support
Preface
Downloading the example code
You can download the example code files for all Packt books you have purchased from your account at http://www.packtpub.com. If you purchased this book elsewhere, you can visit http://www.packtpub.com/support and register to have the files e-mailed directly to you.
Downloading the color images of this book
We also provide you with a PDF file that has color images of the screenshots/diagrams used in this book. The color images will help you better understand the changes in the output. You can download this file from: http://www.packtpub.com/sites/default/files/ downloads/PythonDataVisualizationCookbookSecondEdition_ColoredImages. pdf.
Errata
Although we have taken every care to ensure the accuracy of our content, mistakes do happen. If you find a mistake in one of our books—maybe a mistake in the text or the code—we would be grateful if you would report this to us. By doing so, you can save other readers from frustration and help us improve subsequent versions of this book. If you find any errata, please report them by visiting http://www.packtpub.com/submit-errata, selecting your book, clicking on the errata submission form link, and entering the details of your errata. Once your errata are verified, your submission will be accepted and the errata will be uploaded on our website, or added to any list of existing errata, under the Errata section of that title. Any existing errata can be viewed by selecting your title from http://www.packtpub.com/support.
Piracy
Piracy of copyright material on the Internet is an ongoing problem across all media. At Packt, we take the protection of our copyright and licenses very seriously. If you come across any illegal copies of our works, in any form, on the Internet, please provide us with the location address or website name immediately so that we can pursue a remedy.
Please contact us at [email protected] with a link to the suspected pirated material.
We appreciate your help in protecting our authors, and our ability to bring you valuable content.
Questions
1
Preparing Your
Working Environment
In this chapter, you will cover the following recipes:
f Installing matplotlib, NumPy, and SciPy
f Installing virtualenv and virtualenvwrapper
f Installing matplotlib on Mac OS X
f Installing matplotlib on Windows
f Installing Python Imaging Library (PIL) for image processing
f Installing a requests module
f Customizing matplotlib's parameters in code f Customizing matplotlib's parameters per project
Introduction
This chapter introduces the reader to the essential tooling and their installation and
Installing matplotlib, NumPy, and SciPy
This chapter describes several ways of installing matplotlib and required dependencies under Linux.Getting ready
We assume that you already have Linux (preferably Debian/Ubuntu or RedHat/SciLinux) installed and Python installed on it. Usually, Python is already installed on the mentioned Linux distributions and, if not, it is easily installable through standard means. We assume that Python 2.7+ Version is installed on your workstation.
Almost all code should work with Python 3.3+ Versions, but since most operating systems still deliver Python 2.7 (some even Python 2.6), we decided to write the Python 2.7 Version code. The differences are small, mainly in the version of packages and some code (xrange
should be substituted with range in Python 3.3+).
We also assume that you know how to use your OS package manager in order to install software packages and know how to use a terminal.
The build requirements must be satisfied before matplotlib can be built.
matplotlib requires NumPy, libpng, and freetype as build dependencies. In order to be able to build matplotlib from source, we must have installed NumPy. Here's how to do it:
Install NumPy (1.5+ if you want to use it with Python 3) from http://www.numpy.org/
NumPy will provide us with data structures and mathematical functions for using it with large datasets. Python's default data structures such as tuples, lists, or dictionaries are great for insertions, deletions, and concatenation. NumPy's data structures support "vectorized" operations and are very efficient for use and for executions. They are implemented with big data in mind and rely on C implementations that allow efficient execution time.
SciPy, building on top of NumPy, is the de facto standard's scientific and numeric toolkit for Python comprising a great selection of special functions and algorithms, most of them actually implemented in C and Fortran, coming from the well-known Netlib repository (http://www.netlib.org).
Perform the following steps for installing NumPy:
1. Install the Python-NumPy package:
2. Check the installed version:
$ python -c 'import numpy; print numpy.__version__'
3. Install the required libraries:
libpng 1.2: PNG files support (requires zlib)
freetype 1.4+: True type font support
$ sudo apt-get build-dep python-matplotlib
If you are using RedHat or a variation of this distribution (Fedora, SciLinux, or CentOS), you can use yum to perform the same installation:
$ su -c 'yum-builddep python-matplotlib'
How to do it...
There are many ways one can install matplotlib and its dependencies: from source, precompiled binaries, OS package manager, and with prepackaged Python distributions with built-in matplotlib.
Most probably the easiest way is to use your distribution's package manager. For Ubuntu that should be:
# in your terminal, type:
$ sudo apt-get install python-numpy python-matplotlib python-scipy
If you want to be on the bleeding edge, the best option is to install from source. This path comprises a few steps: get the source code, build requirements, and configure, compile, and install.
Download the latest source from code host SourceForge by following these steps:
$ cd ~/Downloads/
$ sudo python setup.py install
Downloading the example code
You can download the example code files for all the Packt books you have
How it works...
We use standard Python Distribution Utilities, known as Distutils, to install matplotlib from the source code. This procedure requires us to previously install dependencies, as we already explained in the Getting ready section of this recipe. The dependencies are installed using the standard Linux packaging tools.
There's more...
There are more optional packages that you might want to install depending on what your data visualization projects are about.
No matter what project you are working on, we recommend installing IPython—an Interactive Python shell where you already have matplotlib and related packages, such as NumPy and SciPy, imported and ready to play with. Please refer to IPython's official site on how to install it and use it—it is, though, very straightforward.
Installing virtualenv and virtualenvwrapper
If you are working on many projects simultaneously, or even just switching between them frequently, you'll find that having everything installed system-wide is not the best option and can bring problems in future on different systems (production) where you want to run your software. This is not a good time to find out that you are missing a certain package or you're having versioning conflicts between packages that are already installed on production system; hence, virtualenv.
virtualenv is an open source project started by Ian Bicking that enables a developer to isolate working environments per project, for easier maintenance of different package versions.
For example, you inherited legacy Django website based on Django 1.1 and Python 2.3, but at the same time you are working on a new project that must be written in Python 2.6. This is my usual case—having more than one required Python version (and related packages)— depending on the project I am working on.
Getting ready
To install virtualenv, you must have a workable installation of Python and pip. Pip is a tool for installing and managing Python packages, and it is a replacement for easy_install. We will use pip through most of this book for package management. Pip is easily installed, as root executes the following line in your terminal:
# easy_install pip
virtualenv by itself is really useful, but with the help of virtualenvwrapper, all this becomes easy to do and also easy to organize many virtual environments. See all the features at http://virtualenvwrapper.readthedocs.org/en/latest/#features.
How to do it...
By performing the following steps, you can install the virtualenv and virtualenvwrapper tools:
1. Install virtualenv and virtualenvwrapper:
$ sudo pip install virtualenv
$ sudo pip install virtualenvwrapper
# Create folder to hold all our virtual environments and export the path to it.
$ export VIRTENV=~/.virtualenvs $ mkdir -p $VIRTENV
# We source (ie. execute) shell script to activate the wrappers $ source /usr/local/bin/virtualenvwrapper.sh
# And create our first virtual environment $ mkvirtualenv virt1
2. You can now install our favorite package inside virt1: (virt1)user1:~$ pip install matplotlib
3. You will probably want to add the following line to your ~/.bashrc file:
source /usr/loca/bin/virtualenvwrapper.sh
A few useful and most frequently used commands are as follows:
f mkvirtualenv ENV: This creates a virtual environment with the name ENV and activates it
f workon ENV: This activates the previously created ENV
pip not only provides you with a practical way of installing packages, but it also is a good solution for keeping track of the python packages installed on your system, as well as their version. The command pip freeze will print all the installed packages on your current environment, followed by their version number:
$ pip freeze
In this case, we see that even though we simply installed matplotlib, many other packages are also installed. Apart from wsgiref, which is used by pip itself, these are required dependencies of matplotlib which have been automatically installed.
When transferring a project from an environment (possibly a virtual environment) to another, the receiving environment needs to have all the necessary packages installed (in the same version as in the original environment) in order to be sure that the code can be properly run. This can be problematic as two different environments might not contain the same packages, and, worse, might contain different versions of the same package. This can lead to conflicts or unexpected behaviors in the execution of the program.
In order to avoid this problem, pip freeze can be used to save a copy of the current environment configuration. The command will save the output of the command to the file requirements.txt:
$ pip freeze > requirements.txt
In a new environment, this file can be used to install all the required libraries. Simply run:
$ pip install -r requirements.txt
The overall workflow from one machine to another is therefore:
f On machine 1:
$ mkvirtualenv env1
(env1)$ pip install matplotlib
(env1)$ pip freeze > requirements.txt
f On machine 2:
$ mkvirtualenv env2
(env2)$ pip install -r requirements.txt
Installing matplotlib on Mac OS X
The easiest way to get matplotlib on the Mac OS X is to use prepackaged python distributions such as Enthought Python Distribution (EPD). Just go to the EPD site, and download and install the latest stable version for your OS.
In case you are not satisfied with EPD or cannot use it for other reasons such as the versions distributed with it, there is a manual (read: harder) way of installing Python, matplotlib, and its dependencies.
Getting ready
We will use the Homebrew (you could also use MacPorts in the same way) project that eases the installation of all software that Apple did not install on your OS, including Python and matplotlib. Under the hood, Homebrew is a set of Ruby and Git that automate download and installation. Following these instructions should get the installation working. First, we will install Homebrew, and then Python, followed by tools such as virtualenv, then dependencies for matplotlib (NumPy and SciPy), and finally matplotlib. Hold on, here we go.
How to do it...
1. In your terminal, paste and execute the following command:
ruby -e "$(curl -fsSL https://raw.githubusercontent.com/Homebrew/ install/master/install)"
2. Next, add the Homebrew directory to your system path, so the packages you install using Homebrew have greater priority than other versions. Open ~/.bash_profile (or /Users/[your-user-name]/.bash_profile) and add the following line to the end of file:
export PATH=/usr/local/bin:$PATH
3. You will need to restart the terminal so that it picks a new path. Installing Python is as easy as firing up another one liner:
brew install python --framework --universal
This will also install any prerequisites required by Python.
4. Now, you need to update your path (add to the same line):
export PATH=/usr/local/share/python:/usr/local/bin:$PATH
5. To verify that the installation has worked, type python --version in the command line, you should see 2.7.3 as the version number in the response.
6. You should have pip installed by now. In case it is not installed, use easy_install to add pip:
$ easy_install pip
7. Now, it's easy to install any required package; for example, virtualenv and virtualenvwrapper are useful:
pip install virtualenv
pip install virtualenvwrapper
8. The next step is what we really wanted to do all along—install matplotlib:
pip install numpy brew install gfortran pip install scipy
9. Verify that everything is working. Call Python and execute the following commands:
import numpy
print numpy.__version__ import scipy
print scipy.__version__ quit()
10. Install matplotlib:
Installing matplotlib on Windows
In this recipe, we will demonstrate how to install Python and start working with matplotlib installation. We assume Python was not previously installed.
Getting ready
There are two ways of installing matplotlib on Windows. The easiest way is by installing prepackaged Python environments, such as EPD, Anaconda, SageMath, and Python(x,y). This is the suggested way to install Python, especially for beginners.
The second way is to install everything using binaries of precompiled matplotlib and required dependencies. This is more difficult as you have to be careful about the versions of NumPy and SciPy you are installing, as not every version is compatible with the latest version of matplotlib binaries. The advantage in this is that you can even compile your particular versions of matplotlib or any library to have the latest features, even if they are not provided by authors.
How to do it...
The suggested way of installing free or commercial Python scientific distributions is as easy as following the steps provided on the project's website.
If you just want to start using matplotlib and don't want to be bothered with Python versions and dependencies, you may want to consider using the Enthought Python Distribution (EPD). EPD contains prepackaged libraries required to work with matplotlib and all the required dependencies (SciPy, NumPy, IPython, and more).
As usual, we download Windows installer (*.exe) that will install all the code we need to start using matplotlib and all recipes from this book.
Let me shortly explain how we would install matplotlib using precompiled Python, NumPy, SciPy, and matplotlib binaries:
1. First, we download and install standard Python using the official .msi installer for our platform (x86 or x86-64).
2. After that, download official binaries for NumPy and SciPy and install them first. 3. When you are sure that NumPy and SciPy are properly installed. Then, we download
the latest stable release binary for matplotlib and install it by following the official instructions.
There's more...
Note that many examples are not included in the Windows installer. If you want to try the demos, download the matplotlib source and look in the examples subdirectory.
Installing Python Imaging Library (PIL) for
image processing
Python Imaging Library (PIL) enables image processing using Python. It has an extensive file format support and is powerful enough for image processing.
Some popular features of PIL are fast access to data, point operations, filtering, image resizing, rotation, and arbitrary affine transforms. For example, the histogram method allows us to get statistics about the images.
PIL can also be used for other purposes, such as batch processing, image archiving, creating thumbnails, conversion between image formats, and printing images.
PIL reads a large number of formats, while write support is (intentionally) restricted to the most commonly used interchange and presentation formats.
How to do it...
The easiest and most recommended way is to use your platform's package managers. For Debian and Ubuntu use the following commands:
$ sudo apt-get build-dep python-imaging
How it works...
This way we are satisfying all build dependencies using the apt-get system but also installing the latest stable release of PIL. Some older versions of Ubuntu usually don't provide the latest releases.
On RedHat and SciLinux systems, run the following commands:
# yum install python-imaging
# yum install freetype-devel
# pip install PIL
There's more...
There is a good online handbook, specifically, for PIL. You can read it at http://www. pythonware.com/library/pil/handbook/index.htm or download the PDF version from http://www.pythonware.com/media/data/pil-handbook.pdf.
There is also a PIL fork, Pillow, whose main aim is to fix installation issues. Pillow can be found at http://pypi.python.org/pypi/Pillow and it is easy to install (at the time of writing, Pillow is the only choice if you are using OS X).
On Windows, PIL can also be installed using a binary installation file. Install PIL in your Python site-packages by executing .exe from http://www.pythonware.com/products/pil/.
Now, if you want PIL used in a virtual environment, manually copy the PIL.pth file and the PIL directory at C:\Python27\Lib\site-packages to your virtualenv site-packages directory.
Installing a requests module
Most of the data that we need now is available over HTTP or similar protocol, so we need something to get it. Python library requests make the job easy.
Even though Python comes with the urllib2 module for work with remote resources and supporting HTTP capabilities, it requires a lot of work to get the basic tasks done.
How to do it...
Using pip is the best way to install requests. Use the following command for the same:
$ pip install requests
That's it. This can also be done inside your virtualenv, if you don't need requests for every project or want to support different requests versions for each project.
Just to get you ahead quickly, here's a small example on how to use requests:
import requests
r = requests.get('http://github.com/timeline.json')
print r.content
How it works...
We sent the GET HTTP request to a URI at www.github.com that returns a JSON-formatted timeline of activity on GitHub (you can see HTML version of that timeline at https://github. com/timeline). After the response is successfully read, the r object contains content and other properties of the response (response code, cookies set, header metadata, and even the request we sent in order to get this response).
Customizing matplotlib's parameters in code
The library we will use the most throughout this book is matplotlib; it provides the plotting capabilities. Default values for most properties are already set inside the configuration file for matplotlib, called .rc file. This recipe describes how to modify matplotlib properties from our application code.
Getting ready
As we already said, matplotlib configuration is read from a configuration file. This file provides a place to set up permanent default values for certain matplotlib properties, well, for almost everything in matplotlib.
How to do it...
If we want to restore the dynamically changed parameters, we can use matplotlib.rcdefaults() call to restore the standard matplotlib settings.
The following two code samples illustrate previously explained behaviors:
f An example for matplotlib.rcParams: import matplotlib as mpl
mpl.rcParams['lines.linewidth'] = 2 mpl.rcParams['lines.color'] = 'r'
f An example for the matplotlib.rc() call: import matplotlib as mpl
mpl.rc('lines', linewidth=2, color='r')
Both examples are semantically the same. In the second sample, we define that all subsequent plots will have lines with line width of 2 points. The last statement of the previous code defines that the color of every line following this statement will be red, unless we override it by local settings. See the following example:
import matplotlib.pyplot as plt
import numpy as np
t = np.arange(0.0, 1.0, 0.01)
s = np.sin(2 * np.pi * t)
# make line red
plt.rcParams['lines.color'] = 'r'
plt.plot(t,s)
c = np.cos(2 * np.pi * t)
# make line thick
plt.rcParams['lines.linewidth'] = '3'
plt.plot(t,c)
How it works…
First, we import matplotlib.pyplot and NumPy to allow us to draw sine and cosine graphs. Before plotting the first graph, we explicitly set the line color to red using the plt.rcParams['lines.color'] = 'r' command.
Next, we go to the second graph (cosine function) and explicitly set the line width to three points using the plt.rcParams['lines.linewidth'] = '3' command.
If we want to reset specific settings, we should call matplotlib.rcdefaults().
In this recipe, we have seen how to customize the style of a matplotlib chart dynamically changing its configuration parameters. The matplotlib.rcParams object is the interface that we used to modify the parameters. It's global to the matplotlib packages and any change that we apply to it affects all the charts that we draw after.
Customizing matplotlib's parameters per
project
This recipe explains where the various configuration files are that matplotlib uses and why we want to use one or the other. Also, we explain what is in these configuration files.
Getting ready
If you don't want to configure matplotlib as the first step in your code every time you use it (as we did in the previous recipe), this recipe will explain how to have different default configurations of matplotlib for different projects. This way your code will not be cluttered with configuration data and, moreover, you can easily share configuration templates with your co-workers or even among other projects.
How to do it...
If you have a working project that always uses the same settings for certain parameters in matplotlib, you probably don't want to set them every time you want to add a new graph code. Instead, what you want is a permanent file, outside of your code, which sets defaults for matplotlib parameters.
How it works...
There are three different places where this file can reside and its location defines its usage. They are:
f Current working directory: This is where your code runs from. This is the place to customize matplotlib just for your current directory that might contain your current project code. The file is named matplotlibrc.
f Per user .matplotlib/matplotlibrc: This is usually in the user's $HOME directory (under Windows, this is your Documents and Settings directory). You can find out where your configuration directory is using the matplotlib.get_configdir() command. Check the next command.
f Per installation configuration file: This is usually in your Python site-packages. This is a system-wide configuration, but it will get overwritten every time you reinstall matplotlib; so, it is better to use a per user configuration file for more persistent customizations. The best usage so far for me was to use this as a default template, if I mess up my user's configuration file or if I need fresh configuration to customize for a different project.
The following one liner will print the location of your configuration directory and can be run from shell:
$ python -c 'import matplotlib as mpl; print mpl.get_configdir()'
The configuration file contains settings for:
f axes: This deals with face and edge color, tick sizes, and grid display.
f backend: This sets the target output: TkAgg and GTKAgg.
f figure: This deals with dpi, edge color, figure size, and subplot settings.
f font: This looks at font families, font size, and style settings.
f grid: This deals with grid color and line settings.
f legend: This specifies how legends and text inside will be displayed.
f lines: This checks for line (color, style, width, and so on) and markers settings.
f patch: These patches are graphical objects that fill 2D space, such as polygons and circles; set linewidth, color, antialiasing, and so on.
f savefig: There are separate settings for saved figures. For example, to make rendered files with a white background.
f verbose: This checks how much information matplotlib gives during runtime: silent, helpful, debug, and debug annoying.
f xticks and yticks: These set the color, size, direction, and label size for major and minor ticks for the x and y axes.
There's more...
2
Knowing Your Data
In this chapter, we'll cover the following topics:
f Importing data from CSV
f Importing data from Microsoft Excel files f Importing data from fixed-width data files f Importing data from tab-delimited files f Importing data from a JSON resource
f Exporting data to JSON, CSV, and Excel
f Importing and manipulating data with Pandas
f Importing data from a database
f Cleaning up data from outliers
f Reading files in chunks
f Reading streaming data sources
f Importing image data into NumPy arrays
f Generating controlled random datasets
f Smoothing the noise in real-world data
Introduction
Importing data from CSV
In this recipe, we'll work with the most common file format that you will encounter in the wild world of data—CSV. It stands for Comma Separated Values, which almost explains all the formatting there is. (There is also a header part of the file, but those values are also comma separated.)
Python has a module called csv that supports reading and writing CSV files in various dialects. Dialects are important because there is no standard CSV, and different applications implement CSV in slightly different ways. A file's dialect is almost always recognizable by the first look into the file.
Getting ready
What we need for this recipe is the CSV file itself. We'll use sample CSV data that you can download from ch02-data.csv.
We assume that sample data files are in the same folder as the code reading them.
How to do it...
The following code example demonstrates how to import data from a CSV file. We will perform the following steps for this:
1. Open the ch02-data.csv file for reading. 2. Read the header first.
3. Read the rest of the rows.
4. In case there is an error, raise an exception.
5. After reading everything, print the header and the rest of the rows.
This is shown in the following code:
import csv
filename = 'ch02-data.csv'
data = [] try:
with open(filename) as f: reader = csv.reader(f) header = reader.next()
except csv.Error as e:
print "Error reading CSV file at line %s: %s" % (reader.line_num, e)
First, we import the csv module in order to enable access to the required methods. Then, we open the file with data using the with compound statement and bind it to the object f. The context manager with statement releases us of care about the closing resource after we are finished manipulating those resources. It is a very handy way of working with resource-like files because it makes sure that the resource is freed (for example, that the file is closed) after the block of code is executed over it.
Then, we use the csv.reader() method that returns the reader object, which allows us to iterate over all rows of the read file. Every row is just a list of values and is printed inside the loop.
Reading the first row is somewhat different as it is the header of the file and describes the data in each column. This is not mandatory for CSV files and some files don't have headers, but they are a really nice way of providing minimal metadata about datasets. Sometimes though, you will find separate text or even CSV files that are just used as metadata describing the format and additional data about the data.
The only way to check what the first line looks like is to open the file and visually inspect it (for example, see the first few lines of the file)... This can be done efficiently on Linux using bash commands like head as shown here:
$ head some_file.csv
During iteration of data, we save the first row in header while we add every other row to the data list.
We can also check if the .csv file has a header or not using the method csv.has_header.
There's more...
If you want to read about the background and reasoning for the csv module, the PEP-defined document CSV File API is available at http://www.python.org/dev/peps/pep-0305/.
If you have larger files that you want to load, it's often better to use well-known libraries like NumPy's loadtxt() that cope better with large CSV files.
The basic usage is simple as shown in the following code snippet:
import numpy
data = numpy.loadtxt('ch02-data.csv', dtype='string', delimiter=',')
Note that we need to define a delimiter to instruct NumPy to separate our data as appropriate. The function numpy.loadtxt() is somewhat faster than the similar function numpy. genfromtxt(), but the latter can cope better with missing data, and you are able to provide functions to express what is to be done during the processing of certain columns of loaded data files.
Currently, the csv module doesn't support Unicode, and so you
must explicitly convert the read data into UTF-8 or ASCII printable.
The official Python CSV documentation offers good examples on
how to resolve data encoding issues.
In Python 3.3 and later versions, Unicode support is default and there are no such issues.
Importing data from Microsoft Excel files
Although Microsoft Excel supports some charting, sometimes you need more flexible and powerful visualization and need to export data from existing spreadsheets into Python for further use.A common approach to importing data from Excel files is to export data from Excel into CSV-formatted files and use the tools described in the previous recipe to import data using Python from the CSV file. This is a fairly easy process if we have one or two files (and have Microsoft Excel or OpenOffice.org installed), but if we are automating a data pipe for many files (as part of an ongoing data processing effort), we are not in a position to manually convert every Excel file into CSV. So, we need a way to read any Excel file.
The Microsoft Excel file format changed over time, and support for different versions is available in different Python libraries. The latest stable version of XLRD is 0.90 at the time of this writing and it has support for reading .xlsx files.
Getting ready
First, we need to install the required module. For this example, we will use the module xlrd. We will use pip in our virtual environment, as shown in the following code:
$ mkvirtualenv xlrdexample
(xlrdexample)$ pip install xlrd
After successful installation, use the sample file ch02-xlsxdata.xlsx.
How to do it...
The following code example demonstrates how to read a sample dataset from a known Excel file. We will do this as shown in the following steps:
1. Open the file workbook. 2. Find the sheet by name.
3. Read the cells using the number of rows (nrows) and columns (ncols).
4. For demonstration purposes, we only print the read dataset.
This is shown in the following code:
import xlrd
file = 'ch02-xlsxdata.xlsx'
wb = xlrd.open_workbook(filename=file)
ws = wb.sheet_by_name('Sheet1')
dataset = []
for r in xrange(ws.nrows): col = []
for c in range(ws.ncols):
col.append(ws.cell(r, c).value) dataset.append(col)
How it works...
Let's try to explain the simple object model that xlrd uses. At the top level, we have a workbook (the Python class xlrd.book.Book) that consists of one or more worksheets (xlrd.sheet.Sheet), and every sheet has a cell (xlrd.sheet.Cell) from which we can then read the value.
We load a workbook from a file using open_workbook(), which returns the xlrd.book. Book instance that contains all the information about a workbook like sheets. We access sheets using sheet_by_name(); if we need all sheets, we could use sheets(), which returns a list of the xlrd.sheet.Sheet instances. The xlrd.sheet.Sheet class has a number of columns and rows as attributes that we can use to infer ranges for our loop to access every particular cell inside a worksheet using the method cell(). There is an xrld.sheet.Cell class, though it is not something we want to use directly.
Note that the date is stored as a floating point number and not as a separate data type, but the xlrd module is able to inspect the value and try to infer if the data is in fact a date. So, we can inspect the cell type for the cell to get the Python date object. The module xlrd will return xlrd.XL_CELL_DATE as the cell type if the number format string looks like a date. Here is a snippet of code that demonstrates this:
from datetime import datetime
from xlrd import open_workbook, xldate_as_tuple …
date_value = xldate_as_tuple(cell.value, book.datemode) print datetime(*date_value)
This field still has issues, so please refer to the official documentation and mailing list in case you require extensive work with dates.
There's more...
A neat feature of xlrd is its ability to load only parts of the file that are required in the memory. There is an on_demand parameter that can be passed as True value while calling open_workbook so that the worksheet will only be loaded when requested. See the following example of code snippet for this:
We didn't mention writing Excel files in this section partly because there will be a separate recipe for that and partly because there is a different module for that—xlwt. You will read more about it in the Exporting data to JSON, CSV, and Excel recipe in this chapter.
If you need specific usage that was not covered with the module and examples explained earlier, here is a list of other Python modules on PyPi that might help you out with spreadsheets http://pypi.python.org/pypi?:action=browse&c=377.
Importing data from fixed-width data files
Log files from events and time series data files are common sources for data visualizations. Sometimes, we can read them using CSV dialect for tab-separated data, but sometimes they are not separated by any specific character. Instead, fields are of fixed widths and we can infer the format to match and extract data.
One way to approach this is to read a file line by line and then use string manipulation functions to split a string into separate parts. This approach seems straightforward, and if performance is not an issue, it should be tried first.
If performance is more important or the file to parse is large (hundreds of megabytes), using the Python module struct (http://docs.python.org/library/struct.html) can speed us up as the module is implemented in C rather than in Python.
Getting ready
As the module struct is part of the Python Standard Library, we don't need to install any additional software to implement this recipe.
How to do it...
We will use a pregenerated dataset with a million rows of fixed-width records. Here's what sample data looks like:
Now we can read the data. We can use the following code sample. We will carry out the following steps for this:
1. Define the data file to read.
2. Define the mask for how to read the data.
3. Read line by line using the mask to unpack each line into separate data fields. 4. Print each line as separate fields.
This is shown in the following code snippet:
import struct import string
datafile = 'ch02-fixed-width-1M.data'
# this is where we define how to
# understand line of data from the file mask='9s14s5s'
with open(datafile, 'r') as f: for line in f:
fields = struct.Struct(mask).unpack_from(line)
print 'fields: ', [field.strip() for field in fields]
How it works...
We define our format mask according to what we have previously seen in the datafile. To see the file, we could have used Linux shell commands such as head or more or something similar.
String formats are used to define the expected layout of the data to extract. We use format characters to define what type of data we expect. So if the mask is defined as 9s15s5s, we can read that as "a string of nine character width, followed by a string width of 15 characters and then again followed by a string of five characters."
In general, c defines the character (the char type in C) or a string of length 1, s defines a string (the char[] type in C), d defines a float (the double type in C), and so on. The complete table is available on the official Python website at http://docs.python.org/ library/struct.html#format-characters.
For unpacking, we used the object-oriented (OO) approach using the struct.Struct class, but we could have as well used the non-object approach where the line would be as shown here:
fields = struct.unpack_from(mask, line)
The only difference is the usage of pattern. If we are to perform more processing using the same formatting mask, the OO approach saves us from stating that format in every call. Moreover, it gives us the ability to inherit the struct.Struct class in future, thus extending or providing additional functionality for specific needs.
Importing data from tab-delimited files
Another very common format of flat datafile is the tab-delimited file. This can also come from an Excel export but can be the output of some custom software we must get our input from.
The good thing is that usually this format can be read in almost the same way as CSV files as the Python module csv supports the so-called dialects that enable us to use the same principles to read variations of similar file formats, one of them being the tab- delimited format.
Getting ready
Now you're already able to read CSV files. If not, please refer to the Importing data from CSV recipe first.
How to do it...
We will reuse the code from the Importing data from CSV recipe, where all we need to change is the dialect we are using as shown in the following code:
import csv
filename = 'ch02-data.tab'
data = [] try:
with open(filename) as f:
reader = csv.reader(f, dialect=csv.excel_tab) header = reader.next()
data = [row for row in reader] except csv.Error as e:
print "Error reading CSV file at line %s: %s" % (reader.line_num, e)
if header: print header
print '==================='
for datarow in data: print datarow
How it works...
The dialect-based approach is very similar to what we already did in the Importing data from CSV recipe, except for the line where we instantiate the csv reader object, giving it the parameter dialect and specifying the excel_tab dialect that we want.
There's more...
A CSV-based approach will not work if the data is "dirty", that is, if there are certain lines not ending with just a new line character but have additional \t (Tab) markers. So we need to clean special lines separately before splitting them. The sample "dirty" tab-delimited file can be found in ch02-data-dirty.tab. The following code sample cleans data as it reads it:
datafile = 'ch02-data-dirty.tab'
with open(datafile, 'r') as f: for line in f:
# remove next comment to see line before cleanup # print 'DIRTY: ', line.split('\t')
# we remove any space in line start or end line = line.strip()
# now we split the line by tab delimiter print line.split('\t')
We also see that there is another approach to do this—using the split('\t') function.
Importing data from a JSON resource
This recipe will show us how we can read the JSON data format. Moreover, we'll be using a remote resource in this recipe. It will add a tiny level of complexity to the recipe, but it will also make it much more useful because in real life we will encounter more remote resources than local ones.
JavaScript Object Notation (JSON) is widely used as a platform-independent format to exchange data between systems or applications.
A resource, in this context, is anything we can read, be it a file or a URL endpoint (which can be the output of a remote process/program or just a remote static file). In short, we don't care who produced a resource and how they did it; we just need it to be in a known format like JSON.
Getting ready
In order to get started with this recipe, we need the requests module installed and importable (in PYTHONPATH) in our virtual environment. We have installed this module in Chapter 1, Preparing Your Working Environment.
We also need Internet connectivity as we'll be reading a remote resource.
How to do it...
The following code sample performs reading and parsing of the recent activities' timeline from the GitHub (http://github.com) site. We will perform the following steps for this:
1. Define the GitHub URL of a JSON file with the details of a GitHub profile. 2. Get the contents from the URL using the requests module.
3. Read the content as JSON.
Here is the code for this:
import requests
from pprint import pprint
url = 'https://api.github.com/users/justglowing' r = requests.get(url)
How it works...
First, we use the "requests" module to fetch a remote resource. This is very straightforward as the "requests" module offers a simple API to define HTTP verbs, so we just need to issue one get() method call. This method retrieves data and request metadata and wraps it in the "Response" object, so we can inspect it. For this recipe, we are only interested in the Response.json() method, which automatically reads content (available at Response. content) and parses it as JSON and loads it into the JSON object.
Now that we have the JSON object, we can process the data. In order to do that, we need to understand what data looks like. We can achieve that understanding by opening the JSON resource using our favorite web browser or command-line tool such as wget or curl.
Another way is to fetch data from IPython and inspect it interactively. We can achieve that by running our program from IPython (using %run program_name.py). After execution, we are left with all variables that the program produced. List them all using %who or %whos.
Whatever method we use, we gain knowledge about the structure of the JSON data and the ability to see what parts of that structure we are interested in.
The JSON object is basically just a Python dictionary (or if stated in a more complex manner, a dictionary of dictionaries) and we can access parts of it using a well-known, key-based notation. In our example, the .json file contains the details of a GitHub profile and we can access the location of the user referencing json_obj['location']. If we compare the structure of the dictionary json_obj with that of the .json file, we see that each entry in the .json file corresponds to a key in the dictionary. This means that the entire content of the .json file is now into the dictionary (keep in mind that when you load a .json file, the order of the keys is not preserved!).
There's more...
The JSON format (specified by RFC 4627; refer to http://tools.ietf.org/html/ rfc4627.html) became very popular recently as it is more human readable than XML and is also less verbose. Hence, it's lighter in terms of the syntaxes required to transfer data. It is very popular in the web application domain as it is native to JavaScript, the language used for most of today's rich Internet applications.
The Python JSON module has more capabilities than we have displayed here; for example, we could specialize the basic JSONEncoder/JSONDecoder class to transform our Python data into JSON format. The classical example uses this approach to JSON-ify the Python built-in type for complex numbers.
For example, json.loads() will parse a float as the Python type float, and most of the time it will be right. Sometimes, however, the float value in the .json file represents a price value, and this is better represented as a decimal. We can instruct the json parser to parse floats as decimal. For example, we have the following JSON string:
jstring = '{"name":"prod1","price":12.50}'
This is followed by these two lines of code:
from decimal import Decimal
json.loads(jstring, parse_float=Decimal)
The preceding two lines of code will generate this output:
{u'name': u'prod1', u'price': Decimal('12.50')}
Exporting data to JSON, CSV, and Excel
While as producers of data visualization, we are mostly using other people's data, importing and reading data are our major activities. We do need to write or export data that we produced or processed, whether it is for our or others' current or future use.
We will demonstrate how to use the previously mentioned Python modules to import, export, and write data to various formats such as JSON, CSV, and XLSX.
For demonstration purposes, we are using the pregenerated dataset from the Importing data from fixed-width data files recipe.
Getting ready
For the Excel writing part, we will need to install the xlwt module (inside our virtual environment) by executing the following command:
$ pip install xlwt
How to do it...
We will present one code sample that contains all the formats that we want to demonstrate: CSV, JSON, and XLSX. The main part of the program accepts the input and calls appropriate functions to transform data. We will walk through separate sections of code explaining its purpose, as shown here:
1. Import the required modules:
import argparse
try:
import cStringIO as StringIO except:
import StringIO import struct import json import csv
2. Then, define the appropriate functions for reading and writing data: def import_data(import_file):
'''
Imports data from import_file. Expects to find fixed width row
Sample row: 161322597 0386544351896 0042 '''
'''Dispatches call to a specific transformer and returns data set.
3. We separately specify separate implementation for each data format (CSV, JSON, and XLSX):
def write_csv(data):
'''Transforms data into csv. Returns csv as string. '''
'''Transforms data into json. Very straightforward. '''
4. Finally, we have the main code entry point, where we parse argument-like files from the command line to import data and export it to the required format:
if __name__ == '__main__': # parse input arguments
parser = argparse.ArgumentParser()
parser.add_argument("import_file", help="Path to a fixed-width data file.")
parser.add_argument("export_format", help="Export format: json, csv, xlsx.")
if args.export_format not in ('csv','json','xlsx'):
print >> sys.stderr, "You must provide valid export file format."
sys.exit(1)
# verify given path is accessible file if not os.path.isfile(args.import_file):
print >> sys.stderr, "Given path is not a file: %s" % args.import_file
sys.exit(1)
# read from formatted fixed-width file data = import_data(args.import_file)
# export data to specified format # to make this Unix-like pipe-able # we just print to stdout
print write_data(data, args.export_format)
How it works...
In one broad sentence, we import the fixed-width dataset (as defined in the Importing data from fixed-width datafiles recipe) and then export that to stdout, so we can catch that in a file or as an input to another program.
If we successfully parse those arguments, we dispatch the input file reading to a function import_data(), which returns the Python data structure (list of lists) that we can easily manipulate to get to the appropriate export format.
We route our request inside the write_data() function, where we just forward a call to the appropriate function (for example, write_csv()).
For CSV, we obtain the csv.writer() instance that we use to write every line of data we iterate over.
We just return the given string as we will redirect this output from our program to another program (or just to copy in a file).
The JSON export is not required for this example as the json module provides us with the dump() method that happily reads our Python structure. Just as for CSV, we simply return and dump this output to stdout.
The Excel export requires more code as we need to create a more complex model of the Excel workbook and worksheet(s) that will hold the data. This activity is followed by a similar iterative approach. We have two loops— the outer one goes over every line in the source dataset iterated and the inner one iterates over every field in the given line.
After all this, we save the Book instance into a file-like stream that we can return to stdout and use it both in read files and the files consumed by the web service.
There's more...
This, of course, is just a small set of possible data formats that we could be exporting to. It is fairly easy to modify the behavior. Basically, two places need changes: the import and export functions. The function for import needs to change if we want to import a new kind of data source.
If we want to add a new export format, we need to first add functions that will return a stream of formatted data. Then, we need to update the write_data() function to add the new elif branch to have it call our new write_* function.
Importing and manipulating data with
Pandas
Until now we have seen how to import and export data using mostly the tools provided in the Python standard library. Now, we'll see how to do some of the operations shown above in just few lines using the Pandas library. Pandas is an open source, BSD-licensed library that simplifies the process of data import and manipulation thus providing data structures and parsing functions.
We will demonstrate how to import, manipulate and export data using Pandas.
Getting ready
To be able to use the code in this section, we need to install Pandas.This can be done again using pip as shown here:
pip install pandas
How to do it...
Here, we will import again the data ch2-data.csv, add a new column to the original data and export the result in csv, as shown in the following code snippet:
data = pd.read_csv('ch02-data.csv') data['amount_x_2'] = data['amount']*2 data.to_csv('ch02-data_more.csv)
How it works...
There's more...
DataFrames are very handy structures; they're designed to be fast and easy to access. Each column that they contain becomes an attribute of the object that represents the data frame. For example, we can print the values in the column amount of the object data defined earlier as shown here:
>>>print data.amount
>>>0 323 1 233 2 433 3 555 4 123 5 0 6 221 Name: amount, dtype: int64
We can also print the list of all the columns in a dataframe as shown in the following code:
>>>print data.columns
>>>Index([u'day', u'amount'], dtype='object')
Also, the function read_csv that we used to import the data has many parameters that we make use of to deal with messy files and parse particular data formats. For example, if the values of our files are delimited by spaces instead of commas, we can use the parameter delimiter to correctly parse the data. Here's an example of where we import data from a file, where the values are separated by a variable number of spaces and we specify our custom header:
pd.read_csv('ch02-data.tab', skiprows=1, delimiter=' *', names=['day','amount'])
Importing data from a database
Very often, our work on data analysis and visualization is at the consumer end of the data pipeline. We most often use the already produced data rather than producing the data ourselves. A modern application, for example, holds different datasets inside relational databases (or other databases like MongoDB), and we use these databases to produce beautiful graphs.
This recipe will show you how to use SQL drivers from Python to access data.