CHAPTER IV RESULT OF THE STUDY
This chapter discussed the result of the studywhich consist of the data finding and discussion.
A. Description of the Data
This section described the obtained data of the difference in the english vocabulary mastery by Eleventh Graders of Social Science Class and Natural Science Class at SMAN-1 Kapuas Hilir. The presented data consistof Mean, Median, Modus, reliability value, and Standard Deviation.
1. The Mastery of Students on English Vocabulary Between Social Science Class and Natural Science Class of Eleveth Graders of SMAN 1 Kapuas Hilir
a. The Description of the Data of Students in Social ScienceClass The data presentation of the score of the students Social Scienceshows in the table frequency distribution, the chart of frequency distribution, the measurement of central tendency (mean, median, and mode) and the measurement of deviation standard.
Table. 4.1 Description Data of Social Science Class No Name Value Range
1 D 70 B
2 JS 74 B
3 S 58 D
5 MR 70 B
6 A 68 C
7 JR 66 C
No Name Value Range
8 RM 70 B
9 AR 66 C
10 NA 82 A
11 TBY 82 A
12 TKS 72 B
13 M 74 B
14 AR 68 C
15 YH 70 B
16 S 74 B
17 Z 78 B
18 YK 78 B
19 AP 82 A
20 CSD 72 B
21 YFA 62 C
22 WK 68 C
23 J 88 A
24 S 86 A
25 AP 76 B
26 MR 76 B
27 M 54 D
28 H 74 B
29 MH 82 A
30 EO 66 C
31 LD 74 B
32 A 82 A
33 T 84 A
34 DM 80 A
35 WE 72 B
36 M 76 B
37 IS 70 B
38 R 68 C
39 S 58 D
40 DA 84 A
Total 2912
Based on the data above, it can be seen that the students’ highest score was 88 and the student’s lowest score was 54. To determine the range of score, the class interval, and interval of temporary, the writer calculated using formula as follows:
The Highest Score (H) = 88 The Lowest Score (L) = 54
The Range of Score (R) = H – L + 1 = 88 – 54 + 1 = 35
The Class Interval (K) = 1 + (3.3) x Log n = 1 + (3.3) x Log 40 = 1 + 4,293399 = 5,293399 = 5
Interval of Temporary (I)=𝑅
𝐾 = 35
5
= 7
Thus, the range of score was 35, the class interval was 5, and interval of temporary was 7. It was presented using frequency distribution in the following table:
Table 4.2 Frequency Distribution of Social Science Class Test Score Class
(K)
Interval (I)
Frequency (F)
Mid Point
Limitation of Each
Frequency Relative
(X) Group (%) (%)
1 82– 88 9 85 81,5 – 88,5 45 45
2 75– 81 6 78 74,5 – 81,5 30 75
3 68– 74 17 71 67,5 – 74,5 85 160
4 61– 67 4 64 60,5 – 67,5 20 180
5 54– 60 4 57 53,5 – 60,5 20 200
Total ∑F = 40 ∑P = 200
The distribution of the score of students Social Science can also be seen in the following Chart.
Figure 4.3The Frequency Distribution of the Score of Students in Social Science Class
According to the chart, the writer found that there are five kinds of frequency in distribution score of students in social science class, there are 53,5 – 60,5. 60,5 – 67,5.67,5 – 74,5. 74,5 – 81,5. 81,5 – 88,5. There are 9 students who get the score 81,5 – 88,5, there are 6 students who get the
9
6
17
4 4
0 2 4 6 8 10 12 14 16 18
81,5 - 88,5 74,5 - 81,5 67,5 - 74,5 60,5 - 67,5 53,5 - 60,5
F
re
q
u
en
cy
Limitation of Each Group
score in 74,5 – 81,5, there are 17 students who get the score in 67,5 – 74,5, there are 4 students who get score in 60,5 – 67,5, and there are 4 students who get the score in 53,5 – 60,5. It means that the frequency distribution of the score of students in social class mostly occurred in 67,5 – 74,5.
The next step, the writer tabulated the scores into the table for the calculation of mean, median and modus as follows :
Table 4.4 The Calculation of Mean, Median and Modus of Students in Social Science Class Test Score
Interval (I)
Frequency (F)
Mid Point
(x)
Fx X’ FX’ Fka Fkb
82– 88 9 85 765 2 18 9 40
75– 81 6 78 468 1 6 15 31
68– 74 17 71 1207 0 0 32 25
61– 67 4 64 256 -1 -4 36 8
54– 60 4 57 228 -2 -8 40 4
N=40 ∑Fx=2914 ∑FX’= 12
1) Mean
Mx = ∑fx
𝑁
= 2914
40
= 72,85 2) Median
Mdn = ℓ + 1 2𝑁−𝑓𝑘𝑏
𝑓𝑖 𝑋𝑖
= 67,5 + 20−8
17 𝑋 7
= 67,5 + 12
= 67,5+ 4,941 = 72,441 3) Modus
Mo = u – 𝑓𝑏
𝑓𝑎+𝑓𝑏 𝑥𝑖
= 74,5 – 4
6+4 𝑥7
= 74,5 – 28
10
= 74,5 – 2,8 = 71,7
4) Reliability
rxx = 𝐾𝑠𝑥
2−𝑋 (𝐾−𝑋 )
𝑠𝑥2(𝐾−1))
= 50 −68,9652 −73,1(50−73,1)
68,9652(50−1)
= 237808 ,56125 +1,688,61
233052 ,390025
= 1,020
The calculation above shows thatthe mean value was 73,1, median value was 72,441, modus value was 71,7, and reliabilty value was 1,020. So, the test is reliable because rtest = 1,020 and rtable is 0,312. So rtest 1,020 > rtable 0,312 and the test is reliable.
Then, the writer tabulated the scores of student’s Social Science Class into the table for the calculation of standard deviation as follows:
Interval (I)
Frequency (F)
Mid Point
(X)
X’ Fx’ X’2 Fx’2
82– 88 9 85 2 18 4 36
75– 81 6 78 1 6 1 6
68– 74 17 71 0 0 0 0
61– 67 4 64 -1 -4 1 4
54– 60 4 57 -2 -8 4 16
Total ∑F = 40 ∑Fx’= 12 ∑Fx’2= 62
Standard Deviation SD = 𝑖 ∑𝑓𝑥′2
𝑁 -
∑(𝑓𝑥)2
𝑁
= 7 62
40– (12)2
40
= 7 1,55−0,32
= 7 1,55−0,09
= 7 1,371
= 7 x 1,170897092 = 8,196
mean score, the result of the standard deviation is 8,196. It means that the students mean score is dissemination.
b. The Description of the Data of Students in Natural Science Class The data presentation of the score of the students Nature Science is shows the table frequency distribution, the measurement of central tendency (mean, median, and mode) and the measurement of deviation standard.In order to analyze the vocabulary mastery by students Natural Science, it can be first distributed by the following table:
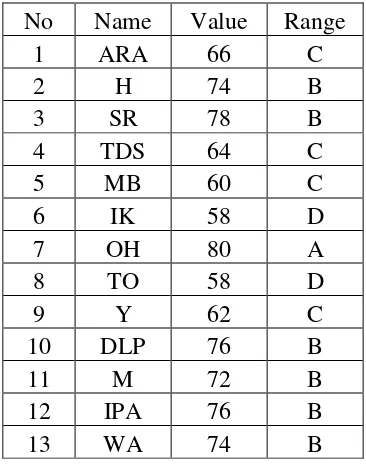
Table 4.6 Description Data of Natural Science Class No Name Value Range
1 ARA 66 C
2 H 74 B
3 SR 78 B
4 TDS 64 C
5 MB 60 C
6 IK 58 D
7 OH 80 A
8 TO 58 D
9 Y 62 C
10 DLP 76 B
11 M 72 B
12 IPA 76 B
14 CA 78 B
15 T 60 C
16 NS 68 C
17 AD 74 B
18 NSK 76 B
19 L 50 D
20 RG 54 D
21 SHN 66 C
22 A 64 C
23 WWA 62 C
24 Y 68 C
25 P 64 C
26 I 56 D
27 NH 80 A
28 S 56 D
29 N 60 C
30 W 84 A
31 MA 80 A
32 GAT 82 A
33 SJ 50 D
34 YA 70 B
35 W 70 B
No Name Value Range
36 KA 66 C
37 JL 70 B
38 MP 72 B
39 AK 70 B
40 SA 82 A
Total 2730
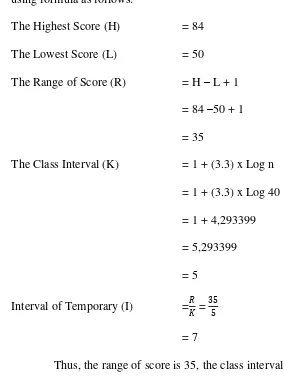
score, the class interval, and interval of temporary, the writer calculated using formula as follows:
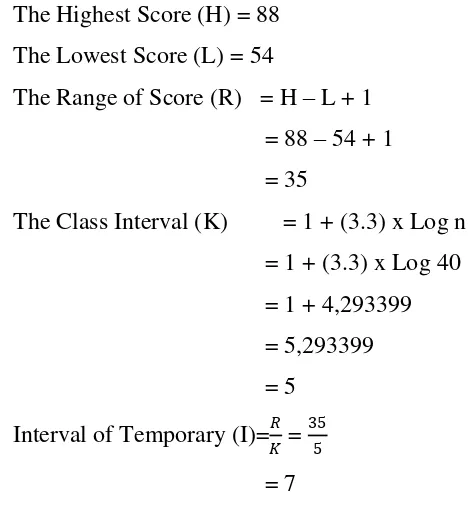
The Highest Score (H) = 84 The Lowest Score (L) = 50
The Range of Score (R) = H – L + 1 = 84 –50 + 1 = 35
The Class Interval (K) = 1 + (3.3) x Log n = 1 + (3.3) x Log 40 = 1 + 4,293399 = 5,293399 = 5
Interval of Temporary (I) =𝑅
𝐾 = 35
5
= 7
Thus, the range of score is 35, the class interval is 5, and interval of temporary is 7. It is presented using frequency distribution in the following table:
Table 4.7 Frequency Distribution of Natural Science Class Test Score
Clas s (K)
Interval (I)
Frequenc y (F)
Mid Point
(X)
Limitation of Each
Group
Frequency Relative
(%)
Frequency Cumulativ
e (%)
2 71-77 8 74 70,5-77,5 40 80
3 64-70 14 67 63,5-70,5 70 150
4 57-63 5 60 56,5-63,5 25 175
5 50-56 5 53 59,5-56,5 25 200
Total ∑F = 40 ∑P = 200
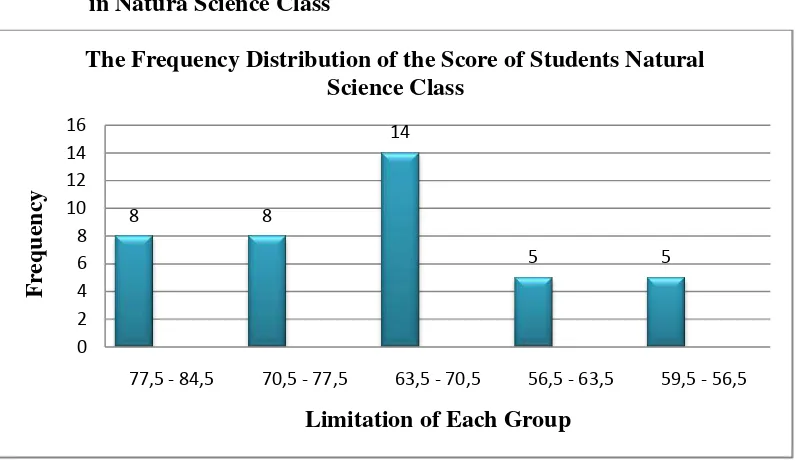
The distribution of the score of students Nature Science can also be seen in the following Chart.
Figure 4.8The Frequency Distribution of the Score of Students in Natura Science Class
According to the chart, the writer found that there are five kinds of frequency in distribution score of students in social science class, there are 77,5-84,5. 70,5-77,5. 63,5-70,5. 56,5-63,5 and 59,5-56,5. There are 8 students who get the score 77,5-84,5, there are 8 students who get the score in 70,5-77,5, there are 14 students who get the score in 63,5-70,5, there are 5 students who get score in 56,5-63,5, and there are 5 students who get the
8 8
14
5 5
0 2 4 6 8 10 12 14 16
77,5 - 84,5 70,5 - 77,5 63,5 - 70,5 56,5 - 63,5 59,5 - 56,5
F
re
q
u
en
cy
Limitation of Each Group
score 59,5-56,5. It means that the frequency distribution of the score of students in nature class mostly occurred in 63,5-70,5.
The next step, the writer tabulated the scores into the table for the calculation of mean, median and modus as follows :
Table 4.9 The Calculation of Mean, Median and Modus of Students in Natural Science Class
Interval (I)
Frequency (F)
Mid Point
(X)
Fx X' Fka Fkb
78-84 8 81 648 2 8 40
71-77 8 74 592 1 16 32
64-70 14 67 938 0 30 24
57-63 5 60 300 -1 35 10
50-56 5 53 265 -2 40 5
Total ∑F = 40 ∑Fx=2731
1) Mean
Mx = ∑fx
𝑁
= 2731
40
= 68,27
2) Median Mdn = ℓ +
1 2𝑁−𝑓𝑘𝑏
𝑓𝑖 𝑋𝑖
= 63,5 + 20−5
14 𝑋 7
3) Modus
Mo = u - 𝑓𝑏
𝑓𝑎+𝑓𝑏 𝑥𝑖
= 63,5 - 5
8+5 𝑥7
= 63,5 - 35
13 𝑥7
= 63,5-18,84615384615385 = 44,654
4) Reliability rxx = 𝐾𝑠𝑥
2−𝑋 (𝐾−𝑋 )
𝑠𝑥2(𝐾−1))
= 50 86,2982−68,575 (50−68,575)
86,2982 (50−1)
= 372367 ,2402 +1273 ,780625
364919 ,895396
= 1,024
The calculation above shows thatthe mean value was 68,5, median value was 71, modus value was 44,65, and reliabilty value was 1,024. So, the test is reliable because rtest = 1,024 and rtable is 0,312. So rtest 1,024 > rtable 0,312 and the test is reliable.
Then, the writer tabulated the scores of student’s Nature Science Class into the table for the calculation of standard deviation as follows:
Table 4.1.1 The Calculation of the Standard Deviation of Students in Natural Science Class
Interval (I)
Frequency (F)
Mid Point
(X)
X' Fx' X'2 Fx'2
78-84 8 81 2 16 4 32
64-70 14 67 0 0 0 0
57-63 5 60 -1 -5 1 5
50-56 5 53 -2 -10 4 20
Total ∑F = 40 ∑Fx’= 9 ∑Fx’2 = 65
Standard Deviation SD = 𝑖 ∑𝑓𝑥′2
𝑁 -
∑(𝑓𝑥)2
𝑁
= 7 65
40- (9)2
40
= 7x 1,625−0,2252 = 7x 1,625−0,050625
= 7 x 1,674375 = 7 x 1,2939764295 = 9,057
The tabulation above shows that the value of standard deviation is 9,057. Standard deviation used to measure the dissemination of the students mean score, the result of the standard deviation is 9,057. It means that the students mean score is dissemination.
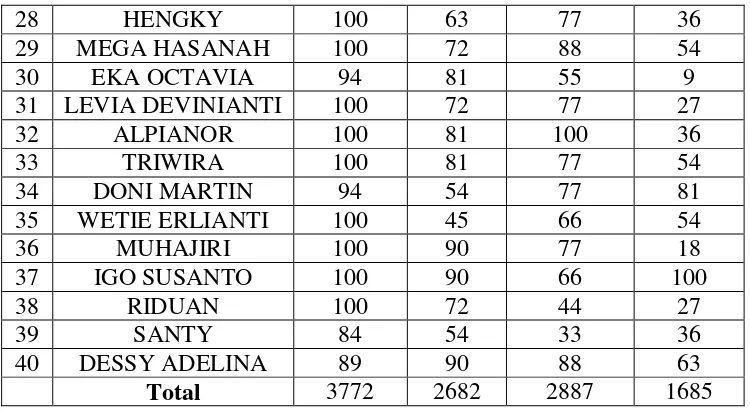
a. Description Data of Social Science Class Based on the Vocabulary Mastery of Proper Noun, Verb, Adjective, Adverb
Table 4.1.2 Description Data of Social Science Class Based on the Vocabulary Mastery of Proper Noun, Verb, Adjective, Adverb
No Name Proper
Noun Verb Adjective Adverb
1 DEPRY 100 63 77 18
2 JEFFRY SANTOS 89 72 88 36
3 SELDY 84 72 33 18
4 INTAN RANTIAN 94 63 11 27
5 MUHAMMAD RIFKI 84 45 66 72
6 ANDIANTO 94 54 55 45
7 JULIADI RAHMADI 100 45 77 18
8 RIDWAN
MAULANA 100 63 77 18
9 ANDRI RAMADAN 89 54 88 18
10 NOR ADIANSYAH 100 63 88 63
11 TAWUN BUDI
YOKOB 94 81 100 45
12 TRY KUN. S 100 81 77 9
13 MARKANI 94 72 100 18
14 ADITYA ARISTO 89 54 77 36
15 YUSRAN HASANI 94 72 66 27
16 SUPIANI 94 54 77 54
17 ZAINAL 94 63 100 45
18 YAN KRISNA 94 54 77 72
19 ANTON PRAYOGO 84 63 100 81
20 CINDY SHINTYA
DITHA 84 63 55 72
21 YOHANES F.A 94 63 55 9
22 WAWAN
KRISTIANTO 94 72 77 9
23 JEFRYANTO 100 72 88 81
24 SURYADI 100 54 77 100
25 AGUNG P 100 63 88 36
26 M. RAFI'I 100 90 66 27
28 HENGKY 100 63 77 36
29 MEGA HASANAH 100 72 88 54
30 EKA OCTAVIA 94 81 55 9
31 LEVIA DEVINIANTI 100 72 77 27
32 ALPIANOR 100 81 100 36
33 TRIWIRA 100 81 77 54
34 DONI MARTIN 94 54 77 81
35 WETIE ERLIANTI 100 45 66 54
36 MUHAJIRI 100 90 77 18
37 IGO SUSANTO 100 90 66 100
38 RIDUAN 100 72 44 27
39 SANTY 84 54 33 36
40 DESSY ADELINA 89 90 88 63
Total 3772 2682 2887 1685
Table 4.1.3Description Data of Social Science Class Based on the Vocabulary Mastery of Proper Noun
No Name Proper Noun
1 DEPRY 100
2 JEFFRY SANTOS 89
3 SELDY 84
4 INTAN RANTIAN 94
5 MUHAMMAD RIFKI 84
6 ANDIANTO 94
7 JULIADI RAHMADI 100
8 RIDWAN MAULANA 100
9 ANDRI RAMADAN 89
10 NOR ADIANSYAH 100
11 TAWUN BUDI
YOKOB 94
12 TRY KUN. S 100
13 MARKANI 94
14 ADITYA ARISTO 89
15 YUSRAN HASANI 94
16 SUPIANI 94
17 ZAINAL 94
19 ANTON PRAYOGO 84 20 CINDY SHINTYA
DITHA 84
21 YOHANES F.A 94
22 WAWAN
KRISTIANTO 94
23 JEFRYANTO 100
24 SURYADI 100
25 AGUNG P 100
26 M. RAFI'I 100
27 MACHDI 68
28 HENGKY 100
29 MEGA HASANAH 100
30 EKA OCTAVIA 94
31 LEVIA DEVINIANTI 100
32 ALPIANOR 100
33 TRIWIRA 100
34 DONI MARTIN 94
35 WETIE ERLIANTI 100
36 MUHAJIRI 100
37 IGO SUSANTO 100
38 RIDUAN 100
39 SANTY 84
40 DESSY ADELINA 89
Total 3772
Based on the data above, it can be seen that the students’ highest
score of proper noun was 100 and the students’ lowest score of proper noun was 68. To determine the range of score, the class interval, and interval of temporary, the calculed using formula as follows:
The Highest Score (H) =100 The Lowest Score (L) = 68
= 100 – 68 + 1 = 33
The Class Interval (K) = 1 + (3,3) x Log n = 1 + (3,3) x Log 40 = 1 + 5,9020599913 = 6,9020599913 = 7
Interval of Temporary (I) = 𝑅
𝐾= 33
7
= 5
Thus, the range of score was 33, the class interval was 7, and interval of temporary was 5. It was presented using frequency distribution in the following table:
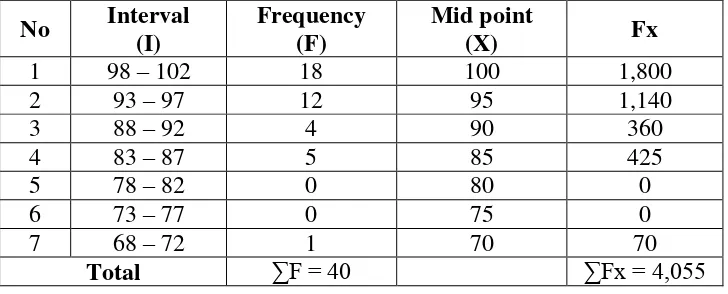
Table 4.1.4The Calculationof Mean of Social Science Class Based on the Vocabulary Mastery of Proper Noun Score
No Interval (I)
Frequency (F)
Mid point
(X) Fx
1 98 – 102 18 100 1,800
2 93 – 97 12 95 1,140
3 88 – 92 4 90 360
4 83 – 87 5 85 425
5 78 – 82 0 80 0
6 73 – 77 0 75 0
7 68 – 72 1 70 70
Total ∑F = 40 ∑Fx = 4,055
Mean
Mx = ∑Fx
= 4,055
40
= 101,375
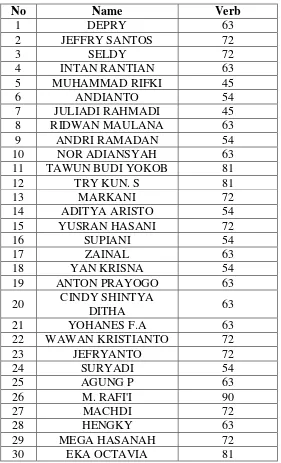
Table 4.1.5Description Data of Social Science Class Based on the Vocabulary Mastery of Verb
No Name Verb
1 DEPRY 63
2 JEFFRY SANTOS 72
3 SELDY 72
4 INTAN RANTIAN 63
5 MUHAMMAD RIFKI 45
6 ANDIANTO 54
7 JULIADI RAHMADI 45
8 RIDWAN MAULANA 63
9 ANDRI RAMADAN 54
10 NOR ADIANSYAH 63
11 TAWUN BUDI YOKOB 81
12 TRY KUN. S 81
13 MARKANI 72
14 ADITYA ARISTO 54
15 YUSRAN HASANI 72
16 SUPIANI 54
17 ZAINAL 63
18 YAN KRISNA 54
19 ANTON PRAYOGO 63
20 CINDY SHINTYA
DITHA 63
21 YOHANES F.A 63
22 WAWAN KRISTIANTO 72
23 JEFRYANTO 72
24 SURYADI 54
25 AGUNG P 63
26 M. RAFI'I 90
27 MACHDI 72
28 HENGKY 63
29 MEGA HASANAH 72
31 LEVIA DEVINIANTI 72
32 ALPIANOR 81
33 TRIWIRA 81
34 DONI MARTIN 54
35 WETIE ERLIANTI 45
36 MUHAJIRI 90
37 IGO SUSANTO 90
38 RIDUAN 72
39 SANTY 54
40 DESSY ADELINA 90
Total 2682
Based on the data above, it can be seen that the students’ highest
score of verb was 90 and the students’ lowest score of verb was 45. To
determine the range of score, the class interval, and interval of temporary, the calculed using formula as follows:
The Highest Score (H) = 90 The Lowest Score (L) = 45
The Range of Score (R) = H – L + 1 = 90 – 45 + 1 = 46
The Class Interval (K) = 1 + (3,3) x Log n = 1 + (3,3) x Log 40 = 1 + 5,9020599913 = 6,9020599913 = 7
Interval of Temporary (I) = 𝑅
𝐾= 46
= 7
Thus, the range of score was 46, the class interval was 7, and interval of temporary was 7. It was presented using frequency distribution in the following table:
Table 4.1.6The Calculation of Mean of Social Science Class Based on the Vocabulary Mastery of Verb Score
No Interval (I)
Frequency (F)
Mid point
(X) Fx
1 87 – 93 4 90 360
2 80 – 86 5 83 415
3 73 – 79 0 76 0
4 66 – 72 10 69 690
5 59 – 65 10 62 620
6 52 – 58 8 55 440
7 45 – 51 3 48 144
Total ∑F = 40 ∑Fx = 2,669
Mean
Mx = ∑Fx
N
= 2,669
40
= 66,725
Table 4.1.7Description Data of Social Science Class Based on the Vocabulary Mastery of Adjective
No Name Adjective
2 JEFFRY SANTOS 88
3 SELDY 33
4 INTAN RANTIAN 11
5 MUHAMMAD RIFKI 66
6 ANDIANTO 55
7 JULIADI RAHMADI 77
8 RIDWAN MAULANA 77
9 ANDRI RAMADAN 88
10 NOR ADIANSYAH 88
11 TAWUN BUDI
YOKOB 100
12 TRY KUN. S 77
13 MARKANI 100
14 ADITYA ARISTO 77
15 YUSRAN HASANI 66
16 SUPIANI 77
17 ZAINAL 100
18 YAN KRISNA 77
19 ANTON PRAYOGO 100
20 CINDY SHINTYA
DITHA 55
21 YOHANES F.A 55
22 WAWAN
KRISTIANTO 77
23 JEFRYANTO 88
24 SURYADI 77
25 AGUNG P 88
26 M. RAFI'I 66
27 MACHDI 22
28 HENGKY 77
29 MEGA HASANAH 88
30 EKA OCTAVIA 55
31 LEVIA DEVINIANTI 77
32 ALPIANOR 100
33 TRIWIRA 77
34 DONI MARTIN 77
35 WETIE ERLIANTI 66
36 MUHAJIRI 77
37 IGO SUSANTO 66
38 RIDUAN 44
40 DESSY ADELINA 88
Total 2887
Based on the data above, it can be seen that the students’ highest
score of adjective was 100 and the students’ lowest score of adjective was 11.
To determine the range of score, the class interval, and interval of temporary, the calculed using formula as follows:
The Highest Score (H) = 100 The Lowest Score (L) = 11
The Range of Score (R) = H – L + 1 = 100 – 11 + 1 = 90
The Class Interval (K) = 1 + (3,3) x Log n = 1 + (3,3) x Log 40 = 1 + 5,9020599913 = 6,9020599913 = 7
Interval of Temporary (I) = 𝑅
𝐾= 90
7
= 13
Table 4.1.8The Calculation of Mean of Social Science Class Based on the Vocabulary Mastery of Adjective Score
No Interval (I)
Frequency (F)
Mid point
(X) Fx
1 89 – 101 5 95 475
2 76 – 88 21 82 1,722
3 63 – 75 5 69 345
4 50 – 62 4 58 232
5 37 – 49 1 43 43
6 24 – 36 2 30 60
7 11 – 23 2 17 34
Total ∑F = 40 ∑Fx = 2,911
Mean
Mx = ∑Fx
N
= 2,911
40
= 72,775
Table 4.1.9Description Data of Social Science Class Based on the Vocabulary Mastery of Adverb
No Name Adverb
1 DEPRY 18
2 JEFFRY SANTOS 36
3 SELDY 18
4 INTAN RANTIAN 27
5 MUHAMMAD RIFKI 72
6 ANDIANTO 45
7 JULIADI RAHMADI 18
8 RIDWAN
MAULANA 18
9 ANDRI RAMADAN 18
11 TAWUN BUDI
YOKOB 45
12 TRY KUN. S 9
13 MARKANI 18
14 ADITYA ARISTO 36
15 YUSRAN HASANI 27
16 SUPIANI 54
17 ZAINAL 45
18 YAN KRISNA 72
19 ANTON PRAYOGO 81
20 CINDY SHINTYA
DITHA 72
21 YOHANES F.A 9
22 WAWAN
KRISTIANTO 9
23 JEFRYANTO 81
24 SURYADI 100
25 AGUNG P 36
26 M. RAFI'I 27
27 MACHDI 36
28 HENGKY 36
29 MEGA HASANAH 54
30 EKA OCTAVIA 9
31 LEVIA DEVINIANTI 27
32 ALPIANOR 36
33 TRIWIRA 54
34 DONI MARTIN 81
35 WETIE ERLIANTI 54
36 MUHAJIRI 18
37 IGO SUSANTO 100
38 RIDUAN 27
39 SANTY 36
40 DESSY ADELINA 63
Total 1685
Based on the data above, it can be seen that the students’ highest
determine the range of score, the class interval, and interval of temporary, the calculed using formula as follows:
The Highest Score (H) = 100 The Lowest Score (L) = 9
The Range of Score (R) = H – L + 1 = 100 – 9 + 1 = 92
The Class Interval (K) = 1 + (3,3) x Log n = 1 + (3,3) x Log 40 = 1 + 5,9020599913 = 6,9020599913 = 7
Interval of Temporary (I) = 𝑅
𝐾= 92
7
= 15
Thus, the range of score was 92, the class interval was 7, and interval of temporary was 15. It was presented using frequency distribution in the following table:
Table 4.2.1The Calculation of Mean of Social Science Class Based on the Vocabulary Mastery of Adverb Score
No Interval (I)
Frequency (F)
Mid point
(X) Fx
1 99 – 203 2 151 302
2 84 – 98 0 91 0
4 54 – 68 6 61 366
5 39 – 53 3 46 138
6 24 – 38 12 31 372
7 9 – 23 11 16 176
Total ∑F = 40 ∑Fx = 1,810
Mean
Mx = ∑Fx
N
= 1,810
40
= 45,25
b. Description Data of Natural Science Class Based on the Vocabulary Mastery of Proper Noun, Verb, Adjective, and Adverb
Table 4.2.2 Description Data of Natural Science Class Based on the Vocabulary Mastery of Proper Noun, Verb, Adjective, and Adverb
No Name Proper
Noun Verb Adjective Adverb 1 ANDRE RESTU
ADITIA 94 81 33 27
2 HANDOKO 94 100 55 27
3 SANDRO RIANTO 100 100 55 36
4 TRI DAUD
SAPUTRA 94 72 33 27
5 MONICA
BERLIANA 84 54 33 45
6 ISTI KOMAH 100 45 11 36
7 OKTAVI HARRY 94 90 44 81
8 TAMA OKTANIA 94 31 11 36
9 YULIANA 78 63 11 81
10 DESY LESTARI P. 100 81 55 45
11 MEGAWATI 94 81 55 36
12 INNES PUSPITA
13 WIDYA ASTUTI 100 81 44 45
14 CAHYA
ARIYANTI 100 90 22 72
15 TINTE 84 72 33 27
16 NOVITA SARI 94 81 44 27
17 ANA DELIMA 100 90 33 45
18 NINA SEPTIN
KRISTINA 100 90 33 54
19 LOLIANA 57 45 33 54
20 REBECKA
GLORIA 89 63 11 18
21 SUSAN HELDA
NATALIA 100 90 11 27
22 APRIANTO 84 90 11 45
23 WIRA WATI
ARISMA 100 72 11 27
24 YUNITA 89 100 11 45
25 PITALOKA 89 81 11 45
26 IDA 89 36 11 54
27 NURUL
HIDAYAH 57 81 100 100
28 SELLIN 73 72 22 36
29 NOVIA 84 63 11 54
30 WINARTI 94 100 88 45
31 MONA AUDIEA 84 63 100 72
32 GRESSELIN A.
TIARA 89 100 88 45
33 SITI JULEHA 68 63 11 36
34 YULIANI
ANGGRAINI 78 63 77 63
35 WINDA 68 81 66 63
36 KASPUL A. 68 100 22 63
37 JUNYALBY
LENGKEY 89 100 22 45
38 MEIDRIE
PRANATA 89 100 22 63
39 APRILIANO. K 94 90 22 36
40 SANTY AMIRA 100 100 55 54
Table 4.2.3 Description Data of Natural Science Class Based on the Vocabulary Mastery of Proper Noun
No Name Proper
Noun 1 ANDRE RESTU
ADITIA 94
2 HANDOKO 94
3 SANDRO RIANTO 100
4 TRI DAUD
SAPUTRA 94
5 MONICA
BERLIANA 84
6 ISTI KOMAH 100
7 OKTAVI HARRY 94
8 TAMA OKTANIA 94
9 YULIANA 78
10 DESY LESTARI P. 100
11 MEGAWATI 94
12 INNES PUSPITA
APRILY 94
13 WIDYA ASTUTI 100
14 CAHYA
ARIYANTI 100
15 TINTE 84
16 NOVITA SARI 94
17 ANA DELIMA 100
18 NINA SEPTIN
KRISTINA 100
19 LOLIANA 57
20 REBECKA
GLORIA 89
21 SUSAN HELDA
NATALIA 100
22 APRIANTO 84
23 WIRA WATI
ARISMA 100
24 YUNITA 89
25 PITALOKA 89
27 NURUL
HIDAYAH 57
28 SELLIN 73
29 NOVIA 84
30 WINARTI 94
31 MONA AUDIEA 84
32 GRESSELIN A.
TIARA 89
33 SITI JULEHA 68
34 YULIANI
ANGGRAINI 78
35 WINDA 68
36 KASPUL A. 68
37 JUNYALBY
LENGKEY 89
38 MEIDRIE
PRANATA 89
39 APRILIANO. K 94
40 SANTY AMIRA 100
Total 3530
Based on the data above, it can be seen that the students’ highest
score of proper noun was 100 and the students’ lowest score of proper noun
was 57. To determine the range of score, the class interval, and interval of temporary, the calculed using formula as follows:
The Highest Score (H) =100 The Lowest Score (L) = 57
The Range of Score (R) = H – L + 1 = 100 – 57 + 1 = 44
= 1 + (3,3) x Log 40 = 1 + 5,9020599913 = 6,9020599913 = 7
Interval of Temporary (I) = 𝑅
𝐾= 44
7
= 7
Thus, the range of score was 44, the class interval was 7, and interval of temporary was 7. It was presented using frequency distribution in the following table:
Table 4.2.4The Calculation of Mean of Natural Science Class Based on the Vocabulary Mastery of Proper Noun Score
No Interval (I)
Frequency (F)
Mid point
(X) Fx
1 99 - 105 10 102 1,020
2 92 – 98 10 95 950
3 85 – 91 7 88 616
4 78 – 84 7 81 567
5 71 – 77 1 74 74
6 64 – 70 3 67 201
7 57 – 63 2 60 120
Total ∑F = 40 ∑Fx = 3,548
Mean
Mx = ∑Fx
N
= 3,548
40
Table 4.2.5Description Data of Natural Science Class Based on the Vocabulary Mastery of Verb
No Name Verb
1 ANDRE RESTU
ADITIA 81
2 HANDOKO 100
3 SANDRO RIANTO 100
4 TRI DAUD
SAPUTRA 72
5 MONICA
BERLIANA 54
6 ISTI KOMAH 45
7 OKTAVI HARRY 90 8 TAMA OKTANIA 31
9 YULIANA 63
10 DESY LESTARI P. 81
11 MEGAWATI 81
12 INNES PUSPITA
APRILY 90
13 WIDYA ASTUTI 81
14 CAHYA
ARIYANTI 90
15 TINTE 72
16 NOVITA SARI 81
17 ANA DELIMA 90
18 NINA SEPTIN
KRISTINA 90
19 LOLIANA 45
20 REBECKA
GLORIA 63
21 SUSAN HELDA
22 APRIANTO 90 23 WIRA WATI
ARISMA 72
24 YUNITA 100
25 PITALOKA 81
26 IDA 36
27 NURUL
HIDAYAH 81
28 SELLIN 72
29 NOVIA 63
30 WINARTI 100
31 MONA AUDIEA 63
32 GRESSELIN A.
TIARA 100
33 SITI JULEHA 63
34 YULIANI
ANGGRAINI 63
35 WINDA 81
36 KASPUL A. 100
37 JUNYALBY
LENGKEY 100
38 MEIDRIE
PRANATA 100
39 APRILIANO. K 90 40 SANTY AMIRA 100
Total 3145
Based on the data above, it can be seen that the students’ highest
score of verb was 100 and the students’ lowest score of verb was 31. To
determine the range of score, the class interval, and interval of temporary, the calculed using formula as follows:
The Highest Score (H) =100 The Lowest Score (L) = 31
= 100 – 31 + 1 = 70
The Class Interval (K) = 1 + (3,3) x Log n = 1 + (3,3) x Log 40 = 1 + 5,9020599913 = 6,9020599913 = 7
Interval of Temporary (I) = 𝑅
𝐾= 70
7
= 11
Thus, the range of score was 70, the class interval was 7, and interval of temporary was 11. It was presented using frequency distribution in the following table:
Table 4.2.6The Calculation of Mean of Natural Science Class Based on the Vocabulary Mastery of Verb Score
No Interval (I)
Frequency (F)
Mid point
(X) Fx
1 97 - 107 9 102 918
2 86 – 96 8 91 728
3 75 – 85 8 80 640
4 64 – 74 4 69 276
5 53 – 63 7 58 406
6 42 – 52 2 47 94
7 31 – 41 2 36 72
Total ∑F = 40 ∑Fx = 3,134
Mean
Mx = ∑Fx
= 3,134
40
= 78,35
Table 4.2.7Description Data of Natural Science Class Based on the Vocabulary Mastery of Adjective
No Name Adjective
1 ANDRE RESTU
ADITIA 33
2 HANDOKO 55
3 SANDRO RIANTO 55
4 TRI DAUD
SAPUTRA 33
5 MONICA
BERLIANA 33
6 ISTI KOMAH 11
7 OKTAVI HARRY 44
8 TAMA OKTANIA 11
9 YULIANA 11
10 DESY LESTARI P. 55
11 MEGAWATI 55
12 INNES PUSPITA
APRILY 22
13 WIDYA ASTUTI 44
14 CAHYA
ARIYANTI 22
15 TINTE 33
16 NOVITA SARI 44
17 ANA DELIMA 33
18 NINA SEPTIN
KRISTINA 33
19 LOLIANA 33
20 REBECKA
GLORIA 11
21 SUSAN HELDA
NATALIA 11
22 APRIANTO 11
ARISMA
24 YUNITA 11
25 PITALOKA 11
26 IDA 11
27 NURUL
HIDAYAH 100
28 SELLIN 22
29 NOVIA 11
30 WINARTI 88
31 MONA AUDIEA 100
32 GRESSELIN A.
TIARA 88
33 SITI JULEHA 11
34 YULIANI
ANGGRAINI 77
35 WINDA 66
36 KASPUL A. 22
37 JUNYALBY
LENGKEY 22
38 MEIDRIE
PRANATA 22
39 APRILIANO. K 22
40 SANTY AMIRA 55
Total 1443
Based on the data above, it can be seen that the students’ highest
score of adjective was 100 and the students’ lowest score of adjective was 11. To determine the range of score, the class interval, and interval of temporary, the calculed using formula as follows:
The Highest Score (H) = 100 The Lowest Score (L) = 11
= 90
The Class Interval (K) = 1 + (3,3) x Log n = 1 + (3,3) x Log 40 = 1 + 5,9020599913 = 6,9020599913 = 7
Interval of Temporary (I) = 𝑅
𝐾= 90
7
= 13
Thus, the range of score was 90, the class interval was 7, and interval of temporary was 13. It was presented using frequency distribution in the following table:
Table 4.2.8The Calculation of Mean of Natural Science Class Based on the Vocabulary Mastery of Adjective Score
No Interval (I)
Frequency (F)
Mid point
(X) Fx
1 89 – 101 5 95 475
2 76 – 88 21 82 1,722
3 63 – 75 5 69 345
4 50 – 62 4 58 232
5 37 – 49 1 43 43
6 24 – 36 2 30 60
7 11 – 23 2 17 34
Total ∑F = 40 ∑Fx = 2,911
Mean
Mx = ∑Fx
= 2,911
40
= 72,775
Table 4.2.9Description Data of Natural Science Class Based on the Vocabulary Mastery of Adverb
No Name Adverb
1 ANDRE RESTU
ADITIA 27
2 HANDOKO 27
3 SANDRO RIANTO 36
4 TRI DAUD
SAPUTRA 27
5 MONICA
BERLIANA 45
6 ISTI KOMAH 36
7 OKTAVI HARRY 81
8 TAMA OKTANIA 36
9 YULIANA 81
10 DESY LESTARI P. 45
11 MEGAWATI 36
12 INNES PUSPITA
APRILY 72
13 WIDYA ASTUTI 45
14 CAHYA
ARIYANTI 72
15 TINTE 27
16 NOVITA SARI 27
17 ANA DELIMA 45
18 NINA SEPTIN
KRISTINA 54
19 LOLIANA 54
20 REBECKA
GLORIA 18
21 SUSAN HELDA
NATALIA 27
22 APRIANTO 45
ARISMA
24 YUNITA 45
25 PITALOKA 45
26 IDA 54
27 NURUL
HIDAYAH 100
28 SELLIN 36
29 NOVIA 54
30 WINARTI 45
31 MONA AUDIEA 72
32 GRESSELIN A.
TIARA 45
33 SITI JULEHA 36
34 YULIANI
ANGGRAINI 63
35 WINDA 63
36 KASPUL A. 63
37 JUNYALBY
LENGKEY 45
38 MEIDRIE
PRANATA 63
39 APRILIANO. K 36
40 SANTY AMIRA 54
Total 1909
Based on the data above, it can be seen that the students’ highest
score of adverb was 100 and the students’ lowest score of adverb was 18. To
determine the range of score, the class interval, and interval of temporary, the calculed using formula as follows:
The Highest Score (H) = 100 The Lowest Score (L) = 18
= 83
The Class Interval (K) = 1 + (3,3) x Log n = 1 + (3,3) x Log 40 = 1 + 5,9020599913 = 6,9020599913 = 7
Interval of Temporary (I) = 𝑅
𝐾= 83
7
= 13
Thus, the range of score was 83, the class interval was 7, and interval of temporary was 13. It was presented using frequency distribution in the following table:
Table 4.3.1The Calculation of Mean of Natural Science Class Based on the Vocabulary Mastery of Adverb Score
No Interval (I)
Frequency (F)
Mid point
(X) Fx
1 96 – 108 1 102 102
2 83 – 95 0 89 0
3 70 – 82 5 76 380
4 57 – 69 4 63 252
5 44 – 56 15 50 750
6 31 – 43 7 37 259
Total ∑F = 40 ∑Fx = 1,935
Mean
Mx = ∑Fx
N
= 1,935
40
= 48,375
Based on the calculation above, the mean score of Social Scince Class and Natural Science Class according to the types of test is the mean of proper noun for social science class was 101,3 and natural science class was 89. So, the social science class got higher score than natural science class in proper noun test. Then for the mean verb of social science class was 67 and natural science class was 78,3. So, the natural science class was higher than social science class in verb test. Next, the mean score of social science class in adjective was 73 and natural science class 73. So, the social science class and natural science class get similar score. The last the mean score of adverb for social science class was 45,2 and natural science class was 48,3. So, the naural science class higher than social science class.
B. Test of the Statistical Analysis
Meanwhile, the calculation of Ttest using SPSS 17.0 Program can be seen in the following table :
Group Statistics Group
N Mean Std.
Deviation
Std. Error Mean
Group Statistics Group
N Mean Std.
Deviation
Std. Error Mean
Social Science Class 40 72.80 8.200 1.297
Natural Science Class 40 68.25 9.173 1.450
Independent Samples Test
Nilai Ujian
Equal variances assumed
Equal variances
not assumed Levene's Test
for Equality of Variances
F 1.101
Sig. .297
t-test for Equality of Means
T 2.339 2.339
Df 78 77.040
Sig. (2-tailed) .022 .022
Mean Difference 4.550 4.550
Std. Error Difference 1.945 1.945
95% Confidence Interval of the Difference
Lower .677 .676
Upper 8.423 8.424
difference in English vocabulary mastery between eleventh graders of social science class and natural science class at SMAN-1 Kapuas Hilir was accepted at 5% level of significance.
C. Result of the Data Analysis
In order tocalculate the ttest, the writer used both manual calculation. Both results are expected to support the correct calculation each other.
After knowing Standard Deviation of group I and group II, the writer
calculated the “to” value to examine the hypothesis. But, first of all the writer calculated the variance homogeneity in order to adjust the formula in calculating
the “to” value, becausesome formula used to examine the comparative hypothesis with two sample,thereis Fisher formula.Furthermore, in order to ease the calculation of test of variance homogeneity and test of hypothesis, the writer makes a table to compare the N (number of sample), mean, variance, and deviation standard of two groups.
Table. 4.3.2 The Data of Test Scores of Eleventh Graders of Social Science Class and Natural Science Class at SMAN-1 Kapuas Hilir
No The students’ score in social
science class
The students’ score in natural science class
1 70 66
2 74 74
3 58 78
5 70 60
6 68 58
7 66 80
8 70 58
9 66 62
10 82 76
11 82 72
12 72 76
13 74 74
14 68 78
15 70 60
16 74 68
17 78 74
18 78 76
19 82 50
20 72 54
21 62 66
22 68 64
23 88 62
24 86 68
25 76 64
26 76 56
27 54 80
28 74 56
29 82 60
30 66 84
31 74 80
32 82 82
33 84 50
34 80 70
35 72 70
36 76 66
37 70 70
38 68 72
39 58 70
N 40 40
Mx 72,85 68,27
S1 8,196 9,057
S12 68,965 86,298
1. Variance Homogeneity F = 𝑇𝑒𝐵𝑖𝑔𝑔𝑒𝑠𝑡 𝑉𝑎𝑟𝑖𝑎𝑛𝑐𝑒
𝑇𝑒𝑆𝑚𝑎𝑙𝑙𝑒𝑠𝑡 𝑉𝑎𝑟𝑖𝑎𝑛𝑐𝑒
= 86,298
68,965
= 1,251
Moreover, the result variance homogeneity was compared with F-table on numerator df ( 40-1 = 39) and denominator df (40-1= 39). Based on those df with significant 5%, than the percentage of F table was 1,75. It found that Fvalue was smaller than Ftable (1,251< 1,75). Therefore, it can be said that the variance of those two groups was homogeneous.
Since the number of sample of those two groups was same ( N1 = N2 ), and the variance was homogen. Thus, the testing of t observed was used Fisherformula.
2. Testing of Normality test
Normality test is a test to know about what the writing test had given to the students normally, it shows about:
1) Normality test of Students in Social Science Class
No X Z Table Z
37 84 1,3241 0,4562 0,9115 37 0,925 -0,0135 38 84 1,3241 0,4562 0,9115 38 0,95 -0,0385 39 86 1,5606 0,4522 0,9394 39 0,975 -0,0356 40 88 1,7971 0,4602 0,9599 40 1 -0,0401 Total 2912
Mean 72,80 STDEV 8,196 Ltest 0,0662 Ltable 0,139
The table shows that Ltest= 0,0662< Ltable= 0,139, then the data of students social science class distributed normally.
2) Normality test of Studentsin Natural Science Class
Table 4.3.4 Normality test of Students in Natural Science Class
No X Z Table
Z
19 68 -0,0284 0,0179 0,4801 19 0,475 0,0051 20 68 -0,0284 0,0179 0,4801 20 0,5 -0,0199 21 70 0,1992 0,1093 0,5596 21 0,525 0,0346 22 70 0,1992 0,1093 0,5596 22 0,55 0,0346 23 70 0,1992 0,1093 0,5596 23 0,575 -0,0154 24 70 0,1992 0,1093 0,5596 24 0,6 -0,0404 25 72 0,4269 0,2033 0,6736 25 0,625 0,0486 26 72 0,4269 0,2033 0,6736 26 0,65 0,0236 27 74 0,6546 0,3015 0,7422 27 0,675 0,0672 28 74 0,6546 0,3015 0,7422 28 0,7 0,0422 29 74 0,6546 0,3015 0,7422 29 0,725 0,0172 30 76 0,8823 0,3121 0,8023 30 0,75 0,0523 31 76 0,8823 0,3121 0,8023 31 0,775 0,0273 32 76 0,8823 0,3121 0,8023 32 0,8 0,0023 33 78 1,1100 0,3228 0,8749 33 0,825 0,0499 34 78 1,1100 0,3228 0,8749 34 0,85 0,0249 35 80 1,3378 0,4052 0,9115 35 0,875 0,0365 36 80 1,3378 0,4052 0,9115 36 0,9 0,0115 37 80 1,3378 0,4052 0,9115 37 0,925 -0,0135 38 82 1,5655 0,4190 0,9394 38 0,95 -0,0106 39 82 1,5655 0,4190 0,9394 39 0,975 -0,0356 40 84 1,7932 0,4247 0,9599 40 1 -0,0401 Total 2730
Mean 68,25 STDEV 9,057 Ltest 0,0672
Ltable 0,139
The table shows that Ltest= 0,0672 < Ltable= 0,139, then the data of students nature science class distributed normally.
Table. 4.3.5 The Data of Test Scores of Students Eleventh Graders of Social Science Class and Natural Science Class at SMAN-1 Kapuas Hilir
Scores
X1 X2 X12 X22
X1 X2
70 66 -2,8 -2,25 7,84 5,0625
74 74 +1,2 +5,75 1,44 33,0625
58 78 -14,8 +9,75 219,04 95,0625
58 64 -14,8 -4,25 219,04 18,0625
70 60 -2,8 -8,25 7,84 68,0625
68 58 -4,8 -10,25 23,04 105,0625
66 80 -6,8 +11,75 46,24 138,0625
70 58 -2,8 -10,25 7,84 105,0625
66 62 -6,8 -6,25 46,24 39,0625
82 76 +9,2 +7,75 84,64 60,0625
82 72 +9,2 +3,75 84,64 14,0625
72 76 -0,8 +7,75 0,64 60,0625
74 74 +1,2 +5,75 1,44 33,0625
68 78 -4,8 +9,75 23,04 95,0625
70 60 -2,8 -8,25 7,84 68,0625
74 68 +1,2 -0,25 1,44 0,0625
78 74 +5,2 +5,75 27,04 33,0625
78 76 +5,2 +7,75 27,04 60,0625
82 50 +9,2 -18,25 84,64 333,0625
72 64 -0,8 -14,25 0,64 203,0625
62 66 -10,8 -2,25 116,64 5,0625
68 64 -4.8 -4,25 23,04 18,0625
88 62 15.2 -6,25 231,04 39,0625
86 68 13,2 -0,25 174,24 0,0625
76 64 3,2 -4,25 10,24 18,0625
76 56 3,2 -12,25 10,24 150,0625
54 80 -18,8 +11,75 353,44 138,0625
74 56 +1,2 -12,25 1,44 150,0625
82 60 +9,2 -8,25 84,64 68,0625
66 84 -6,8 +15,75 46,24 248,0625
74 80 +1,2 +11,75 1,44 138,0625
82 82 +9,2 +13,75 84,64 189,0625
80 70 +7,2 +1,75 51,58 3,0635
72 70 -0,8 +1,75 0,64 3,0625
76 66 +3,2 -2,25 10,24 5,0625
70 70 -2,8 +1,75 7,84 3,0625
68 72 -4,8 +3,75 23,04 14,0625
58 70 -14,8 +1,75 219,04 3,0625
84 82 +11,2 +13,75 125,44 189,0625
∑X= 2912 ∑Y= 2730 ∑X1= 249E,14
∑X2= 0 ∑X12= 2622,4
∑X22= 3281,5
t0 = 𝐌𝟏−𝐌𝟐
∑ 𝐗𝟏𝟐𝐍𝟏+ + 𝐍𝟐∑𝐗𝟐𝟐−𝟐 𝐍𝟏𝐍𝟏 + . 𝐍𝟐𝐍𝟐
t=
72,8− 68,25 2622 ,4 +3281 ,5
40 + 40 −2 40 + 40 40 . 40
t = 4,55 5903 ,9
78 X 80 1600
t=
4,55 75,691 X 0,05
t =
4,55 3,78455
t = 4,55
1,945
t = 2,339
The degree of Freedom Df = N1 + N2 – 2
= 40 + 40 – 2 = 78
(Ha was accepted)
Based on the result above, it can be presented by the following table: Table 4.3.6 The Result of Tobserved
t0 tt Df
2,339 1,991 78
Where :
to : The value of tobserved
tt : The value of ttable