Study on Species... (Riyanto and Wuryanta)
Study on Species Diversity and Stand Structure in Meru Betiri National Park
Heru Dwi Riyanto and Agus Wuryanta
Balai Penelitian Teknologi Kehutanan Pengelolaan Daerah Aliran Sungai, Jl. A.Yani, Pabelan P.O. BOX 295 Kartasura-Surakarta Telp.(0271)716709, Fax. (0271)716959
Corresponding E-mail: [email protected]
Abstract
National parks are forest ecosystems that contain biotic and abiotic resources. Biodiversity is the data and information necessary to understand the degree of loss of species diversity and formulate a sustainable alternative of decline in these resources. The research objective is to study the reciprocal relationship between elevation and habitat of a species in an ecosystem. Research conducted at the National Park (TN) Meru Betiri. The results show that there are spatial variabilities of the species diversity based on the elevation in the study area. Elevation is inversely proportional to species diversity index, the higher the elevation, the species diversity index tends to decline, but the index of the importance of endemic species have increased. Group stand structure and species composition is influenced by the level of elevation with their own environment.
Keywords: Meru Betiri National Park, species diversity, stand structure, species composition
Abstrak
Taman Nasional adalah ekosistem hutan yang mengandung sumberdaya biotik dan abiotik. Keanekaragaman hayati adalah data dan informasi penting untuk memahami besarnya kehilangan keanekaragaman spesies dan merumuskan alternatif yang berkelanjutan dari penurunan sumber daya tersebut. Tujuan penelitian adalah untuk mempelajari hubungan timbal balik antara ketinggian tempat dengan hunian suatu spesies dalam suatu ekosistem. Penelitian dilaksanakan di Taman Nasional (TN) Meru Betiri. Hasil penelitian menunjukkan bahwa terdapat variabilitas spasial keanekaragaman hayati berdasarkan ketinggian tempat pada taman nasional tersebut. Elevasi atau ketinggian berbanding terbalik dengan indeks keanekaragaman spesies, semakin tinggi elevasi atau ketinggian maka indeks keanekaragaman spesies cenderung menurun, tetapi indeks nilai penting dari spesies endemik mengalami peningkatan. Kelompok struktur tegakan dan komposisi spesies dipengaruhi oleh tingkat elevasi dengan lingkungan mereka sendiri.
Kata kunci: Taman Nasional Meru Betiri, keragaman spesies, struktur tegakan, komposisi spesies
Introduction
Meru Betiri National Park is one of the tropical for-est in Java island (80 20’ 48’’ - 80 33’ 48’’ S and
1130 38’ 48’’ - 1130 58’ 30’’ E), and its status is for
the conservation of fauna and floral species, and world heritage site and a biosphere reserve. The Park is situated within a predominantly rural farming community. Therefore, some areas were converted into farms, particularly for cash crop, several non-timber forest product which the people needed for some of their other economic activities are also depleted source. Along the change of period to governance in the new order becomes a reform governance makes the TN-MB ruined as the effect
of foray. Watershed management office of Sampean-Madura DAS (2002) reported that National Park of Meru-Betiri which its width 58.000 Ha, for about 4.023 Ha have destroyed from forest becomes farm of community cash crop (Subaktini, 2006).
to many failures in the replanting effort. On the other hand there are many other species of the desired current value of the timber, requires further research for their genetic diversity and their importance in terms of local use by people who live near the park. There is a need, in future studies, to assess the variability for future sylviculture treatment and breeding. This is especially necessary if these plants assume positions of value in the future, or are over-exploited and become rare (Oteng, 1994).
Sustainable forest management is an important issue in Indonesia. Sound forest management cannot pos-sibly be applied without an understanding of the ba-sic ecology of the forest. One prerequisite for sus-tainable forest management is reliable information on stand dynamic and its characteristics since it is essential to know how the forest will grow and respond to natural condition or occasional disturbances. However, little information is available regarding the dynamic of species composition, structure, biological/species diversity changes of tropical forest in Indonesia over time (Krisnawati H,at all. 2011).
Biodiversity/species diversity (biological diversity) is the variety and variability among living organisms and the ecological complexes in which they occur (Smitinand, 1994). Stand structure is the distribution of trees per unit area (ha) in different diameter classes (Meyeret al., 1961in
Supriyantoet al., 2001). Supriyantoet al., (2001) stated that a natural forest ecosystem is healthy if the structure of the stand represent by different classes of diameter.
Most studies in Indonesia are based on survey on compositional and structural pattern of certain sites of forest at one occasion. Forest vegetation, how-ever, are dynamic and changes occur continuously at individual and species population level throughout time, eventhough the vegetation as a whole is expected to be stable, several studies on forest dynamic in other tropical regions have been conducted (Krisnawati H,at all. 2011).
This paper studies the relationship between elevation level and species occupancy in the ecosystem, in order to achieve good conservation, management and to save the remaining other forest zone in the park. The result was expeted to inform the Meru Betiri National Park vegetation of each elevation level.
Research Method
Location
The study was conducted at Meru Betiri National Park area which is located between 80 20’ 48’’ - 80 33’ 48’’ S and 1130 38’ 48’’ - 1130 58’ 30’’ E (see
Figure 1). The area is approximately of 58,000 ha, of which ± 37,585 ha include in District of Jember and ± 20,415 ha in District of Banyuwangi. Meru Betiri rainfall devides into two parts, the annual average of rainfall in western part of Meru Betiri is 1880.5 mm, and the eastern part is 2094.6 mm. Three soil types dominated in Meru Betiri forest area (Entisol occu-pied of 47,271.57 ha; 86.2%), Inseptisol (6,264.304 ha; 11.4%) and Spodosol (1,292.954 ha; 2.54%) (Paiminet al., 2003).
Equipments
Altimeter, geographic position system, phi-band, compass.
Data Collecting and Analysis
The survey was collaborated with the Meru Betiri National Park and Watershed Forest Research Insti-tute Surakarta, by using 5 transect lines (20 m wide)
as plots across the contour from 0 m – more than
1,100 m above sea level (asl). The plots were cho-sen purposively at the areas where the elevation of
0 m – more than 1,100 m asl occurred. The species
diversity was studied by grouping into different inter-val elevation of 100 m asl.
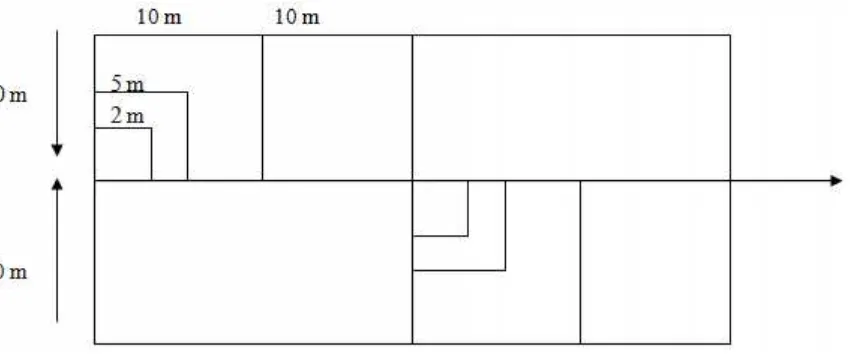
The sub-plots size varies from 20 m x 20 m for trees, 10 m x 10 m for poles, 5 m x 5 m for saplings, 2 m x 2 m for seedling and undergrowth. Figure 2. Shows the distribution of subplot in each plot. (Soerianegara, I dan Andry, I. 1997).
All plants in each square plot were counted and iden-tified to the species level. Diameter at breast height (DBH) and height were measured and recorded. These data were used for computation of vegetation
parameters including density(H’), frequency, basal area
and Important Value Index (IVI), and Shannon -Wiener Index for diversity. The IVI is a composite index based on measures of relative frequency, rela-tive density, and relarela-tive dominance (Mueller- Dombois and Ellenberg, 1974in Kiratiprayoonet al., 1994). The Shannon -Wiener index relates to the proportional weight of the number of individu per species to the
total sample belonging to all species. If H’ value >
3.00, species diversity is abundance/high, if the value
1.00 d” H’ d” 3.00, species diversity is medium, ff H’
Figure 2. The Distribution of Sub-plots in Each Plot
Figure 1. The Study Area
ZONATION MAP OF MERU
BETIRI NATIONAL PARK
NORTH
Legend:
Results and Discussion
Species Diversity
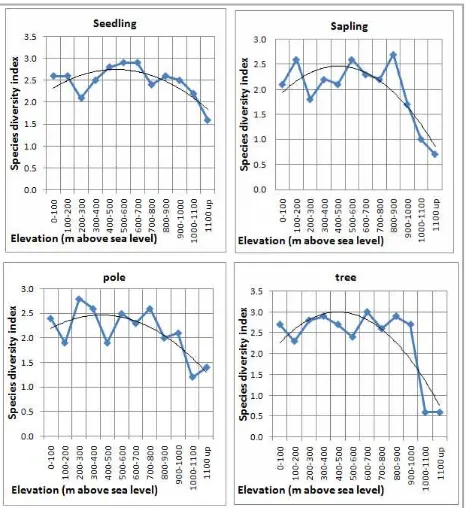
Species diversity generally describes the composi-tion condicomposi-tion which reflect although sum of species (richness) in one of biological community and also abundance which are distributed among the different species. The observation of diversity can clearly help us to put and start knowing the present situation and future about the distribution. Species diversity of tree, pole, sapling and seeding/undergrowth groups were shown in Figure 3.
In general, in all almost elevation, species diversity
value index is on medium value (1,00 d” H’ d” 3,00),
only for sapling and trees on more than 1,000 m asl, the species diversity value index is on rare/low value
(H’< 1). Based on Samingan (1997) as cited in
Kuswanda and Mukhtar. 2009), the habitat condition on elevation under 1,000 m asl in generally is uncon-strained habitat. Still from Figure 2, it is interesting to note that all groups (seedling/undergrowth, sapling, pole and tree) have the same trend line of species diversity, the trend line show there is tend of influ-ence between elevation and species diversity or spe-cies existing.
Stand Structure
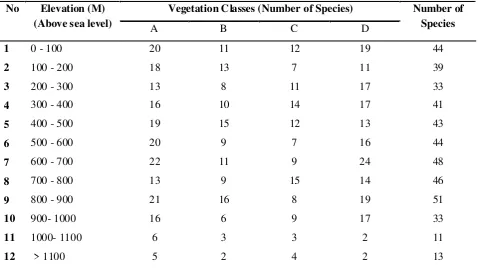
The study of vegetation/species structure is the same as the species diversity study. The stand structure was classified into tree, pole, sapling and seeding/ undergrowth (Table 1). Based on Richard (1964) stand structure is the separation of individual plant in crown layer, and it is meant the separation of trees or plants per hectare within their class diameter (plant/ tree classification). Based on Supriyantoet al.(2001) forest ecosystem health was, if the stand structure represent the class diameter or the plant classifica-tion (tree, pole, sapling, seedling and under growth) in the same area.
Not all composition and structure group exist in each elevation level, it means the elevation levels with their own environment influence to the composition and structure group. From the Table 1 showed that the
elevation 500 m – 600 m asl untill 800 m – 900 m asl
is the most optimal elevation for the vegetation growth, this is showed by the biggest number of species and number of groups in vegetation structure.
Species Composition
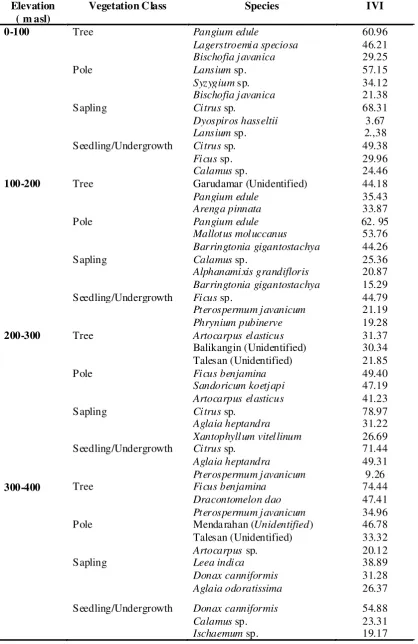
The analysis of (IVI) was done for knowing the spe-cies composition on some level of plants growth, and IVI is a composite index based on measuring of rela-tive frequency, relarela-tive density, and relarela-tive dominance (Kuswanda and Mukhtar, 2009). This value show the domination level of plants spesies in a land site.
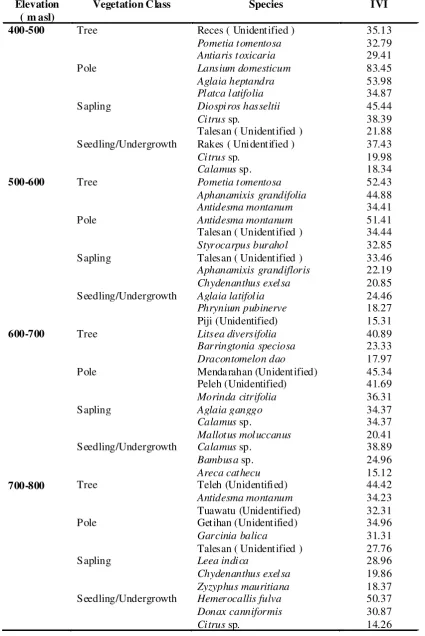
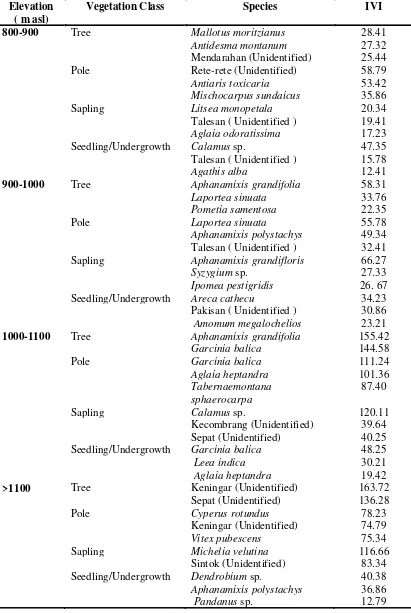
The result of the vegetation/plant class on each elevation with their importance value index, showed at Table 2.
The result from Table 1, Showed there are difference between the elevation < 1000 m above sea level and > 1000 m above sea level, especially on the species number and dominant species. More than 30 species occur on < 1000 m above sea level, and only 11, 13 specieses occur on > 1000 m above sea level. The dominant species (level of plant growth) that is showed by the highest IVI value are : 74% (tree), 83% (pole), 79% (sapling) and 71% (seedling/under growth) on < 1000 m above sea level. And on > 1000 m above sea level are : 164% (tree), 111% (pole), 120% (sapling) and 68% (Seedling/under growth).
No Elevation (M)
(Above sea level)
Vegetation C lasses (Number of Species) Number of
Species
Elevation ( m asl)
Vegetation C lass Species IVI
0-100 Tree Pangium edule 60.96
Lagerstroemia speciosa 46.21
Bischofia javanica 29.25
Pole Lansiumsp. 57.15
Syzygiumsp. 34.12
Bischofia javanica 21.38
Sapling Citrussp. 68.31
Dyospiros hasseltii 3.67
Lansiumsp. 2.,38
Seedling/Undergrowth Citrussp. 49.38
Ficussp. 29.96
Calamussp. 24.46
100-200 Tree Garudamar (Unidentified) 44.18
Pangium edule 35.43
Arenga pinnata 33.87
Pole Pangium edule 62. 95
Mallotus moluccanus 53.76
Barringtonia gigantostachya 44.26
Sapling Calamussp. 25.36
Alphanamixis grandifloris 20.87
Barringtonia gigantostachya 15.29 Seedling/Undergrowth Ficussp. 44.79
Pterospermum javanicum 21.19
Phrynium pubinerve 19.28
200-300 Tree Artocarpus elasticus 31.37
Balikangin (Unidentified) 30.34 Talesan (Unidentified) 21.85
Pole Ficus benjamina 49.40
Sandoricum koetjapi 47.19
Artocarpus elasticus 41.23
Sapling Citrussp. 78.97
Aglaia heptandra 31.22
Xantophyllum vitellinum 26.69 Seedling/Undergrowth Citrussp. 71.44
Aglaia heptandra 49.31
Pterospermum javanicum 9.26
300-400 Tree Ficus benjamina 74.44
Dracontomelon dao 47.41
Pterospermum javanicum 34.96 Pole Menda rahan (Unidentified) 46.78 Talesan (Unidentified) 33.32
Artocarpussp. 20.12
Sapling Leea indica 38.89
Donax canniformis 31.28
Aglaia odoratissima 26.37
Seedling/Undergrowth Donax canniformis 54.88
Calamussp. 23.31
Ischaemumsp. 19.17
Elevation ( m asl)
Vegetation C lass Species IVI
400-500 Tree Reces ( Unidentified ) 35.13
Pometia tomentosa 32.79
Antiaris toxicaria 29.41
Pole Lansium domesticum 83.45
Aglaia heptandra 53.98
Platca latifolia 34.87
Sapling Diospiros hasseltii 45.44
Citrussp. 38.39
Talesan ( Unidentified ) 21.88 Seedling/Undergrowth Rakes ( Unidentified ) 37.43
Citrussp. 19.98
Calamussp. 18.34
500-600 Tree Pometia tomentosa 52.43
Aphanamixis grandifolia 44.88
Antidesma montanum 34.41
Pole Antidesma montanum 51.41
Talesan ( Unidentified ) 34.44
Styrocarpus burahol 32.85 Sapling Talesan ( Unidentified ) 33.46
Aphanamixis grandifloris 22.19
Chydenanthus exelsa 20.85 Seedling/Undergrowth Aglaia latifolia 24.46
Phrynium pubinerve 18.27 Piji (Unidentified) 15.31
600-700 Tree Litsea diversifolia 40.89
Barringtonia speciosa 23.33
Dracontomelon dao 17.97
Pole Menda rahan (Unidentified) 45.34 Peleh (Unidentified) 41.69
Morinda citrifolia 36.31
Sapling Aglaia ganggo 34.37
Calamussp. 34.37
Mallotus moluccanus 20.41 Seedling/Undergrowth Calamussp. 38.89
Bambusasp. 24.96
Areca cathecu 15.12
700-800 Tree Teleh (Unidentified) 44.42
Antidesma montanum 34.23 Tuawatu (Unidentified) 32.31 Pole Getihan (Unidentified) 34.96
Garcinia balica 31.31
Talesan ( Unidentified ) 27.76
Sapling Leea indica 28.96
Chydenanthus exelsa 19.86
Zyzyphus mauritiana 18.37 Seedling/Undergrowth Hemerocallis fulva 50.37
Donax canniformis 30.87
Citrussp. 14.26
Elevation ( m asl)
Vegetation C lass Species IVI
800-900 Tree Mallotus moritzianus 28.41
Antidesma montanum 27.32 Menda rahan (Unidentified) 25.44 Pole Rete-rete (Unidentified) 58.79
Antiaris toxicaria 53.42
Mischocarpus sundaicus 35.86 Sapling Litsea monopetala 20.34 Talesan ( Unidentified ) 19.41
Aglaia odoratissima 17.23 Seedling/Undergrowth Calamussp. 47.35 Talesan ( Unidentified ) 15.78
Agathis alba 12.41
900-1000 Tree Aphanamixis grandifolia 58.31
Laportea sinuata 33.76
Pometia samentosa 22.35
Pole Laportea sinuata 55.78
Aphanamixis polystachys 49.34 Talesan ( Unidentified ) 32.41 Sapling Aphanamixis grandifloris 66.27
Syzygiumsp. 27.33
Ipomea pestigridis 26. 67 Seedling/Undergrowth Areca cathecu 34.23 Pakisan ( Unidentified ) 30.86
Amomum megalochelios 23.21
1000-1100 Tree Aphanamixis grandifolia 155.42
Garcinia balica 144.58
Pole Garcinia balica 111.24
Aglaia heptandra 101.36
Tabernaemontana sphaerocarpa
87.40
Sapling Calamussp. 120.11
Kecombrang (Unidentified) 39.64 Sepat (Unidentified) 40.25 Seedling/Undergrowth Garcinia balica 48.25
Leea indica 30.21
Aglaia heptandra 19.42
>1100 Tree Keningar (Unidentified) 163.72
Sepat (Unidentified) 136.28
Pole Cyperus rotundus 78.23
Keningar (Unidentified) 74.79
Vitex pubescens 75.34
Sapling Michelia velutina 116.66 Sintok (Unidentified) 83.34 Seedling/Undergrowth Dendrobiumsp. 40.38
Aphanamixis polystachys 36.86
Pandanussp. 12.79
Discussion
From the result that we have mentioned above, this prove that higher elevation on tropical rain forest in-fluence the species separation (Ewusie 1990). Tivy (1993) in Setyawati, 1998) stated that the climate changes caused by elevation difference should make biotic zone that will show different species/vegeta-tion formaspecies/vegeta-tion in each elevaspecies/vegeta-tion.
Based on Sumarwoto (1983in Irwan, 1997) each species has difference tolerance to the environment, same opinion by Boughey (1973in Wirakesumah, 2003) every ecologic factor where the organisms give their response there are maximum and mini-mum influence, this fenomena calls as tolerance boundary. The consept of tolerance boundary usu-ally was applied to study the separation schema. Any rationalized strategy for species diversity conserva-tion must be based on those informaconserva-tion. To set aside conservation areas that will protect the fullest range of species requires more complete knowledge of the distribution and abundance of organisms . (Lubchenco
et al. 1991in Gajaseni and Boonpragob, 1994).
For the enrichment planting purpose by considering the right species with their elevation is the most im-portance in order to success the purpose. Species
with the biggest importance value index must be cho-sen than the other ones with smaller importance value index, can be consider as vegetation materials to the purpose above. Petocz (1987 in Lekito and Max, 2003) said that more higher place from above sea level, the floral diversity is lower, but higher in species vegetation endemic value.
Conclusion
(1) The highest and the lowest of species diversity
(H’): at seedling/undergrowth group respectively are
: the highes is 2.90 on 600-700 m asl, and the lowest is 1.60 on up to 1100 m asl; at sapling group the high-est is 2.70 on 800-900 m asl the lowhigh-est is 0.70 on up to 1100 m asl; at pole group the highest is 2.80 on
200-300 m asl and the lowest is 1.20 on 1000 – 1100
m asl , and at tree group the highest is 3,00 on 600-700 m asl, the lowest is 0.70 on up to 1100 m asl, (2) Higher of the elevation on Meru Betiri National Park, the species diversity index were tend to decrease but more higher of the endemic value of the species such asMorinda citrifolia (tree),Vitex pubescens (pole),
Michelia velutina (sapling) and Dendrobium sp (seedling/undergrowth), (3) The structure group and the composition of species is influenced by elevation levels with their own environment
References
Departemen Kehutanan. 1999. Undang-Undang Kehutanan No. 41 1999.
Ewusie, J.Y. 1990. Pengantar Ekologi Tropika: Membicarakan Alam Ekologi Tropika Afrika, Asia, Pasifik dan Dunia Baru. Terjemahan Usman Tabuwijaya. Institut Teknologi Bandung, Bandung.
Gajaseni, J. and K. Boonpragob. 1994. Method for Measurement of Species Diversity. Proceeding of a IUFRO Symposium. Measuring and Monitoring Biodiversity in Tropical and Temperate Forest: 303-307.
Irwan, N.D. 1997. Prinsip-prinsip Ekologi dan Organisasi Ekosistem Komunitas dan Lingkungan. Bumi Aksara.
Kiratiprayoon, S., L. Jesada, D. Pralong, T. Metinee. 1994. Species Diversity of Second Growth at Ngao Demonstration Forest, Lampang Province. Proceeding of a IUFRO Symposium. Measuring and Moni-toring Biodiversity in Tropical and Temperate Forest : 237-245.
Krisnawati.H, Djoko.W, Rinaldi. I. 2011. Changes in The Species Composition, Stand Structure And Aboveground Biomass of A Lowland Dipterocarp Forest in Samboja, East Kalimantan.
Kuswanda, W and A.S. Mukhtar. 2009 Kondisi Vegetasi dan Strategi Perlindungan Zona Inti di Taman Nasional Batang Gadis, Sumatera Utara (Vegetation Condition and Strategis for Protecting Sanctuary Zone At The Batang Gadis National Park, North Sumatera) Info Hutan Vol. VI (1) Tahun 2009, Pusat Penelitian dan Pengembangan Hutan Dan Konservasi Alam, Bogor: 59-74
Oteng, A.A. 1994. Biodiversity Assessment of Forest Tree Species in Bia National Park Ghana. Proceeding of a IUFRO Symposium. Measuring and Monitoring Biodiversity in Tropical and Temperate Forest: 247-256.
Paimin, H. Beni, D.R. Heru, Purwanto, B.S. Agung, W. Agus. 2003. Laporan Kajian Kriteria dan Indikator Penetapan Zonasi Taman Nasional Meru Betiri- Jember. Balai Penelitian Dan Pengembangan Teknologi Daerah Aliran Sungai.Solo (Tidak diterbitkan).
Peraturan Pemerintah No. 68 Tahun 1998. Tentang Kawasan Suaka Alam dan Kawasan Pelestarian.
Setyawati, T. 1998. Studi Fisiognomi Vegetasi Hutan di Kawasan Taman Nasional Gunung Gede Pangrango Jawa Barat, Buletin Penelitian Hutan No. 612 Tahun1998 Bogor : 27-37.
Smitinand, T. 1994. Overview of the Status of Biodiversity in Tropical and Temperate Forest. Proceeding of a IUFRO Symposium. Measuring and Monitoring Biodiversity in Tropical and Temperate Forest : 1- 4.
Subaktini,D. 2006. Analisis Sosial Ekonomi Masyarakat Di Zona Rehabilitasi Taman Nasional Meru Betiri, Jawa Timur. Forum Geografi, Jurnal Geografi Universitas Muhammadiyah Surakarta.
Supriyanto, U.S. Irawan, E.I. Putra. 2001. Stand Structure (Status, Change, Trends) in Forest Health monitor-ing. Forest Health Monitoring to Monitor the Sustainability of Indonesian Tropical Rain Forest.