Chapter 17
Partial Least Squares Regression
The Partial Least Squares Regression procedure estimates partial least squares (PLS, also known as "projection to latent structure") regression models. PLS is a predictive technique that is an alternative to ordinary least squares (OLS) regression, canonical correlation, or structural equation modeling, and it is particularly useful when predictor variables are highly correlated, or when the number of predictors exceeds the number of cases.
PLS combines features of principal components analysis and multiple regression. It first extracts a set of latent factors that explain as much of the covariance as possible between the independent and dependent variables. Then a regression step predicts values of the dependent variables using the decomposition of the independent variables.
17.1. Using Partial Least Squares Regression to Model Vehicle Sales
An automotive industry group keeps track of the sales for a variety of personal motor vehicles. In an effort to be able to identify over- and underperforming models, you want to establish a relationship between vehicle sales and vehicle characteristics.
Information concerning different makes and models of cars is contained in car_sales.sav. See the topic Sample Files for more information. Since vehicle characteristics are correlated, partial least squares regression should be a good alternative to ordinary least squares regression.
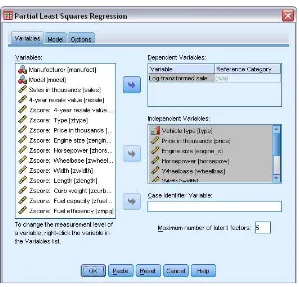
17.1.1. Running the Analysis
Figure 269 Partial Least Squares Regression Variables tab
2. Select Log-transformed sales [lnsales] as a dependent variable.
Select Vehicle type [type] through Fuel efficiency [mpg] as independent variables.
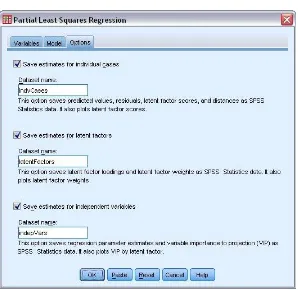
Figure 270 Options tab
4. Select Save estimates for individual cases and type indvCases as the name of the dataset.
5. Select Save estimates for latent factors and type latentFactors as the name of the dataset.
6. Select Save estimates for independent variables and type indepVars as the name of the dataset.
7. Click OK.
17.1.2. Proportion of Variance Explained
Figure 271 Proportion of variance explained
The first factor explains 20.9% of the variance in the predictors and 40.3% of the variance in the dependent variable.
The second factor explains 55.0% of the variance in the predictors and 2.9% of the variance in the dependent.
The third factor explains 5.3% of the variance in the predictors and 4.3% of the variance in the dependent. Together, the first three factors explain 81.3% of the variance in the predictors and 47.4% of the variance in the dependent.
Though the fourth factor adds very little to the Y variance explained, it contributes more to the X variance than the third factor, and its adjusted R-square value is higher than that for the third factor.
The fifth factor contributes the least of any factor to both
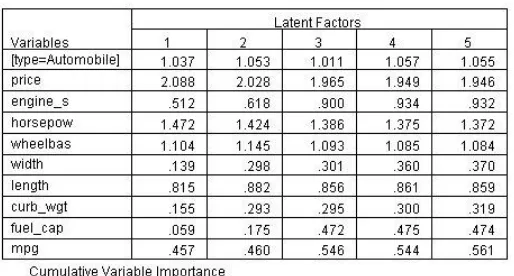
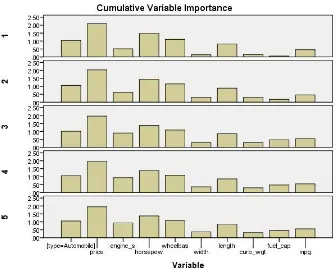
Figure 273 Variable importance in the projection
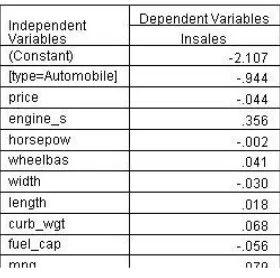
The variable importance in the projection (VIP) represents the contribution of each predictor to the model, cumulative by the number of factors in the model. For example, in the one-factor model, price loads heavily on the first factor and has a VIP of 2.088. As more factors are added, the cumulative VIP for price slowly drops to 1.946, presumably because it does not load very heavily on those factors. By contrast, engine_s has a VIP of 0.512 in the one-factor model, which rises to 0.932 in the five-factor model.
Figure 274 indepVars dataset
Figure 275 Cumulative variable importance chart
The cumulative variable importance chart provides a visualization of the variable importance in the projection table. For information on the contribution of predictors to individual factors instead of the cumulative model, see the output for latent factors.
17.1.4. Output for Latent Factors
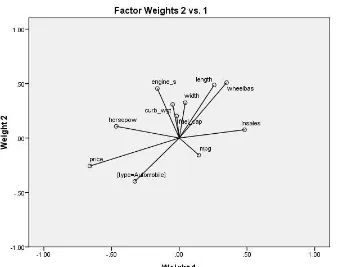
Figure 276 Weights
largest on the first latent factor and relatively small in the others, while the weight for engine_s is relatively small on the first factor. What becomes clear from this table is to which factors engine_s contributes most; it has the largest weight of any predictor on the third factor and the second largest on the fourth. Its relatively small weight on the fifth factor explains the slight dip in cumulative importance from the four-factor model to the five-factor model.
Figure 277 latentFactors dataset
Figure 278 Factor weights 2 vs. 1
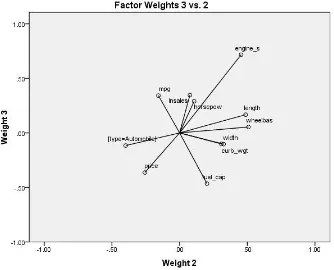
Figure 279 Factor weights 3 vs. 1
In the space defined by factor weights 3 and 1, fuel_cap, which was positively correlated with engine_s in the 2 vs. 1 plot, is negatively correlated on factor 3.
In the space defined by factor weights 3 and 2, lnsales appears more strongly correlated with mpg, engine_s, and fuel_cap than in previous plots, illustrating the importance of multiple points of view.
17.1.5. Output for Individual Cases
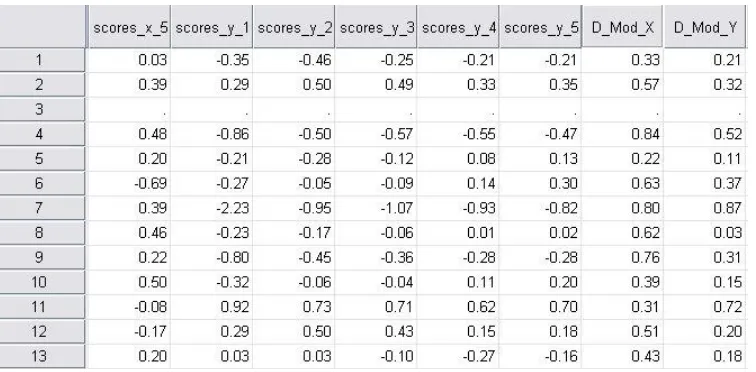
Figure 281 indvCases dataset
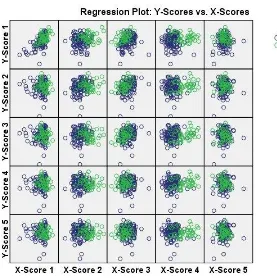
Figure 282 Y scores vs. X scores
This scatterplot matrix should show high correlations in the first couple of factors (plots in the upper left of the matrix), gradually diffusing to very little correlation. It can be useful for identifying potential outliers for further investigation.
Plotting the X scores against themselves is a useful diagnostic. There shouldn't be any patterns, groupings, or outliers.
Outliers are potential influential cases; there are a few to investigate in this plot.