THE INFLUENCE OF MARKETING MIX, CUSTOMER SATISFACTION, AND
BRAND LOYALTY TOWARDS REPURCHASE INTENTION OF XIAOMI SMARTPHONE
( XIAOMI COMMUNITY IN INDONESIA )
Reza Sofie Hidayat
1112081100003
MANAGEMENT DEPARTMENT
INTERNATIONAL PROGRAM
FACULTY OF ECONOMIC AND BUSINESS
CHAPTER I
INTRODUCTION
A.
Background
In this era of globalization, technological development more intensively conducted, in
order to provide convenience for people in carrying out daily activities. The most influential
technology for humans, namely cellular telephone technology (mobile phones).
The use of mobile phones in Indonesia is ranked 4th in the world with over 250 million
mobile phones in circulation in 2012, even exceeding the number of population itself. This
phenomenon is not separated from the character of Indonesian consumers who tend to cluster
and like to socialize. (www.carakupedia.com)
Cellular technology is already being developed by the developed countries in Europe
since the decade of the 70s, but recently introduced in Indonesia in 1984 with technology based
Nordic Mobile Telephone (NMT). But now mobile phone technology has developed rapidly, the
first mobile phone function is only to communicate through audio, now the technology of
audio-visual communication. Features short message service (SMS), send a picture (MMS), the Internet,
has become a mandatory feature on the phone.
Along with the times, the needs and desires of consumers is growing. They are not
satisfied with the standard features of communication, but also advanced features that can
simplify the daily activities of consumers. To answer this challenge, then comes the smartphone
products in the world.
Smartphone is a phone which provides features that are above and beyond the simple
ability to make phone calls. While the term can be used appropriately for all kinds of phones,
smartphones usually understood as a phone and not a landline.
the BBM (BlackBerry Messenger). The last few years the smartphone market increasingly
widespread and many variations, started by products from Samsung that became a phenomenon.
Then was born a few brands of smartphone newcomers began to break the market that are trying
to compete with the market owned by Samsung. (www.sridianti.com)
Lately, a brand named Xiaomi smartphone that carries a high level specification but still
with a friendly price, is now increasingly popular among users of smartphones in the world,
including Indonesia. Only less than five years since its foundation in 2010, Xiaomi has incarnated
as 5 smartphone brand with the highest sales in the world. Even the latest news says that Xiaomi
has solved a record sales and record his name in the Guinness World Record.
(www.guinnessworldrecords.com)
Xiaomi was founded in 2010 by serial entrepreneur Lei Jun, who believes that
high-quality technology doesn't need to cost a fortune. Xiaomi brought together smart people from
Google, Kingsoft, Microsoft, Motorola, Yahoo, and other Internet and tech companies from
around the world to bring that vision to life. Xiaomi create remarkable hardware, software, and
Internet services for – and with the help of Mi fans. Xiaomi incorporate their feedback into its
product range, which currently includes Mi 4, Mi 3, Mi Pad, Mi Box, Mi TV, Redmi 1S and Redmi
Note, Mi Power Bank and other accessories. Xiaomi sell direct to customers to keep the prices
competitive. And with more than 18 million handsets sold in China in 2013 and products
launched in Taiwan, Hong Kong, Singapore, Malaysia, Philippines, India and Indonesia, Xiaomi is
ready to go global. (
www.mi.com
)
Until now, Xiaomi has successfully launched various types of smartphones are divided
into three different series, namely:
•
XiaomiMi: MI1 (2011), Mi1S (2012), Mi2 (2012), Mi2S (2013), Mi2A (2013),
MI3 (2013), MI4 (2014).
•
Mi Note: Mi Note (2015), Mi Note Pro (2015), Mi Note Plus (2015).
•
Xiaomi Redmi: Redmi 1 (2013), Redmi 1S (2014), Redmi Note 4G (2014),
Redmi 2 (2015). (gsmarena.com)
of 2012 and just over half the 2013 sales numbers. Demand continues to increase due to the high
specification hardware of their devices and the price they sell their products at.
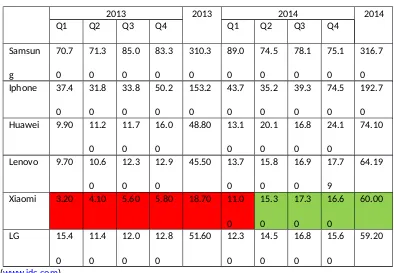
Table 1.1
The Sales of Smartphone 2013-2014
2013
2013
2014
2014
Xiaomi
3.20
4.10
5.60
5.80
18.70
11.0
0
Company run by billionaire Lei Jun's have managed to control 5% share of the global
smartphone market in the last three months. Similarly, the latest data released firm Strategy
Analytics.
In the second quarter of 2014, recorded Xiaomi has sent 15.3 million smartphones.
Xiaomi now has a market share of 5.1%, up from 1.8% in the same period last year.
(tekno.liputan6.com)
Figure 1.1
According to the data of market share above, Xiaomi was start to come in the top five of
smartphone as a new comer in second quarter of 2014 and they got fourth position with 5.6%.
The First was still Samsung and they got 21.4%. The second was Apple and they got 13.9%. The
third was Huawei with 8.7%, the fifth was Lenovo with 4.7% and other platforms got 45.7%
(www.idc.com). The table above shows that the competition of smartphone platforms is strict.
Therefore, Xiaomi android should take more cautions to every opportunity in order to compete
with other. One of their strategies is to retain their customers to always buy their products. It can
be done by increasing the customer satisfaction.
According to Peter and Olson (2010: 387) in theory, if consumers are satisfied with a
product, service, or brand, they will be more likely to continue to purchase it and tell others about
their favorable experiences with it. Thus, these things can also influence the repurchase intention
of customers. Repurchase intention is defined by Hellier, Geursen, Carr, and Rickard in Chinomona
and Dubihlela (2014: 24) as the individual’s decision about repeatedly buying the product/ service
from the same company, taking into account his/ her current situation and circumstances. The
decision to repurchase represents the customer’s decision to engage in continuous consumption
of the product.
possibilities can be collected into four groups of variable known as "the four Ps": product, price,
place, and promotion (Armstrong and Kotler, 2009: 83).
According to Oliver (1999:34), customer's loyalty is "a deep held commitment to re buy
or re-patronize a preferred product/service consistently in the future, thereby causing repetitive
same -brand or same brand-set purchasing, despite situational influences and marketing efforts
that have the potential to cause switching behavior".
Based on the background above, the writer is interested to do a research with the title
“The influence of marketing mix, customer satisfaction, and brand loyalty
towards repurchase
intention of Xiaomi Smartphone (Xiaomi Community)”.
B. Research Question
Based on the background that the author has described, the formulations of the
problem are:
1.
Do product, price, promotion, and place have significant influence towards repurchase
intention of Xiaomi smartphone?
2.
Do customer satisfaction have significant influence towards repurchase intention of
Xiaomi smartphone?
3.
Do brand loyalty have significant influence towards repurchase intention of Xiaomi
smartphone?
4.
Do product, price, promotion, customer satisfaction, and brand loyalty have significant
influence towards repurchase intention of Xiaomi smartphone Partially?
C. Purposes of Research
Based on the questions above, the purposes of this research are:
1.
To analyze the influence of product, price, promotion, and place towards repurchase
intention of Xiaomi smartphone.
2.
To analyze the influence of customer satisfaction towards repurchase intention of
Xiaomi smartphone.
3.
To analyze the influence of brand loyalty towards repurchase intention of Xiaomi
smartphone.
4.
To analyze the influence of product, price, promotion, customer satisfaction, and brand
loyalty toward repurchase intention of Xiaomi Smartphone simultaneously.
D. Research Advantages
2. For company, the result of this research can be used to improve the strategy of Samsung
platform because the results are based from customers’ perceptions.
3. For Islamic State University (UIN) Jakarta, the research can also be used for other
students in order to help the students to finish their thesis.
4. For reader and Another Research, I hope people who read this research will feel easy to
read the methods of this research.
CHAPTER II
LITERATURE REVIEW
A. Marketing Mix
1. Definition of Marketing Mix
The marketer’s task is to devise marketing activities and assemble fully
integrated marketing programs to create, communicate, and deliver value for consumers.
Marketing activities come in all forms. They classified these tools into four broad groups
that he called the four Ps of marketing: product, price, place and promotion (Kotler et al,
2009: 23).
Marketing mix refers to a unique blend of product, distribution (place),
promotion, and pricing strategies (the four Ps) designed to produce mutually satisfying
exchanges with a target market (McDaniel et al, 2007: 14).
According to Hill (2005: 584) the marketing mix is the set of choices the firm
offers to its targeted market. While Mullins, Walker, and Boyd (2008: 19) explain
regarding marketing mix as the combination of controllable marketing variables that a
manager uses to carry out a marketing strategy in pursuit of the firm’s objectives in a
given target market.
Marketing Mix
Source: Kotler et al (2009: 23) “
The Four P Components of The Marketing Mix
”
Marketing Mix
Product
- Product
Variety
- Quality
- Design
- Features
- Brand Name
- Packaging
- Size
- Services
- Warranties
Price
- List Price
- Discount
- Allowances
- Payment
Period
- Credit Term
Promotion
- Sales
Promotion
- Advertising
- Sales Force
- Public
Relation
- Direct
Marketing
Place
Marketing mix encompasses many things that will be mentioned in following:
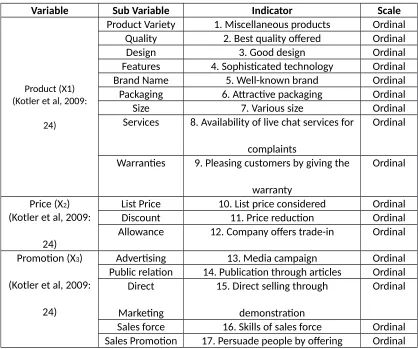
a. Product consists of product variety, quality, design, features, brand name,
packaging, size, services, and warranties.
1) Product variety
Is the assortments breadth provided by marketing channel. Normally,
customers prefer a greater assortment because more choices increase the
chance of finding what they need (Kotler et al, 2009: 467)
2) Quality
It means the totality of features and characteristics of a product or service
that bear on its ability to satisfy stated or implied needs (Kotler et al, 2009:
139).
3) Design
Means the totality of features that affects how a product looks and functions
in terms of customer requirements (Kotler et al, 2009: 369)
4) Features It supplements the product’s basic function (Kotler et al, 2009:
4364)
5) Brand name It carries many associations in the minds of people (Kotler et al,
2009: 14)
6) Packaging Means all activities of designing and producing the container for a
product (Kotler et al, 2009: 384)
7) Services Are any act or performance that one party can offer to another that
is essentially intangible and does not result in the ownership of anything
(Kotler et al, 2009: 390)
8) Warranties
Are formal statements of expected product performance by the
manufacturer and products under warranty can be returned to the
manufacturer or designated repair center for repair, replacement, or refund
(Kotler et al, 2009: 386)
b. Price consists of list price, discount, allowances, payment periods and credit
terms.
a. List prices
Are the prices final customers or users are normally asked to pay for products
(Perreault and McCarthy, 2006:410)
A straight reduction in price on purchases during a stated period of time or of
larger quantities (Kotler and Armstrong, 2012: 319)
c. Allowances
There are two allowances such as trade-in allowances and promotional
allowances. Trade-in allowances are granted for turning in an old item when
buying a new one. Promotional allowances reward dealers for participating in
advertising and sales support programs (Kotler et al, 2009: 449)
c.Place consists of channels, coverage, assortments, locations, inventory, and
transport.
a. Distribution channel
Is a set of interdependent organizations that help make a product or service
available for use or consumption by the consumer or business user (Kotler
and Armstrong, 2012: 341).
b. Inventory
Is the physical material that is purchased from suppliers, may or may not be
reworked, and is available for sale to customers (Kerin et al, 2006: 387).
c. Transportation
It provides a movement of goods necessary in a supply chain (Kerin et al,
2006: 432).
d. Transport
It can be defined as physically moving products to customers (Peter amd
Donelly Jr, 2009: 144)
d. Promotion consists of sales promotion, advertising, sales force, public relations,
and direct marketing.
a. Sales promotion
Is a variety of short- term incentives to encourage trial or purchase of a
product or service (Kotler et al, 2009: 529).
b. Public relations
Are a variety of programs designed to promote or protect a company’s image
or its individual products (Kotler et al, 2009: 529).
c. Direct marketing
Is the use of mail, telephone, fax, email, or the internet to communicate
directly with or solicit response or dialogue from specific customers and
prospects (Kotler et al, 2009: 529).
Is the process of face- to- face interaction with one or more prospective
purchasers for the purpose of making presentations, answering questions,
and procuring orders (Kotler et al, 2009: 529).
e. Advertising
Is any paid form of non- personal presentation and promotion of ideas,
goods, or services by an identified sponsor (Kotler et al, 2009: 529).
2. Elements of Marketing Mix
a. Product
Product means the goods-and- services combination the company offers to the
target market (Armstrong and Kotler, 2009: 83).
Product is anything that can be offered to a market for attention, acquisition,
use, or consumption that might satisfy a wamt or need. Broadly, product includes
services, events, persons, places, organizations, ideas, or mixes of these.
(Armstrong and Kotler, 2009: 230-231).
A product is anything that can be offered to a market to satisfy a want or need
(Kotler
et al
, 2009: 360). A product may be defined as everything, both favorable
and unfavorable, that a person receives in an exchange (McDaniel et al, 2007:
262).
1) Product Levels: The Customer Value Hierarchy
According to Kotler
et al
(2009: 360) several levels of product that can
be considered by the buyers, there are:
a)
The fundamental level is the
core benefit
: the service or benefit that the
consumer really wants to buy. A hotel guest buys “rest and sleep”. A
woman buying cosmetics is buying “hope”.
b)
At the second level, the marketer has to turn the core benefit into a
basic
product.
Thus a hotel room includes a bed, bathroom, towels, desk,
dresser, and closet.
hotel is most convenient or least expensive. In developing countries and
emerging markets, however, competition takes place at the expected
product level.
d)
At the fourth level, the marketer prepares an
augmented product
that
exceeds customer expectations. In developed countries, brand
positioning and competition take place at this level. For example, several
top Malaysian hotels offer sunshine-and-surgery packages, including full
medical check-ups, to attract foreigners seeking treatment there.
e)
At the fifth level stands the
potential product
, which encompasses all the
possible augmentations and transformations the product or offering
might undergo in the future.
2) The Product Hierarchy
According to Kotler
et al
(2009: 372) the product hierarchy stretches
from basic needs to particular items that satisfy those needs, there are:
a)
Need Family
The core need that underlies the existence of a product family
b)
Product Family
All the product classes that can satisfy a core need with reasonable
effectiveness.
c)
Product Class
A group of products within the product family recognized as having a
certain functional coherence and also known as product category.
d)
Product Line
A group of products within a product class that are closely related
because they perform a similar function, they are sold to the same
customer groups, they are marketed through the same outlets or
channels, or fall within given price ranges. A product line may be
composed of different brands or a single family brand or individual brand
that has been line extended.
e)
Product Type
A group of items within a product line that share one of several possible
forms of the product.
A distinct unit within a brand or product line distinguishable by size,
price, appearance, or some other attribute.
3) Product Classifications
Based on Kotler et al (2009: 362) marketers have traditionally classified
products on the basis of durability, tangibility and use. Products can be
classified into three groups according to durability and tangibility, there are:
a)
Non- durable goods
These are tangible goods normally consumed in one or a few uses, like
soap and soft drink.
b)
Durable goods
These are tangible goods that normally survive many uses such as
refrigerators, machine tools, and clothing.
c)
Services
These are intangible, inseparable, variable and perishable products. As a
result, they normally require more quality control, supplier credibility
and adaptability.
b. Price
1) Definition of Price
Price is not just a number on a tag or an item. Price comes in many forms and
performs many functions. Rent, tuition, fares, fees, rates, tolls, retainers, wages,
and commissions. All may in some way be the price you pay for some good or
service (Kotler et al, 2009: 422).
In the narrowest sense, price is the amount of money charged for a product or
service. More broadly, price is the sum of all the values that customers give up in
order to gain the benefits of having or using a product or service (Armstrong and
Kotler, 2009: 291). Price is the amount of money that customers must pay to obtain
the product (Armstrong and Kotler, 2009: 83).
Price is that which is given up in an exchange to acquire a good or service. Price
is typically the money exchanged for the good or service and it may also be time
lost while waiting to acquire the good or service (McDaniel et al, 2007: 466). Price is
the amount of money customers must pay to obtain the product (Kotler and
Armstrong, 2012: 52).
According to Kotler et al (2009: 450) companies often adjust their basic price to
accommodate differences in customers, products, locations, and so on. These are
the strategies of differentiating price:
a)
Customer - segment pricing
Different customer groups are charged different prices for the same product
or service.
b)
Product – form pricing
Different versions of the product are differently priced but not proportionately
to their respective costs.
c)
Image pricing
Some companies price the same product at two different levels based on
image differences.
d)
Channel pricing
Coca- cola carries a different price depending on whether it is purchased in a
fine restaurant, a fast- food restaurant, or a vending machine.
e)
Location pricing
The same product is priced differently at different locations even though the
cost of offering at each location is the same.
f)
Time pricing
Prices are varied by season, day, or hour.
c. Place (Distribution)
1) Definition of Place (Distribution)
Place includes company activities that make the product available to
target consumers (Armstrong and Kotler, 2009: 83). Place making goods and
services available in the right quantities and locations (Perreault and McCarthy,
2006:246). Distribution channel is a set of interdependent organizations
involved in the process of making a product or service available for use or
consumption by the consumer or business user (Kotler and Armstrong, 2012:
341).
2) Number of Channel Levels
channel
has no intermediary levels; the company sells directly to consumers.
Indirect marketing channel
contains one or more intermediaries such as
wholesaler and retailer.
d. Promotion
1) Definition of Promotion
Promotion means activities that communicate the merits of the
product and persuade target customers to buy it (Armstrong and Kotler,
2009: 84).
Promotion has been defined as the coordination of all seller initiated
efforts to set up channels of information and persuasion in order to sell
goods and services or promote an idea (Belch and Belch, 2009: 18).
Marketers develop promotions to communicate information about
their products and to persuade consumers to buy them. There are four major
types of promotions such as advertising, sales promotion, personal selling,
and publicity (Peter and Olson, 2010: 407).
Promotion is communication by marketers that informs, persuades,
and reminds potential buyers of a product in order to influence their opinion
or elicit a response (McDaniel et al, 2007: 390).
2) Types of Promotion
According to Peter and Olson (2010: 408) the four types of promotion
(advertising, sales promotions, personal selling, and publicity) together
constitute a promotion mix that marketers try to manage strategically to
achieve organizational objective. These are the types of promotion:
a. Advertising
Advertising is any paid, non personal presentation of information
about a product, brand, company, or store. Advertising is intended to
influence consumer’s affect and cognitions- their evaluations, feelings,
knowledge, meanings, beliefs, attitudes and images concerning products
and brands. Advertisement may be conveyed via a variety of
media-internet, TV, radio, billboard, etc.
Sales promotions are direct inducements to the consumer to make a
purchase. Many types of sales promotion and it encompasses coupons,
rebates, contests, trade shows, exhibitions, gifts, free samples, etc.
c. Personal Selling
It involves direct personal interactions between a potential buyer and a
sales person.
d. Publicity
Publicity is any unpaid form of communication about the marketer’s
company, products, or brands. For instance, an article in PC World
comparing various brands of word processing software provides useful
product information to consumers at no cost to the marketers of the
software.
B. Customer Satisfaction
1. Definition of Customer Satisfaction
The word of satisfaction comes from latin "satis" (it means quite good, sufficient) and
"facio" (it means doing or creating). Satisfaction can be translated as "the efforts for fulfilling
something" or "make something adequate" (Tjiptono and Chandra, 2011: 292).
Satisfaction reflects a person’s comparative judgments resulting from a product’s
perceived performance (or outcome) in relation to his or her expectations. If the
performance falls short of expectations, the customer is dissatisfied and disappointed. If the
performance matches the expectations, the customer is satisfied. If the performance exceeds
expectations, the customer is highly satisfied or delighted (Kotler et al, 2009:14).
proportional. Suppose customer satisfaction is rated on a scale from one to five. At a very low
level of customer satisfaction (level one), customers are likely to abandon the company and
even bad-mouth it. At levels two to four, customers are fairly satisfied but still find it easy to
switch when a better offer comes along. At level five, the customer is very likely to
repurchase and even spread good word of mouth about the company. High satisfaction or
delight creates an emotional bond with the brand or company (Kotler et al, 2009: 137).
Customer satisfaction can lead to trust, then a repurchase decision (Jarvenpaa,
Tractinsky, and Vitale in Chinomona and Dubihlela, 2014: 25). Customer satisfaction is a
business philosophy which tends to the creation of value for customers, anticipating and
managing their expectations, and demonstrating ability and responsibility to satisfy their
needs (Dominici and Guzzo, 2010: 3). According to Barsky and Nash in (Dominici and Guzzo,
2010: 3) in order to achieve customer satisfaction, it is important to recognize and to
anticipate customers' needs and to be able to satisfy them. Enterprises which are able to
rapidly understand and satisfy customers' needs, make greater profits than those which fail
to understand and satisfy them.
According to Oliver in (Tjiptono and Chandra, 2011: 292) everyone understands what is
exactly satisfaction, but when they are asked to define it and it seems like no one knows.
Customer satisfaction is customers’ evaluation of a good or service in terms of whether it has
met their needs and expectations (McDaniel et al, 2007: 9). Customer satisfaction is the
extent to which a firm fulfills a customer’s needs, desires, and expectations (Perreault and
McCarthy, 2006: 5). According to Cengiz in Chinomona and Dubihlela (2014: 25) customer
satisfaction is a post consumption experience which compares perceived quality with
expected quality, thus a comparative behavior between inputs beforehand and after
consumption.
2. Factors of Customer Satisfaction
et al (2009: 140) have also said that quality is clearly the key to value creation and customer
satisfaction.
According to Garvin in Tjiptono and Chandra (2011: 193) the dimensions of service
quality for product consist of:
a) Performance
It is the main operation’s characteristic of the core product that is bought. For
instance: speed, comfort, and easiness.
b) Feature
It refers to characteristics that supplement the product’s basic performance.
c) Reliability
It is little possibility of experiencing damage or failed to be used and it happens
to the product that has been bought.
d) Conformance to specifications
It is how far the characteristics of design and operation fulfill the standards that
have been previously determined.
e) Durability
It relates to the measure of the product’s expected operating life.
f) Serviceability
It encompasses speed, competence, comfort, easiness to be repaired, and
complaint handling that satisfy consumers.
g) Esthetics
It is product appeal towards the five senses. For instance: good field, fancy
office, colors, artistic design.
h) Perceived quality
It refers to image and reputation of the product along and the corporate
responsibility towards product. Normally, due to lack of buyer’s knowledge towards
attributes or features of product that will be bought, then buyers perceive quality of
product based on the aspects of price, brand name, advertising, the company’s
reputation, and origin countries of manufacturers.
According to Kotler et al (2009: 405) the researchers have developed about the
dimensions of service, where consumer perceptions on a service dimension would be deemed
satisfactory, anchored by minimum level consumers would be willing to accept and the level that
customers believe can and should be delivered and the dimensions are:
a) Reliability – the ability to perform the promised service dependably and accurately.
b) Responsiveness – the willingness to help customers and to provide prompt service.
c) Assurance – the knowledge and courtesy of employees and their ability to convey trust
d) Empathy – the provision of caring, individualized attention to customers.
e) Tangibles – The appearance of physical facilities, equipment, personnel, and
communication materials.
3. Measurement Techniques
According to Kotler et al (2009: 137) a number of methods exist to measure customer
satisfaction and clear explanation is explained as follows:
a. Periodic Surveys
This can track customer satisfaction directly. Respondents can also be asked
additional questions to measure repurchase intention and the likelihood or
willingness to recommend the company and brand to others.
b. Customer loss rate
Companies can monitor the customer loss rate and contact customers who have
stopped buying or who have switched to another supplier to learn why this
happened.
c. Mystery Shoppers
Companies can hire mystery shoppers to pose as potential buyers and report on
strong and weak points experienced in buying the company’s and competitor’s
products. Managers themselves can enter company and competitor sales situations
where they are unknown and experience firsthand the treatment they receive, or
phone their own company with questions and complaints to see how the calls are
handled.
C.
Brand Loyalty
1) Definition of Brand Loyalty
According to Oliver (1997), customer's loyalty is "a deep held commitment to re buy or
re-patronize a preferred product/service consistently in the future, thereby causing
repetitive same -brand or same brand-set purchasing, despite situational influences and
marketing efforts that have the potential to cause switching behavior" (p. 34).
According to Schultz (2005), loyal customer’s likes to speak about their brand and they
often recommend those brands to their relatives and friends. “Loyalty can be in two
dimensions either the purchase or attitudinal. Purchase loyalty helps to give better market
share while attitudinal loyalty tends to set high prices.”
According to Kelley et al. (1990), "the organizational commitment of service
customers is indicative of the organization's likelihood of developing or maintaining
customer identification with organizational goals and values and retaining the
service customer as an active participant the service encounter” (p. 322).
b. Trust
Morgan and Hunt (1994), stated that “Trust is an important factor in the
development of marketing relationships and exists when one party has confidence
in an exchange partner's reliability and integrity" (p. 23). According to Ballester and
Aleman (2001), trust and satisfaction both are conceptually connected with each
other. Anderson and Narus (1990), Described that trust arise when a person believe
that the organization action will not damage its ethical norms and values.
c. Brand Image
Hsieh, Pan, and Setiono (2004), described that " a successful brand image
enables consumers to identify the needs that the brand satisfies and to differentiate
the brand from its competitors, and consequently increases the likelihood that
consumers will purchase the brand" (p. 252). According to Park, Jaworski, &
MacInnis (1986), any company which products or services are having good/ positive
image among consumers in the market,
gaining competitive advantage. Reynolds (1965), stated that "an image is the mental
construct developed by the consumer on the basis of a few selected impressions
among the flood of the total impressions; it comes into
importance to brand image. According to Gwinner et al if a firm sponsors an event it
will give a big breakthrough to the brand image, and brand will get high level of
attention in a small time frame.
D. Repurchase Intention
Repurchase intention is defined by Hellier, Geursen, Carr, and Rickard in Chinomona and
Dubihlela (2014: 25) as the individual’s decision about repeatedly buying the
product/service from the same company, taking into account his/her current situation and
circumstances. First-time purchase is often used as a predictive measure of repurchase
behavior. The decision to repurchase represents the customer’s decision to engage in
continuous consumption of the product. Consumer buying behaviour can be understood in
two stages, thus encouraging people to purchase and enhancing them to repurchase (Zhang,
Fang, Wei, Ramsey, McCole and Chen in Chinomona and Dubihlela, 2014: 25).
According to Ferdinand in Saidani and Arifin (2012: 7) repurchase intention can be
identified through several indicators, as follows:
1.
Transactional interest
Is tendency of someone to always repurchase the product that has been
consumed.
2.
Referential interest
Is tendency of someone to reference the product that has been bought in order
to be purchased by the others, with reference to his or her personal experience.
3.
Preferential interest
Is the interest that depicts the behavior of someone which always has the main
preference on the product that has been consumed. This preference can only be
changed if something happens to its preference product.
4.
Explorative interest
This interest depicts the behavior of someone that always finds the information
regarding the product which is interesting for him or her and finding the information
to support the positive natures of the product.
E. Previous Research
Table 2.1
Previous Research Preview
Model
Variables
Variable
1
Elfa (2014)
Multiple
Regression
Repurchase
intention
marketing mix,
customer
satisfaction, and
trust
product, price,
promotion,
and customer
satisfaction
have partially
influence the
repurchase
intention.
While, all
independent
variables such
as product,
price,
promotion,
place,
customer
satisfaction,
and trust have
simultaneousl
y influenced
the
dependent
variable which
Analysis
intention
and customer
satisfaction
variables only
had significant
positive effect
on repurchase
intention
when through
satisfaction.
Satisfaction
was variable
with the most
influenced on
repurchase
intention.
Smartfren
needs to
develop a
marketing mix
to maintain
customer
satisfaction
and the
repurchase
from
customers.
3
Salman (2014)
Correlation
Technique
Repurchase
intention
customer
satisfaction
customer
satisfaction
had
simulatenousl
y influenced
consumer
loyalty. All
independent
variables had
partially
influenced
dependent
variable.
F.
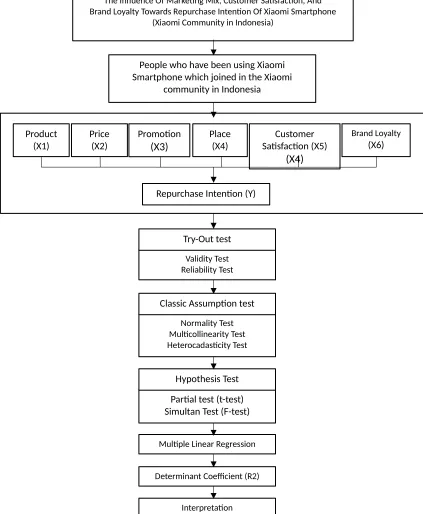
Theoretical Framework
The model of this research shows that product consists of several sub variables
such as (product variety, quality, design, features, brand name, packaging, size, services,
and warranties) and the sub variables of product were taken from (Kotler et al, 2009:
24). The sub variables of price consist of (list price, discount, and allowance) and every
variable was taken from (Kotler et al, 2009: 24). Promotion consists of several sub
variables such as (advertising, public relation, direct marketing, sales force, and sales
promotion) and those were taken from (Kotler et al, 2009: 24). Place consists of
(channels, location, and inventory) and the sub variables of place were also taken from
Kotler et al (2009: 24).
Brand loyalty Consist of several sub variables such as (Commitment, Trust, and
People who have been using Xiaomi
Smartphone which joined in the Xiaomi
community in Indonesia
Product
(X1)
Price
(X2)
Promotion
(X3)
Place
(X4)
Satisfaction (X5)
Customer
(X4)
Brand Loyalty
(X6)
Repurchase Intention (Y)
Validity Test Reliability Test
Try-Out test
Normality Test Multicollinearity Test Heterocadasticity Test
Classic Assumption test
The Influence Of Marketing Mix, Customer Satisfaction, And Brand Loyalty Towards Repurchase Intention Of Xiaomi Smartphone
(Xiaomi Community in Indonesia)
Partial test (t-test)
Simultan Test (F-test)
Hypothesis Test
Multiple Linear Regression
Determinant Coefficient (R2)
Interpretation