The relationship between system
usage and user satisfaction:
a meta-analysis
Rahat H. Bokhari
Pakistan Computer Bureau, Ministry of Information Technology,
Islamabad, Pakistan
Abstract
Purpose– System usage and user satisfaction are widely accepted and used as surrogate measures of IS success. Past studies attempted to explore the relationship between system usage and user satisfaction but findings are mixed, inconclusive and misleading. The main objective of this research is to better understand and explain the nature and strength of the relationship between system usage and user satisfaction by resolving the existing inconsistencies in the IS research and to validate this relationship empirically as defined in Delone and McLean’s IS success model.
Design/methodology/approach– “Meta-analysis” as a research approach was adopted because of its suitability regarding the nature of the research and its capability of dealing with exploring relationships that may be obscured in other approaches to synthesize research findings. Meta-analysis findings contributed towards better explaining the relationship between system usage and user satisfaction, the main objectives of this research.
Findings– This research examines critically the past findings and resolves the existing inconsistencies. The meta-analysis findings explain that there exists a significant positive relationship between “system usage” and “user satisfaction” (i.e.r¼0:2555) although not very strong. This research empirically validates this relationship that has already been proposed by Delone and McLean in their IS success model. Provides a guide for future research to explore the mediating variables that might affect the relationship between system usage and user satisfaction.
Originality/value– This research better explains the relationship between system usage and user satisfaction by resolving contradictory findings in the past research and contributes to the existing body of knowledge relating to IS success.
KeywordsInformation systems, Customer satisfaction
Paper typeResearch paper
1. Introduction
The information systems (IS) discipline is primarily concerned with the successful implementation of information technology (IT) in organizations. IS are an essential component of the solutions to many of the problems faced by organizations to cope with the current challenges. In this light, it can be argued that successful IS development can be identified by certain characteristics or metrics. An IS may thus be considered successful if it meets criteria such as fulfilling user needs and organisational objectives/goals (which are in themselves both multifaceted, and partial). At the same time, a variety of factors may affect systems during their development and implementation. As a result of these factors, the evaluation of a system in terms of its “success” is an inherently complex phenomenon.
Nevertheless, the measurement of IS success has achieved prime importance among researchers. Measures of success include assessment of satisfaction as reported by key personnel, and the evaluation of the capabilities of the constructed system, described in
The Emerald Research Register for this journal is available at The current issue and full text archive of this journal is available at
www.emeraldinsight.com/researchregister www.emeraldinsight.com/1741-0398.htm
System usage
and user
satisfaction
211
The Journal of Enterprise Information Management Vol. 18 No. 2, 2005 pp. 211-234
various terms such as system performance, effectiveness, quality, use and users’ satisfaction. For example, Miller (1989, p. 283) argues that an “effective information system is one that achieves the purposes of its users”. Garrity and Sanders (1998) define IS performance (i.e. success) in terms of its delivery on time and to budget, and the extent to which users are satisfied with it.
The tendency to define success in terms of user responses to the information systems is understandable, as users are an immediate, articulate, and often vocal provider of comments on the IS they use. As such, the most commonly used measures of IS success are “system usage” and “user satisfaction”, though it is rare that both are used simultaneously to evaluate the same system. However various studies have attempted to explore the relationship between system usage and user satisfaction but the findings about this relationship are mixed. Some studies show zero or negative correlation while others found a positive correlation between system usage and user satisfaction. As Mawhinney (1990 p. 954) notes:
. . .although these two variables [system usage and user satisfaction] have been widely used, researchers tend to use one or the other, but seldom use both. Little has been done to establish a relationship between these two variables.
Kim (1989) similarly argues for further research in this area, and this provides one of the motivations for the meta-analysis reported in this paper. However, I would argue that there is sufficient research in this area for a determination to be made, though the answer is not necessarily what we might expect.
This paper will first review research focused on the use of the concepts of user satisfaction, and system use in IS evaluation, before turning attention to the integration of existing research through meta-analysis. Using these meta-analytic techniques one should articulate a summary measure of the strength of the relationship between user satisfaction and system usage that consequently might be helpful to resolve the existing controversies within IS research. The author attempted to conclude with an analysis of the research findings and posit an alternative approach to the interpretation of such measures.
2. Measures of information system success
The prime purpose of introducing IS into an organisation is to improve not only individual decision-making performance but overall organisational efficiency and effectiveness. The expected gains in terms of organizational goals through IS implementation and adoption are concerned with the success of the system. While, as noted earlier, IS success is a multidimensional construct (see Delone and McLean, 1992; Saarinen, 1996), so surrogates measures have been developed and are usually in use to measure IS success. Two surrogate measures are system usage (Swanson, 1974; Ein-Doret al., 1984; Snitkin and King, 1986) and user satisfaction (Bailey and Pearson, 1983; Iveset al., 1983; Baroudi and Orlikowski, 1988).
Delone and Mclean (1992) described a number of IS success measures after reviewing 180 studies. According to them research has focused on areas such as:
. systems quality (i.e. IS interface, availability, response time, etc.);
. information quality (i.e. characteristics of information in terms of accuracy, timeliness, reliability, format and meaningfulness, etc.);
. system usage;
JEIM
18,2
. user satisfaction;
. individual impact; and
. organizational impact.
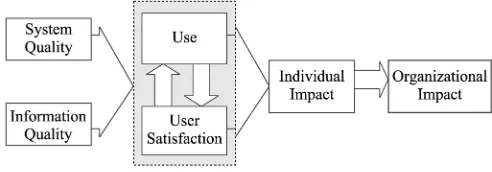
They draw on these to develop a model of IS success (see Figure 1). Their model emphasises the influences and inter-relationships between these various factors. Amoroso and Cheney (1991) also noted that system quality and information quality are two major constructs of user satisfaction. Delone and McLean’s (1992) model suggests that both system usage and user satisfaction are affected by these two factors.
Our study does not deal with how all of these factors may affect the dependents but focus on to explore and explain the relationship between system usage and user satisfaction. Delone and McLean’s (1992) model not only consolidated previous findings, but also classified the measures of success in to six plausible dimensions. However, the proposed relationships in their model were not tested empirically. Various other studies (see Delone and McLean, 2002) empirically investigated the relationship among the measures of IS success. Garrity and Sanders (1998) measures IS success at different levels – the organisational level (i.e. how a system contributes to organisational performance), the process level (i.e. efficient use of resources) and the individual level (i.e. the users’ perception of utility and satisfaction). Zmud (1979) advocated three factors related to users (i.e. system usage, user satisfaction and user performance) as measures of systems success.
Szajna (1993 p. 153) says:
While IS usage, user satisfaction, and perceptions of performance have all been employed as surrogate measures of information success, there are inconsistencies in their relationships.
Having identified the relevance and popularity of these surrogates of IS success, I shall now analyse each in detail before exploring the relationship between them.
2.1. System usage
In IS research, system usage may be defined as “either the amount of effort expended interacting with an information system or, less frequently, as the number of reports or other information products generated by the information system per unit time” (Trice and Treacy, 1988, p. 33). Delone and McLean (2002) suggest that the nature, quality, and appropriateness of the system use are also important and not just to simply measure time spent of system use. They consider system usage as the necessary condition under which IS/IT can affect organizational performance. Davis (1989, 1993)
Figure 1.
IS success model
System usage
and user
satisfaction
found perceived usefulness to be significantly correlated with system usage and that perceived usefulness positively affects user satisfaction (Mahmoodet al., 2000). Such research highlights the importance of system usage and user satisfaction in evaluating a system in terms of its success.
System usage is continuously considered as dependent variable in various empirical studies. A number of different system usage models have been proposed (Schewe, 1976; Robey, 1979; Lucas, 1975a). At the same time, a variety of measures have been developed and used to assess system usage in the IS field (see for example, Doll and Torkzadeh, 1998). The use of a system depends on the users’ evaluation of that system. If the system improves the users’ task performance or decision quality, then they tend to use the system otherwise they may avoid to use a system unless its use is mandatory. Delone and McLean (2002) believe that no system use is totally mandatory. It might happen that some time the management requires employees to use the system but continued and adoption of the system itself may be voluntary based on management judgement at higher level. On the other hand, Kim and Lee (1986) caution that the degree of system usage could not be considered as an appropriate measure for IS success if use is mandatory. For this reason, some researchers prefer to use “user satisfaction” as a measure of success. Previous research (Fuerst and Cheney, 1982; Igbaria, 1990; Yoon and Guimaraes, 1995; Hendrickson and Collins, 1996) highlights two common measures of system usage – time spent in term of hours and frequency of use.
Seddon and Kiew (1994) and Seddon (1997) criticized Delone and McLeans model and also raised model related issues. They suggest “usefulness” as more meaningful as compared to “system use” as an indicator of IS success that may lead to user satisfaction. The usefulness of the system in terms of benefits that an organization may gain should be observed on its use of course. Delone and McLeans (2003) argue that systems use is an appropriate measure of IS success in most cases in previous research, so the inclusion of system use in success model is more appropriate than system usefulness suggested by Seddon. This article does not deal with model issues raised by Seddon and Kiew (1994) but focus specifically on the inter-relationship between system usage and user satisfaction (IS success dimensions mentioned in Delone and McLean’s model).
In the previous research, different factors are studied that may influence system usage (see Liang, 1986; Trice and Treacy, 1988, Mahmood and Swanberg, 2001). Among these factors are user attitude (Lucas, 1975a, b; Robey, 1979; Kaiser and Srinivasan, 1980), user expectations (Ginzberg, 1981), user involvement (Schewe, 1976; Ives and Olson, 1984; Yoon and Guimaraes, 1995), user experience (Igbariaet al., 1989; Yapet al., 1994; Loh and Ong, 1998) and user satisfaction (Baroudiet al., 1986; Joshi, 1992). One of the key challenges emerging from this review of past research is the diversity of inter-related terms and concepts that are employed.
2.2. User satisfaction
The measurement of users’ satisfaction with IS remains of prime concern to researchers. User satisfaction measures are categorized in terms of three perspectives such as:
(1) user attitudes towards IS;
(2) user satisfaction in terms of information quality; and
(3) user satisfaction in terms of perceived IS effectiveness (see Kim, 1989).
JEIM
18,2
The concept of user satisfaction can be traced back to several decades (e.g. Swanson, 1974; Nolan and Seward, 1974). According to Bailey and Pearson (1983, p. 531) “satisfaction in a given situation is the sum of one’s feelings and attitudes toward a variety of factors affecting the situation”. As with system usage, a variety of measures have been proposed for the quantification and assessment of user satisfaction (for example Bailey and Pearson, 1983; Doll and Torkzadeh, 1988; Baroudi and Orlikowski, 1988). Iveset al.(1983) identify staff and service, information product, vendor support, and knowledge and involvement as factors that underlie user satisfaction. They considered user satisfaction as “the extent to which users believe the information system available to them meets their information requirements” (Ives et al., 1983, p. 785). This definition suggests that users perceive the system irrespective of its technical quality, and relates to the fulfilment of user needs by an IS. Kim (1989) describes user satisfaction in terms of information quality, system effectiveness and user attitudes. Doll and Torkzadeh (1988, 1989) considered user satisfaction in term of system quality (i.e. system accuracy, ease of use) and information quality.
Delone and Mclean (1992) included about 33 articles that address the subject of user satisfaction in their research. They conclude that user satisfaction is widely used as a measure of IS success because reliable instruments have been developed to measure satisfaction, and other measures of IS success are problematic. However, while user satisfaction has been widely used as a surrogate for systems performance and IS success, critics have questioned its general applicability (see, for example, Galletta and Lederer 1989). Some also suggests for further studies for a reliable measurement of user satisfaction (McGillet al., 2000).
3. Systems use and user satisfaction
Research regarding a relationship between systems use and user satisfaction are mixed and inconclusive. Some researchers argue that system usage leads to user satisfaction – others that user satisfaction leads to system usage. Mawhinney (1990) says that there is a lack of sufficient research effort to establish a conclusive relationship between these two constructs. Insufficient research is in some ways an easy answer, offering the opportunity for researchers to continue in well-established patterns of work until “good results” emerge. In this section I explore and statistically analyse the existing corpus of research in the area. Consequently (and for the most part, implicitly), I therefore argue that there is already sufficient research in this field to determine the existence or otherwise of such a relationship (between systems use and user satisfaction), but the answer is not necessarily what we might expect.
3.1 Alternative perspectives
The literature can be organised into three dominant perspectives – those that explore how usage impacts satisfaction; those that explore how satisfaction impacts usage; and finally, those that seek to uncover any relationship between the two. In this section I review each perspective in order to demonstrate the range of opinion, and to provide the basis for the statistical analysis in the following section.
Usage effects satisfaction.According to Delone and McLean (1992 p. 83):
. . . the amount of USE can affect the degree of USER SATISFACTION – positively or negatively – as well as the reverse being true.
System usage
and user
satisfaction
Delone (1988) noted that duration of computer use is not associated with system success. Conrath and Mignen (1990, p. 9) question the axiomatic assumption that “positive attitudes leads to increased usage”, arguing that it is not clear-cut. Their research concludes that usage has more impact on satisfaction than vice versa and both are positively related. Conversely, Udo (1992) argued that the more a system is used, the less it is found to be effective, and that this may in turn reduce user satisfaction. Jenkins and Ricketts (1985, p. 1) state that [M]IS has no effect on decision making unless it is used, so satisfaction that results from the use of an MIS correlates with the quality of current decisions and the likelihood of future use.
Using path analysis, Lee et al. (1995) claim that system utilization leads to user satisfaction and both factors are positively related. Also using path analysis, Torkzadeh and Dwyer (1994, p. 345) found that the effect of system usage on satisfaction was slightly greater than the reverse.
Satisfaction effects usage.On the other hand, Evans (1976, cited in Thong and Yap, 1996) discusses a lower bound to satisfaction below which users may discontinue system use, which gives some direct insight into how user satisfaction influences system usage. Using path analysis, Baroudiet al.(1986) argued that user information satisfaction (UIS) could lead to system usage rather than vice versa (interpreting UIS as an attitude). Their model assumes that as a system’s use fulfils user needs, user satisfaction with the system should increase and lead to greater use. Conversely, if system usage does not meet user needs, satisfaction will decrease and restrict further use. Lucas (1975b) argued that the use of IS is dependent on user attitudes and perceptions and that both may be influenced by the quality of the system. Positive user attitudes were consistent with high level of system usage. Joshi (1992, p. 77) argues that user attitudes (as measures of user satisfaction) may influence behaviour, and that positive user satisfaction may help in obtaining acceptance and usage of IS. Schewe (1976) found no significant relationship between attitudes and system usage behaviour. He wrote:
Batch and interactive system user’s behaviour toward the information system does not appear to be influenced by their feelings of satisfaction with the use of the system (Schewe (1976, pp. 588, 589).
Bikson and Gutek (1983) also found no relationship between level of usage and level of satisfaction with new technology.
Does a causal relationship exist?As I have indicated in the sections above, some research has suggested a causal link between system usage and user satisfaction in both directions. There exists, however, a considerable body of evidence surrounding these central foci that elicit a variety of opinion.
Research findings (Lucas, 1975b; Robey, 1979) provide evidence that heavily used systems are positively correlated to user satisfaction. In stark contrast, Schewe (1976) found no significant relationship between system use and user satisfaction, and Lawrence and Low (1993) did not find this relationship to be significant. Similarly, Mawhinney (1990) found no relationship between user satisfaction and system use, and Srinivasan (1985) notes that the relationship is not always positive. Udo (1992) reviewed studies/laboratory experiments that measured systems effectiveness in terms of user satisfaction and system usage. He concluded that the respondents who frequently used the system perceived it less effective in terms of increased productivity and cost efficiency.
JEIM
18,2
Other interpretations of the relationship exist. Cheney and Dickson (1982, p. 175) argue that system “utilization does not necessarily mean that the users are satisfied, the [as] system may be all they have and it’s better than nothing”. Some argue that dissatisfied users may discontinue system usage and seek alternatives (Ginzberg, 1981; Sauer, 1993; Szajna and Scamell, 1993).
Some researchers have argued that system usage and user satisfaction are actually negatively correlated (Ang and Soh, 1997; Mawhinney, 1990; Mawhinney and Lederer, 1990), while (Liang, 1986; Udo and Guimaraes, 1994; Loh and Ong, 1998) showed a very weak relationship. Others (Yoon and Guimaraes, 1995; Choe, 1998; Kivijarvi and Zmud, 1993) found a positive correlation between system usage and user satisfaction.
Researchers also mention a relationship between user attitude and system usage. Such findings are similarly mixed. For example, Schewe (1976) found no significant relationship between attitude and system usage whereas Lucas (1975b) says that a favourable user attitude leads to a high use level. Al-Khaldi and Al-Jabri (1998) note that attitudes towards computers are significant determinants of behaviour and that they may influence computer use.
In conclusion, the findings about a system usage and user satisfaction interrelationship are mixed and inconclusive, with proponents on each side drawing empirical evidence in support of their argument. Such uncertainty, coupled with the weight of conventional wisdom, has led to an uneasy position in analysis of the interaction between user satisfaction and system usage.
In the following section, I describe my work to consolidate and draw insights from the large body of literature in this area. Drawing on research methods developed in the social sciences, I undertake a “meta-analysis” of these various studies, using the techniques to distil conclusions drawn from the large sample population, from which I draw implications and conclusions later in this paper.
4. Research approach
The process of research builds on the efforts of those who worked before. The overall social process involved in formalised academic publishing works to minimise the chance that researchers may repeat the past mistakes of others by drawing on a community, rather than isolated model of work. Thus, inquiry into the existing research in a specific domain allows the construction of a comprehensive picture of the research. Research synthesis can therefore play an important part in the process of theory building and testing (Forza and Nuzzo, 1998). In recent years, meta-analysis (i.e. quantitative research synthesis) has been gaining acceptance in IS research (for example Montazemi and Wang, 1988-1989; Alavi and Joachimsthaler, 1992; Hwang and Thorn, 1999; Liu, 2004). Previously, it has been widely used in fields such as education, psychology, and public policy. Meta-analysis offers a set of tools for extracting and analysing quantitative information from pre-existing, related research. It is underpinned by several decades of theoretical development and practical experience, which provides a strong basis for its use in IS research, as I demonstrate later in this paper.
4.1 Meta-analysis
Conflicting interpretations of results on the same subject in a specific domain are not uncommon. Without some form of consolidation this can lead to unending calls for
System usage
and user
satisfaction
further research. Meta-analysis may be used to review such research to aid the comprehension and interpretation of diverse research findings. It provides a procedure for combining relevant information gathered from separate studies designed to answer essentially the same research question. This technique has been successfully applied in the physical as well as the social sciences (Hunter and Schmidt, 1990), general management (Schwenk, 1990), and Information Systems (Gelderman, 1997; Hwang and Thorn, 1999; Mahmood et al., 2000). Meta-analysis of previous research not only reveals the cumulative knowledge embedded within the research corpus, but also provides clear direction about future research needs by answering the original question based on many studies rather than just one (Glasset al., 1981).
The term “meta-analysis” was first coined and applied by Glass (1976), though it is also referred to as “research integration” (Walberg and Haertel, 1980 cited in Green and Hall, 1984):
Meta-analysis refer to the analysis of analyses. . .the statistical analysis of a large collection of analysis results from individual studies for the purpose of integrating the findings (Glass, 1976, p. 3; Wolf 1986, p. 11).
Similarly, Hwang and Wu (1990) state that it allows one to analyse quantitatively large numbers of studies and to resolve differences that exist due to conflicting and contradictory research findings. It can be used to examine differences across studies, integrate previous research and test any possible relationship between variables of interest.
Meta-analysis may therefore be considered a means to review the results of previous research in a domain in quantitative terms with the intent of identifying significant relationships that exists between the variables under study. Thus, by synthesizing findings from many studies succinctly, meta-analysis can help researchers uncover consistencies in a set of seemingly inconsistent findings and to arrive at deeper insights into the problem domain (Durlak, 1995; Hunt, 1997).
Most researchers believe that the goal of cumulative research is to produce better answers than that which can be obtained in isolated studies. The growing trend of the use of meta-analysis in research has been encouraged and argued (Hunt, 1997; Lyons, 1998). It could be argued that traditional research reviews have been unable to provide definite answers in many circumstances, and meta-analysis has been successfully employed in the fields of medicine, education and psychology (Hunt, 1997). MIS researchers have also been using it to integrate previous research findings (Pettingell et al., 1988; Pervan, 1994; Gelderman, 1997). The specific techniques of meta-analysis may vary, but their underlying aim is constant – to derive a quantitative measure (effect size) of the relationship under study. Further support for the process may be found in, for example, Hunter and Schmidt (1990), who argue that better and valid inferences can be drawn by meta-analysis as compared to other traditional reviews. In summary, meta-analysis is:
. . .rooted in the fundamental values of the scientific enterprise: replicability, quantification, causal and correlational analysis. Valuable information is needlessly scattered in individual studies. The ability of social scientists to deliver generalizable answers to basic questions of policy is too serious a concern to allow us to treat research integration lightly. The potential benefits of meta-analysis seem enormous (Bangert-Drowns 1986).
JEIM
18,2
4.2. Literature selection
The literature was searched in libraries manually and through available academic databases on computers. It encompasses major journals, conference proceedings, books and dissertations. Various papers were studied but those included are a best fit with the research question under study. The studies fall within the period of 1979 to 2000. The studies reporting empirical findings testing relationship between system usage and user satisfaction in terms of correlation “r”, or other statistics (such asF, t, d, r, orx2) those
can be converted to correlations, along with sample size are selected. Details of journal/conference proceedings and the number of studies selected are shown in Table I.
5. Data collection and analysis
The data collected from individual studies were aggregated and analysed statistically to reach informed conclusions. It is natural that different studies may report their findings using different statistics (i.e. correlations), so the results cannot be compared until those have been converted into some common metric to be useful to conduct meta-analysis. The well-known statistic measure Pearson Correlation (Pearson’s “r”) is used as an index of “Effect size” that represents the strength of relationship between system usage and user satisfaction. The reason for selecting “r” as an effect size is due to:
. availability of formulae to convert other test statistics into “r”; and
. interpretation is easy (Lipsey and Wilson, 2001).
Journal/proceedings Number of studies
Decision Support Systems 1
The Computer Journal 1
Communications of the ACM 1
Computers in Industry 1
Computers in Human Behavior 1
Journal of Marketing Research 1
Journal of Information Technology 1
Information Processing & Management 1
Public Opinion Quarterly 1
Australian Journal of Information Systems 1
Systems, Objectives, Solutions 1
Proceedings Australasian Conference on Information Systems 1
Proceedings Annual Meeting of Decision Sciences Institute 1
Behaviour & Information Technology 1
Data Base 1
Information Resources Management Journal 2
European Journal of Information Systems 2
Proceedings International Conference on Information Systems 2
Unpublished PhD dissertation 2
Journal of End User Computing 3
Academy of Management Journal 3
Journal of Management Information Systems 4
Omega 4
MIS Quarterly 5
Information & Management 13
Total 55
Table I.
Study sources
System usage
and user
satisfaction
The value of “r” is either obtained from the publication directly or converted from other reported statistics (such asF, t, d, orx2) to “r” using standard formulas (Wolf, 1986;
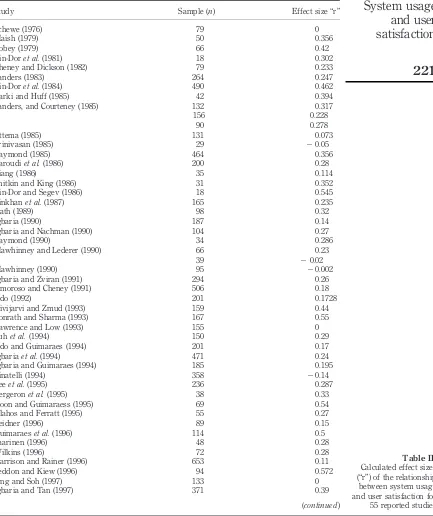
Lyons, 1998). The findings from 55 empirical studies included 58 effect sizes that were included for meta-analysis (Table II). An effect size was calculated for each study used in the analysis, so that the correlation between system usage and users’ satisfaction could be determined. In some studies (Sanders and Courtney, 1985; Mawhinney and Lederer, 1990) more than one effect size value was available and subsequently included. Most of the studies considered the system usage construct as behaviour and user satisfaction as attitude. Details of the data and calculated effect sizes are presented in Table II.
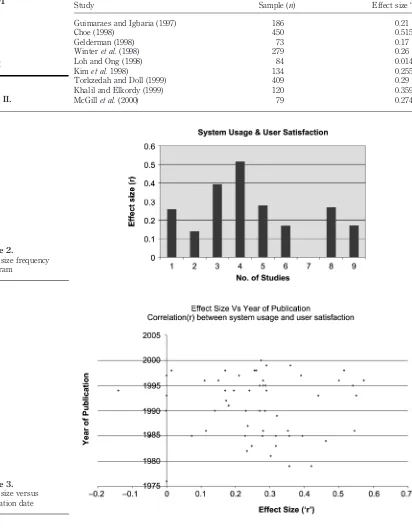
Initial analysis of these results is presented in Figure 2. Figure 2 illustrates the spread of effect sizes across each of the studies, showing again quite a range of results. Coupled with the scatter diagram (Figure 3) showing the distribution of effect sizes against year of publication there seems little evidence of a clear-cut relationship, nor of the ongoing research leading towards a more coherent body of research.
This initial analysis showed a considerable divergence of effect size, and did not suggest that the process of research had led to a consensual position being achieved. I therefore continued the analysis, and analyse the parameters of the study in order to frame the results appropriately.
5.1 Combinations of effect sizes
Correlations provide a sound basis for handling effect sizes as they not only describe the strength of the relationship between two variables but also the direction (i.e. positive or negative association). The values of effect size collected from the studies included in this research are given in Table II. Pearson’s correlation “r” was used as the effect size and its value falls within the rage of 21.0 to þ1.0. However, since the sample sizes (N) for the studies vary considerably, the weighted average of the correlations was used as a more appropriate estimate (see Hunter and Schmidt 1990). We therefore took the sample size of the study as its weight for further analysis, and using standard formulae (see Hunter and Schmidt, 1990) estimated the population correlation, observed variance and the error due to sampling as follows.
Estimate of population correlation (i.e., Mean)
r¼X½Niri=XNi ð1Þ
where:
r ¼weighted average estimate of the population correlation.
ri ¼observed correlation for sample i.
Ni ¼number of individuals in sample i. P
Ni ¼sum of all individuals in all samples included in this study.
The mean correlation between system usage and users’ satisfaction in our study was found to be 0.2555. Lipsey and Wilson (2001, p. 147) interpreted magnitude of effect size “r” as small when “r#0:10”, medium when “r¼0:25”, and finally large when “r$0:40”. So research findings lead to the conclusion that system usage and user
JEIM
18,2
Study Sample (n) Effect size “r”
Schewe (1976) 79 0
Maish (1979) 50 0.356
Robey (1979) 66 0.42
Ein-Doret al.(1981) 18 0.302
Cheney and Dickson (1982) 79 0.233
Sanders (1983) 264 0.247
Ein-Doret al.(1984) 490 0.462
Barki and Huff (1985) 42 0.394
Sanders, and Courteney (1985) 132 156 90
0.317 0.228 0.278
Ettema (1985) 131 0.073
Srinivasan (1985) 29 20.05
Raymond (1985) 464 0.356
Baroudiet al.(1986) 200 0.28
Liang (1986) 35 0.114
Snitkin and King (1986) 31 0.352
Ein-Dor and Segev (1986) 18 0.545
Zinkhanet al.(1987) 165 0.235
Nath (1989) 98 0.32
Igbaria (1990) 187 0.14
Igbaria and Nachman (1990) 104 0.27
Raymond (1990) 34 0.286
Mawhinney and Lederer (1990) 66 39
0.23
20.02
Mawhinney (1990) 95 20.002
Igbaria and Zviran (1991) 294 0.26
Amoroso and Cheney (1991) 506 0.18
Udo (1992) 201 0.1728
Kivijarvi and Zmud (1993) 159 0.44
Conrath and Sharma (1993) 167 0.55
Lawrence and Low (1993) 155 0
Suhet al.(1994) 150 0.29
Udo and Guimaraes (1994) 201 0.17
Igbariaet al.(1994) 471 0.24
Igbaria and Guimaraes (1994) 185 0.195
Zinatelli (1994) 358 20.14
Leeet al.(1995) 236 0.287
Bergeronet al.(1995) 38 0.33
Yoon and Guimaraess (1995) 69 0.54
Vlahos and Ferratt (1995) 55 0.27
Leidner (1996) 89 0.15
Guimaraeset al.(1996) 114 0.5
Saarinen (1996) 48 0.28
Wilkins (1996) 72 0.28
Harrison and Rainer (1996) 653 0.11
Seddon and Kiew (1996) 94 0.572
Ang and Soh (1997) 133 0
Igbaria and Tan (1997) 371 0.39
(continued)
Table II.
Calculated effect sizes (“r”) of the relationship between system usage and user satisfaction for 55 reported studies
System usage
and user
satisfaction
Study Sample (n) Effect size “r”
Guimaraes and Igbaria (1997) 186 0.21
Choe (1998) 450 0.515
Gelderman (1998) 73 0.17
Winteret al.(1998) 279 0.26
Loh and Ong (1998) 84 0.014
Kimet al.1998) 134 0.255
Torkzedah and Doll (1999) 409 0.29
Khalil and Elkordy (1999) 120 0.359
McGillet al.(2000) 79 0.274
Table II.
Figure 2.
Effect size frequency histogram
Figure 3.
Effect size versus publication date
JEIM
18,2
satisfaction are positively correlated. However, the strength of the relationship is rather medium.
The observed variance is calculated using the weighted sum of squares formula to obtain an estimate of true variance (Formula 2).
Sample weighted variance (observed variance)
s2 r ¼ ð
X
Niðri2rÞ2Þ= X
Ni ð2Þ
where:
s2r¼ frequency weighted average square. Others terms are explained earlier. The sampling error is function of sample size. Estimate error due to sampling is:
s2e ¼ ðð12r2Þ2KÞ=XNi ð3Þ
where:
s2e ¼estimate of sampling error.
K ¼the number of results included in the analysis. Others terms as above.
The residual variance can be calculated by subtracting estimates of the variance due to sampling error from observed variance. The “residual variance” is the variance that is due to the true differences among results from different studies.
Residual variance¼S2r2s2e ð4Þ
In this study, I calculated estimates of the variance due to sampling error (Formula 3) and then subtract it from the observed variance, giving a residual variance (Formula 4). If the residual variance is sufficiently small then the difference between correlations can be considered to be sampling errors (Hunter and Schmidt, 1990). For this study, the residual variance was 0.01931. Tempering this result however, was the residual standard deviation, which is greater than 25 per cent of mean effect size (i.e. r¼0:2555). As residual standard deviation exceeded the 25 per cent of effect size, the residual variance could not be considered as small (see Stoffelmayret al., 1983).
This suggested that the differences between the correlations may have been due to artefacts other than sampling error, a point I return to in the later discussion section (Section 6). Different study artefacts can alter the size of the study correlation (Hunter and Schmidt, 1990). Trotman and Wood (1991) suggest testing for a moderator effect – in this case.
5.2 Fail safe N
It is unlikely that one can uncover every study concerned with the hypothesis under research. For example, it may be assumed that a number of studies with non-significant effect size are either rejected or not submitted for publication. The unpublished studies are also difficult to find as compared to published ones. Lipsey and Wilson (1993) show that on average unpublished studies have smaller mean effect size than published studies, so provide an evidence of publication bias. Smith (1980 p. 22) stated that published literature only represents 5 per cent of false positives in a population of studies supporting null hypothesis. According to Rosenthal (1979), the
System usage
and user
satisfaction
studies supporting the null hypothesis of no significant results are more likely to be buried away in file drawers.
In this way, a biased conclusion may be obtained from a meta-analysis that includes the effects of a strong bias toward publishing positive results, a point identified by Kraemer and Andrews (1982, p. 405) and Wolf (1986, p. 37). Hedges and Olkin (1985) and Rosenthal (1979) suggested finding the number of studies confirming the null hypothesis that would be needed to reverse a conclusion that a significant relationship exists. Cooper (1979) called it “Fail safe N (Nfs)”. The formula proposed by Hunter and Schmidt (1990) is used (Formula 5 below) to estimate the number of “lost” studies that must exist to bring rkto rc(where rkis the mean effect size r for k studies, rcthe critical mean effect size r that may be considered theoretically or practically significant):
x¼kðrk=rc21Þ ð5Þ
where:
K is the number of studies included in meta-analysis
x denotes the number of studies required to bring rkto rc.
The Fail safe N reports the number of unpublished studies having null results that may reduce the cumulated effect across studies to the point of non-significance (Lipsey and Wilson, 2001). Fail safe N calculated taking rc ¼0:05, and 0.1 for this research follows:
. Fail Safe N for critical r of 0.05¼238;
. Fail Safe N for critical r of 0.1¼90.
If any question is raised that observed results may be biased due to sampling then one may conclude that to reverse the conclusion (i.e. there exists a positive relationship between system usage and user satisfaction) drawn from this research would require 238 studies when rcis 0.05, or 90 studies when rc ¼0:1 mentioning “no correlation” between system usage and user satisfaction to be included in the sample. A careful sampling and thorough search may be the best to avoid a publication bias.
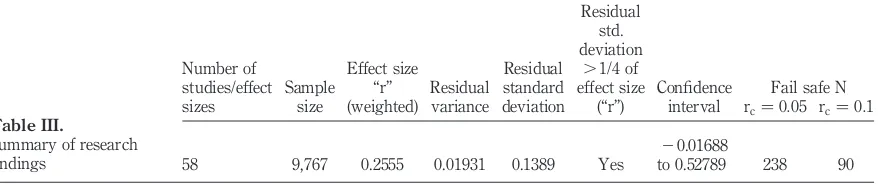
The research findings are summarized as shown in Table III.
6. Discussion
The main objective of this research is to better understand the strength and nature of relationship between system usage and user satisfaction by resolving the existing controversies in the past research. The direct measure of IS success is difficult if not possible (Galletta and Lederer, 1989), so the system usage and user satisfaction are
Fail safe N Number of
studies/effect sizes
Sample size
Effect size “r” (weighted)
Residual variance
Residual standard deviation
Residual std. deviation
.1/4 of effect size
(“r”)
Confidence
interval rc¼0:05 rc¼0:1
58 9,767 0.2555 0.01931 0.1389 Yes 2 0.01688
to 0.52789 238 90
Table III.
Summary of research findings
JEIM
18,2
commonly used as a surrogate measure of IS success despite criticism relating to their inconsistent theoretical definitions, lack of validation of instruments developed for their measurements leading to measurement issues (Goodhue, 1986; Kimet al., 1998). Such problems may be one of the causes for variations among the IS researchers’ findings about the phenomena (see Melone, 1990; Wilkinet al., 1999). Despite ample individual studies dealing with system use and user satisfaction, the findings about their relationship are inconclusive. A comprehensive understanding and knowledge may lead to some substantial conclusions. In order to resolve such inconsistencies/disparities among the studies “meta analysis” is used. Meta-analysis can help in integrating/cumulating the past research findings and to reach some substantive conclusion by resolving the existing conflicts/inconsistencies.
In this research, the meta-analysis of 55 studies (comprising 58 effect sizes) revealed a clearer view about the relationship between “system usage and user satisfaction”, the factors under study. This research found a positive correlation (effect size r¼0:2555) between system usage and user satisfaction, although not very strong but “medium” in its nature, perhaps sufficient to perpetuate the tantalizing search for a relationship between such clear-cut metrics. The meta-analysis results significantly contribute towards the knowledge and practice guidelines. Further, the results show that the residual standard deviation (i.e. 0.1389) exceeds the 25 per cent of effect size (r¼0:2555). So residual variance could not be considered as “small”. It leads to the conclusion that the differences among findings of past studies might be due to artefacts other than sampling error. It provides a direction for future research to find the moderators that might affect this relationship.
It has been suspected that published studies are biased towards showing statistically significant findings as compared to unpublished ones. Research studies with negative or null findings have hardly been published and are more difficult to find as compared to published studies. Someone may raise a question that observed results may be biased due to sampling if unpublished studies are missing in meta-analysis. To reduce such bias there is need for thorough search. The other way one may calculate F-safe N as discussed in section 5.2. The calculated “fail-safe N” for this study concludes that to reverse the conclusion drawn from this research (i.e. there exists a positive relationship between system usage and user satisfaction) would require 238 studies when rcis 0.05, or 90 studies when rc¼0:1 mentioning “no correlation between system usage and user satisfaction” to be included in the sample.
7. Conclusions
IS evaluation in terms of success metrics is widely held to be important in the assessment of whether the system meets the organizational objectives or not. The “system use” and “user satisfaction” as a metric of success has long been an elevated perspective, though, of course, systems are developed for many more reasons than happy users. Both of the measures (system use and user satisfaction) are well accepted and mostly used as surrogate measures of IS success. Researchers have made efforts to uncover a relationship that may exist between these two measures but the previous research has failed to reach an agreement about the nature and strength of its relationship. Both theoretical and methodological considerations have been offered as possible causes of these inconsistent findings.
System usage
and user
satisfaction
The primary objective of this research was to explain and provide empirical evidence about the relationship between system usage and user satisfaction keeping in view controversial findings in the past research. Although the relationship between system use and user satisfaction was proposed in Delone and McLeans IS success model but it was not validated empirically. The primary findings show that there is little evidence, taken across a large body of research, that there exists a strong relationship between system usage and user satisfaction but inconsistent results might create confusion about whether there exists a relationship. The findings of meta-analysis lead to the conclusion that there exists a “medium” and significant positive relationship between system usage and user satisfaction (i.e. r¼0:2555). The results of meta-analysis not only validate empirically the relationship between system use and user satisfaction as proposed in Delone and McLean’s IS success model but also contribute towards solving the existing controversies in the past research. The outcome of this research is very informative, though not necessarily as expected a priori. This is fascinating for many reasons, not least because it challenges “accepted wisdom” in many organisations today.
More specifically, while the identification of uni-dimensional metrics of success, satisfaction, etc., leads to well-formed research programmes, the widespread application but limited cohesive success of such covariant studies would perhaps be better addressed through a wider-ranging analysis using a portfolio of metrics taken together. Such an approach may well provide a richer, more relevant insight into this area of research, and forms part of the authors’ wider research agenda. As mentioned before, a direction for future research would be to explore moderator variables that may affect the magnitude of the relationship between system usage and user satisfaction. Further, the research would also be repeated by including more studies (i.e. after 2000) in meta-analysis and to compare the results with this study. Such efforts may further enhance the understanding of the nature of relationship and strengthen the existing research.
Different views such as “either system usage leads to user satisfaction or user satisfaction leads to system usage” exist in the past research. It may be argued that whilst system usage may lead to user satisfaction and user satisfaction may encourage users to engage in more and further use of the system, the evidence over decades of research suggests that such a clear-cut relationship does not exist. User satisfaction may act as positive feedback that adds towards greater use of the system. System use may act as evidence of system satisfaction, in certain circumstances. So a relationship may exist in both directions, but it seems far more productive, and more likely to derive strong research results, to consider such metrics within a multiple, or portfolio approach to this area of research.
References
Alavi, M. and Joachimsthaler, E.A. (1992), “Revisiting DSS implementation research: a meta-analysis of the literature and suggestions for researchers”,MIS Quarterly, Vol. 16 No. 1, pp. 95-116.
Al-Khaldi, M. and Al-Jabri, I. (1998), “The relationship of attitudes to computer utilization: new evidence from a developing nation”,Computers in Human Behavior, Vol. 14 No. 1, pp. 23-42.
JEIM
18,2
Amoroso, D.L. and Cheney, P.H. (1991), “Testing a casual model of end-user application effectiveness”,Journal of Management Information Systems, Vol. 8 No. 1, pp. 63-89. Ang, J. and Soh, P.H. (1997), “User information satisfaction, job satisfaction and computer
background: an exploratory study”,Information & Management, Vol. 32, pp. 255-66. Bailey, J.E. and Pearson, S.W. (1983), “Development of a tool for measuring and analysing
computer user satisfaction”,Management Science, Vol. 29 No. 5, pp. 530-45.
Bangert-Drowns, R.L. (1986), “Review of development in meta-analytic method”,Psychological Bulletin, Vol. 99 No. 3, pp. 388-99.
Barki, H. and Huff, S.L. (1985), “Change, attitude to change, and decision support systems success”,Information & Management, Vol. 9, pp. 261-8.
Baroudi, J.J. and Orlikowski, W.J. (1988), “A short-form measure of user information satisfaction: a psychometric evaluation and notes on use”, Journal of Management Information Systems, Vol. 4 No. 4, pp. 44-59.
Baroudi, J.J., Olson, M.H. and Ives, B. (1986), “An empirical study of the impact of user involvement on system usage and information satisfaction”,Communications of the ACM, Vol. 29 No. 3, pp. 232-8.
Bergeron, F., Raymond, L., Rivard, S. and Gara, M. (1995), “Determinants of EIS use: testing a behavioral model”,Decision Support Systems, Vol. 14, pp. 131-46.
Bikson, T.K. and Gutek, B.A. (1983), “Advanced office systems: an empirical look at use and satisfaction”,Proceedings National Computer Conference, Arlington, VA, pp. 319-28. Cheney, P.H. and Dickson, W. (1982), “Organizational characteristics and information systems:
an exploratory investigation”,Academy of Management Journal, Vol. 25 No. 1, pp. 170-84. Choe, J. (1998), “The effects of user participation on the design of accounting information
systems”,Information & Management, Vol. 34, pp. 185-98.
Conrath, D.W. and Mignen, O.P. (1990), “What is being done to measure user satisfaction with EDP/ MIS”,Information & Management, Vol. 19, pp. 7-19.
Conrath, D.W. and Sharma, R.S. (1993), “Evaluation measures for computer-based information systems”,Computers in Industry, Vol. 21, pp. 267-71.
Cooper, H.M. (1979), “Statistically combining independent studies: a meta-analysis of sex difference in conformity research”,Journal of Personality and Social Psychology, Vol. 37 No. 1, pp. 131-46.
Davis, F.D. (1989), “Perceived usefulness, perceived ease of use, and user acceptance of information technology”,MIS Quarterly, September, pp. 319-40.
Davis, F.D. (1993), “User acceptance of information technology: system characteristics, user perceptions and behavioral impacts”, International Journal of Man-Machine Studies, Vol. 38, pp. 475-87.
Delone, W.H. (1988), “Determinants of success for computer usage in small business”, MIS Quarterly, Vol. 12 No. 1, pp. 51-61.
Delone, W.H. and McLean, E.R. (1992), “Information systems success: the quest for the dependent variable”,Information Systems Research, Vol. 3 No. 1, pp. 60-95.
Delone, W.H. and McLean, E.R. (2002), “Information systems success revisited”,Proceedings of the 35th International Conference on System Sciences (HICSS-35’02), Hilton Waikoloa Village, Island of Hawaii, HI, IEEE Computer Society, 7-10 January.
Delone, W.H. and McLean, E.R. (2003), “The Delone and McLean model of information systems success: a ten-year update”,Journal of Management Information Systems, Vol. 19 No. 4, pp. 9-30.
System usage
and user
satisfaction
Doll, W.J. and Torkzadeh, G. (1988), “The measurement of end-user computing satisfaction”,MIS Quarterly, Vol. 12 No. 2, pp. 259-76.
Doll, W.J. and Torkzadeh, G. (1989), “A discrepancy model of end-user computing involvement”, Management Science, Vol. 35 No. 10, pp. 1151-70.
Doll, W. and Torkzadeh, G. (1998), “Developing a multidimensional measure of system-use in an organizational context”,Information & Management, Vol. 33, pp. 171-85.
Durlak, J.A. (1995), “Understanding meta-analysis”, in Grimm, L.G. and Yarnold, P.R. (Eds), Reading and Understanding Multivariate Statistics, American Psychological Association, Washington, DC, pp. 319-52.
Ein-Dor, P. and Segev, E. (1986), “Attitudes, association and success of MIS: some empirical results from research in the context of a business game”,The Computer Journal, Vol. 29 No. 3, pp. 212-21.
Ein-Dor, P., Segev, E. and Steinfeld, A. (1981), “Use of management information systems: an empirical study”, Proceedings of the 2nd International Conference on Information Systems, Cambridge, MA, December, pp. 215-27.
Ein-Dor, P., Segev, E., Blumenthal, D. and Millet, I. (1984), “Perceived importance, investment and success of MIS, or MIS the Zoo?”,Systems, Objectives, Solutions, Vol. 4, pp. 61-7. Ettema, J.S. (1985), “Explaining information system use with systems-monitored vs self-reported
use measure”,The Public Opinion Quarterly, Vol. 49 No. 3, pp. 381-7.
Forza, C. and Nuzzo, D.I. (1998), “Meta-analysis applied to operations management: summarizing the results of empirical research”,International Journal of Production Research, Vol. 36 No. 3, pp. 575-601.
Fuerst, W. and Cheney, P. (1982), “Factors affecting the perceived utilization of computer-based decision support systems in the oil industry”,Decision Sciences, Vol. 13 No. 4, pp. 554-69. Galletta, D.F. and Lederer, A.L. (1989), “Some cautions on the measurement of user information
satisfaction”,Decision Sciences, Vol. 20, pp. 419-38.
Garrity, E.J. and Sanders, G.L. (1998), “Introduction to information systems success measurement”, in Garrity, E.J. and Sanders, G.L. (Eds), Information Systems Success Measurement, Idea Group Publishing, London, pp. 1-12.
Gelderman, M. (1997), “Success of management support systems: a literature review and empirical investigation”, unpublished PhD dissertation, Vrije Universiteit Amsterdam, Tinbergen Institute Research Series, Thesis Publishers, Amsterdam.
Gelderman, M. (1998), “The relationship between user satisfaction, usage of information systems and performance”,Information & Management, Vol. 34, pp. 11-18.
Ginzberg, M.J. (1981), “Early diagnosis of MIS implementation failure: promising results and unanswered questions”,Management Science, Vol. 27 No. 4, pp. 459-69.
Glass, G.V. (1976), “Primary, secondary, and meta-analysis of research”,Educational Researcher, Vol. 5 No. 10, pp. 3-9.
Glass, G.V., McGraw, B. and Smith, M.L. (1981), Meta-Analysis in Social Research, Sage Publications, Beverly Hills, CA.
Goodhue, D. (1986), “IS attitudes: towards theoretical and definition clarity”,Proceedings of the 7th International Conference on Information Systems, San Diego, CA, pp. 181-94. Green, B.F. and Hall, J.A. (1984), “Quantitative methods for literature reviews”,Annual Reviews
Psychology, Vol. 35, pp. 37-53.
Guimaraes, T. and Igbaria, M. (1997), “Assessing user computing effectiveness: an integrating model”,Journal of End User Computing, Vol. 9 No. 2, pp. 3-14.
JEIM
18,2
Guimaraes, T., Yoon, Y. and Clevenson, A. (1996), “Factors important to expert systems success: a field study”,Information & Management, Vol. 30, pp. 119-30.
Harrison, A.W. and Rainer, R.K. (1996), “A general measure of user computing satisfaction”, Computers in Human Behavior, Vol. 12 No. 1, pp. 79-92.
Hedges, L.V. and Olkin, I. (1985),Statistical Methods for Meta-Analysis, Academic Press, London, OR.
Hendrickson, A.R. and Collins, M.R. (1996), “An assessment of structure and causation of IS usage”,The Database for Advance in Information Systems, Vol. 27 No. 2, pp. 61-7. Hunt, M. (1997),How Science Takes Stock: The Story of Meta-Analysis, Russell Sage Foundation,
New York, NY.
Hunter, J.E. and Schmidt, F.L. (1990),Methods of Meta-Analysis: Correcting Error and Bias in Research Findings, Sage Publications, Beverly Hills, CA.
Hwang, M.I. and Thorn, R.G. (1999), “The effect of user engagement on system success: a meta-analytical integration of research findings”,Information & Management, Vol. 35, pp. 229-36.
Hwang, M.I. and Wu, B.J.P. (1990), “The effectiveness of computer graphics for decision support: a meta-analytical integration of research findings”,Data Base, Fall, pp. 11-20.
Igbaria, M. (1990), “End-user computing effectiveness: a structural equation model”,Omega, Int. J. of Mgmt Sci., Vol. 18 No. 6, pp. 637-52.
Igbaria, M. and Guimaraes, T. (1994), “Empirically testing the outcome of user involvement in DSS development”,Omega, Int. J. of Mgmt Sci., Vol. 22 No. 2, pp. 157-72.
Igbaria, M. and Nachman, S.A. (1990), “Correlates of user satisfaction with end user computing”, Information & Management, Vol. 19, pp. 73-82.
Igbaria, M. and Tan, M. (1997), “The consequences of information technology acceptance on subsequent individual performance”,Information & Management, Vol. 32, pp. 113-21.
Igbaria, M. and Zviran, M. (1991), “End-user effectiveness: a cross-cultural examination”,Omega, Int. J. of Mgmt Sci., Vol. 19 No. 5, pp. 369-79.
Igbaria, M., Parvi, F.N. and Huff, S.L. (1989), “Micro computer applications: an empirical look at usage”,Information & Management, Vol. 16, pp. 187-96.
Igbaria, M., Schiffman, S.J. and Wieckowski, T.J. (1994), “The respective roles of perceived usefulness and perceived fun in the acceptance of microcomputer technology”,Behaviour & Information Technology, Vol. 13 No. 6, pp. 349-61.
Ives, B. and Olson, H. (1984), “User involvement and MIS success: a review of research”, Management Science, Vol. 30 No. 5, pp. 586-603.
Ives, B., Olson, H. and Baroudi, J. (1983), “The measurement of user information satisfaction”, Communications of the ACM, Vol. 26 No. 10, pp. 785-93.
Jenkins, M. and Ricketts, J. (1985), “The development of an MIS satisfaction questionnaire: an instrument for evaluating user satisfaction with turnkey decision support systems”, Working Paper Series (1984)-146, College of Business Administration, University of Houston, Houston, TX, 25 January.
Joshi, K. (1992), “A causal path model of the overall user attitudes toward the MIS function: the case of user information satisfaction”,Information & Management, Vol. 22, pp. 77-88. Kaiser, K.M. and Srinivasan, A. (1980), “The relationship of user attitudes toward design criteria and information systems success”, 12th Annual Meeting AIDS Proceedings, National AIDS Conference, November, pp. 201-3.
System usage
and user
satisfaction
Khalil, O.E.M. and Elkordy, M.M. (1999), “The relationship between user satisfaction and systems usage: empirical evidence from Egypt”,Journal of End User Computing, Vol. 11 No. 2, pp. 21-8.
Kim, C., Suh, K. and Lee, J. (1998), “Utilization and user satisfaction in end-user computing: a task-contingent model”, Information Resources Management Journal, Vol. 11 No. 4, pp. 11-24.
Kim, E.H. and Lee, J.J. (1986), “An exploratory contingency mode of user participation and MIS use”,Information & Management, Vol. 11 No. 2, pp. 87-97.
Kim, K.K. (1989), “User satisfaction: a synthesis of three different perspectives”, Journal of Information Systems, Vol. 12, Fall, pp. 1-12.
Kivijarvi, H. and Zmud, R.W. (1993), “DSS implementation activities, problem domain characteristics and DSS success”,European Journal of Information Systems, Vol. 2 No. 3, pp. 159-68.
Kraemer, H.C. and Andrews, G. (1982), “A nonparametric technique for meta-analysis effect size calculation”,Psychological Bulletin, Vol. 91 No. 2, pp. 404-12.
Lawrence, M. and Low, G. (1993), “Exploring individual user satisfaction within user-led development”,MIS Quarterly, June, pp. 195-208.
Lee, S., Kim, Y.R. and Lee, J. (1995), “An empirical study of the relationships among end-user information systems: acceptance, training, and effectiveness”, Journal of Management Information Systems, Vol. 12 No. 2, pp. 189-202.
Leidner, D.E. (1996), “Modern management in the developing world: the success of EIS in Mexican organizations”, Proceedings of the 17th International Conference Information Systems, Cleveland, OH, 16-18 December, pp. 290-306.
Liang, T.P. (1986), “Critical success factors of decision support systems: an experimental study”, Data Base, Vol. 17 No. 2, pp. 3-16.
Lipsey, M.W. and Wilson, D.B. (1993), “The efficacy of psychological, educational, and behavioral treatment: confirmation from meta-analysis”,American Psychologist, Vol. 48, pp. 1181-209.
Lipsey, M.W. and Wilson, D.B. (2001), Practical Meta-Analysis, Sage Publications, Newbury Park, CA.
Liu, L. (2004), “The technology acceptance model: a meta-analysis of empirical findings”,Journal of Organizational and End User Computing, Vol. 16 No. 1, pp. 59-72.
Loh, L. and Ong, Y. (1998), “The adoption of internet-based stock trading: a conceptual framework and empirical results”,Journal of Information Technology, Vol. 13, pp. 81-94. Lucas, H.C. (1975a), “Performance and the use of an information system”,Management Science,
Vol. 21 No. 8, pp. 908-19.
Lucas, H.C. (1975b),Why Information Systems Fail, Columbia University Press, New York, NY. Lyons, L.C. (1998), “Meta-analysis: methods of accumulating results across research domains”,
available online at: www. monumental.com /solomon/
McGill, T.J., Hobbs, V.H. and Klobas, J.E. (2000), “Testing the Delone and McLean Model of IS success in the user developed application domain”,Proceedings of the 11th Australasian Conference on Information Systems, Brisbane, 6-8 December, p. 56 (Abstract, Full paper on CD).
Mahmood, M.A. and Swanberg, D.L. (2001), “Factors affecting information technology usage: a meta-analysis of empirical literature”, Journal of Organizational Computing and Electronic Commerce, Vol. 11 No. 2, pp. 107-30.
JEIM
18,2
Mahmood, M.A., Burn, J.M., Gemoets, L. and Jacquez, C. (2000), “Variables affecting information technology end-user satisfaction: a meta-analysis of the empirical literature”,International Journal of Human-Computer Studies, Vol. 52, pp. 751-71.
Maish, A.M. (1979), “A user’s behavior towards his MIS”,MIS Quarterly, Vol. 3 No. 1, pp. 39-52. Mawhinney, C.H. (1990), “A study of computer use by knowledge workers: user satisfaction versus system use”,Proceedings Annual Meeting of Decision Sciences Institute, San Diego, CA, pp. 954-6.
Mawhinney, C.H. and Lederer, A.L. (1990), “A study of personal computer utilization by managers”,Information & Management, Vol. 18, pp. 243-53.
Melone, N.P. (1990), “A theoretical assessment of the user satisfaction construct in information systems research”,Management Science, Vol. 36 No. 1, pp. 76-91.
Montazemi, A.R. and Wang, S. (1988-1989), “The effects of modes of information presentation on decision making: a review and meta-analysis”, Journal of Management Information Systems, Vol. 5 No. 3, pp. 101-27.
Nath, R. (1989), “Are frequent computer users more satisfied?”, Information Processing & Management, Vol. 25 No. 5, pp. 557-62.
Nolan, R.L. and Seward, H. (1974), “Measuring user satisfaction to evaluate information systems”, in Nolan, R.L. (Ed.),Managing the Data Resource Function, West Publishing, Los Angeles, CA.
Pervan, G.P. (1994), “The measurement of GSS effectiveness: a meta-analysis of the literature and recommendations for future GSS research”, Proceedings of the 27th Annual Hawaii International Conference on System Sciences, Maui, HI, 4-7 January, pp. 562-71.
Pettingell, K., Marshall, T. and Remington, W. (1988), “A review of the influence of user involvement on system success”, Proceedings of the 9th International Conference on Information Systems, pp. 227-33.
Raymond, L. (1985), “Organizational characteristics and MIS success in the context of small business”,MIS Quarterly, March, pp. 37-53.
Raymond, L. (1990), “Organizational context and information systems success: a contingency approach”,Journal of Management Information Systems, Vol. 16 No. 4, pp. 5-20. Robey, D. (1979), “User attitudes and management information system use”, Academy of
Management Journal, Vol. 22 No. 3, pp. 527-38.
Rosenthal, R. (1979), “The ‘file drawer problem’ and tolerance for null results”,Psychological Bulletin, Vol. 86 No. 3, pp. 638-41.
Saarinen, T. (1996), “An expanded instrument for evaluating information system success”, Information & Management, Vol. 31, pp. 103-18.
Sanders, G.L. (1983), “A field study of organizational factors affecting DSS implementation”, unpublished PhD dissertation, Texas Tech. University, Lubbock, TX.
Sanders, G.L. and Courtney, J.F. (1985), “A field study of organizational factors influencing DSS success”,MIS Quarterly, Vol. 9 No. 1, pp. 37-52.
Sauer, C. (1993), Why Information Systems Fail: A Case Study Approach, Alfred Waller, Henley-on-Thames.
Schewe, C.D. (1976), “The management information system user: an exploratory behavioral analysis”,Academy of Management Journal, Vol. 19 No. 4, pp. 577-90.
Schwenk, C.R. (1990), “Effects of devil’s advocacy and dialectical inquiry on decision making: a meta-analysis”,Organizational Behaviour and Human Decision Processes, Vol. 47 No. 1, pp. 161-76.
System usage
and user
satisfaction
Seddon, P.A. (1997), “respecification and extension of the Delone and McLean model of IS success”,Information Systems Research, Vol. 8 No. 3, pp. 240-53.
Seddon, P. and Kiew, M. (1994), “A partial test and development of the Delone and McLean model of IS success”,Proceedings of the International Conference on Information Systems (ICIS), Vancouver, pp. 99-110.
Seddon, P.B. and Kiew, M. (1996), “A partial test and development of the Delone and McLean model of IS success”,Australian Journal of Information Systems, Vol. 4 No. 1, pp. 90-109. Smith, M.L. (1980), “Publication bias and meta-analysis”,Evaluation in Education, Vol. 4, pp. 22-4. Snitkin, S.R. and King, W.R. (1986), “Determinants of the effectiveness of personal decision
support systems”,Information & Management, Vol. 10, pp. 83-9.
Srinivasan, A. (1985), “Alternative measure of systems effectiveness: association and implications”,MIS Quarterly, Vol. 9 No. 3, pp. 243-53.
Stoffelmayr, B.E., Dillavou, D. and Hunter, J.E. (1983), “Premorbid functioning and outcome in schizophrenia: a cumulative analysis”, Journal of Consulting and Clinical Psychology, Vol. 51, pp. 338-52.
Suh, K., Kim, S. and Lee, J. (1994), “End-users’ disconfirmed expectations and the success of information systems”,Information Resources Management Journal, Fall, pp. 30-9. Swanson, E.B. (1974), “Management information systems: appreciation and involvement”,
Management Science, Vol. 21 No. 2, pp. 178-88.
Szajna, B. (1993), “Determining information system usage: some issues and examples”, Information & Management, Vol. 25, pp. 147-54.
Szajna, B. and Scamell, R.W. (1993), “The effects of information system users’ expectation on their performance and perception”,MIS Quarterly, Vol. 17 No. 4, pp. 493-516.
Thong, J.Y.L. and Yap, C. (1996), “Information systems effectiveness: a user satisfaction approach”,Information Processing & Management, Vol. 32 No. 5, pp. 601-10.
Torkzadeh, G. and Dwyer, D.J. (1994), “A path-analytic study of determinants of information system usage”,Omega, Int. J. Mgmt Sci., Vol. 22 No. 4, pp. 339-48.
Trice, A.W. and Treacy, M.E. (1988), “Utilization as a dependent variable in MIS research”,Data Base, Fall/Winter, pp. 33-41.
Trotman, K.T. and Wood, R. (1991), “A meta-analysis of studies on internal control judgements”, Journal of Accounting Research, Vol. 29 No. 1, pp. 181-92.
Udo, G. (1992), “Rethinking the effectiveness measures of decision support systems”,Information & Management, Vol. 22, pp. 123-35.
Udo, G.J. and Guimaraes, T. (1994), “Empirically assessing factors related to DSS benefits”, European Journal of Information Systems, Vol. 3 No. 3, pp. 218-27.
Vlahos, G.E. and Ferratt, T.W. (1995), “Information technology use by managers in Greece to support decision making: amount, perceived value, and satisfaction”, Information and Management, Vol. 29, pp. 305-15.
Wilkin, C., Hewett, B. and Carr, R. (1999), “Towards a hierarchical definition of delivered IS quality”, Proceedings of the 6th European Conference on Information Technology Evaluation, Brunel University, Uxbridge, 4-5 November, pp. 289-98.
Wilkins, M. (1996), “Determinants of microcomputer usage in the Republic of Ireland”,Journal of End User Computing, Vol. 8 No. 4, pp. 3-9.
Winter, S.J., Chudoba, K.M. and Gutek, B.A. (1998), “Attitudes towards computers: when do they predict computer use?”,Information & Management, Vol. 34, pp. 275-84.
JEIM
18,2
Wolf, F.M. (1986), Meta-Analysis: Quantitative Methods for Research Synthesis, Sage Publications, London.
Yap, C.S., Thong, J.Y.L. and Raman, K.S. (1994), “Effect of government incentive on computerisation in small business”,European Journal of Information Systems, Vol. 3 No. 3, pp. 191-206.
Yoon, Y. and Guimaraes, T. (1995), “Assessing expert systems impact on users’ jobs”,Journal of Management Information Systems, Vol. 12 No. 1, pp. 225-49.
Zinatelli, N. (1994), “End user computing success factors in small firms: a case study and survey of factors affecting EUC success in small firms in New Zealand”, unpublished PhD dissertation, University of Canterbury, Canterbury.
Zinkhan, G.M., Joachimsthaler, E.A. and Kinnear, T.C. (1987), “Individual differences and marketing decision support system usage and satisfaction”, Journal of Marketing Research, Vol. XXIV, pp. 208-14.
Zmud, R.W. (1979), “Individual differences and MIS success: a review of the empirical literature”, Management Science, Vol. 25 No. 10, pp. 966-79.
Further reading
Barki, H. and Huff, S.L. (1990), “Implementation decision support systems: correlates of user satisfaction and system usage”,INFOR, Vol. 8 No. 2, pp. 89-101.
Bergeron, F., Raymond, L., Rivard, S. and Gara, M. (1995), “Understanding EIS use: an empirical test of a behavioral model”,Proceedings of the 25th Hawaii International Conference on System Sciences, Kauai-Hawaii, HI, 7-10 January, pp. 157-165.
Choe, J. (1996), “The relationship among performance of accounting information systems, influence factors, and evolution level of information systems”,Journal of Management Information Systems, Vol. 12 No. 4, pp. 215-39.
Cohen, J. (1969),Statistical Power Analysis for the Behavioral Science, Academic Press, New York, NY and London.
King, W.R. and Rodriguez, J.I. (1981), “Participative design of strategic decision support systems: an empirical assessment”,Management Science, Vol. 27 No. 6, pp. 717-26.
Kohli, R. and Devaraj, S. (2003), “Measuring information technology payoff: a meta-analysis of structural variables in firm-level empirical research”, Information Systems Research, Vol. 14 No. 2, pp. 127-45.
Lin, J.W. and Hwang, M.I. (2000), “A meta-analysis of the effect of task properties on business failure prediction accuracy”,Advances in Accounting, Vol. 17, pp. 135-49.
Miller, J. (1989), “Information systems effectiveness: the fit between business needs and system capabilities”,Proceedings of the 10th International Conference on Information Systems, Boston, MA, 4-6 December, pp. 273-88.
Myers, B.L., Kappleman, L.A. and Prybutok, V.R. (1998), “A comprehensive model for assessing the quality and productivity of information systems function: toward a theory for information systems assessment”, in Garrity, E.J. and Sanders, G.L. (Eds),Information Systems Success Measurement, Idea Group Publishing, London, pp. 94-121.
Premkumar, G. (2003), “A meta-analysis of research on information technology implementation in small business”,Journal of Organization Computing and Electronic Commerce, Vol. 13 No. 2, pp. 91-121.
Raymond, L. (1987), “Validating and applying user satisfaction as a measure of MIS success in small organisations”,Information & Management, Vol. 12, pp. 173-9.
System usage
and user
satisfaction
Rushinek, A. and Rushinek, S.F. (1986), “What makes users happy?”, Communications of the ACM, Vol. 29 No. 7, pp. 594-8.
Shaw, G.J. (1998), “User satisfaction in group support systems research: a meta-analysis of experimental results”,Proceedings of the 31st Hawaii International Conference on System Sciences (HICSS’98), Maui, HI, IEEE Computer Society, New York, NY, pp. 360-9. Tait, P. and Vessey, I. (1988), “The effect of user involvement on systems success: a contingency
approach”,MIS Quarterly, Vol. 12 No. 1, pp. 91-108.
Torkzadeh, G. and Doll, W.J. (1999), “The development of a tool for measuring the perceived impact of information technology on work”,Omega, Int. J. Mgmt Sci., Vol. 27, pp. 327-39.