Partial least squares with discriminant analysis and UV– visible spectroscopy for
qualitative evaluation of Arabica and Robusta coffee in Lampung
Meinilwita Yulia, Aniessa Rinny Asnaning, Sri Waluyo, and Diding Suhandy
Citation: AIP Conference Proceedings 2021, 060021 (2018); doi: 10.1063/1.5062785
View online: https://doi.org/10.1063/1.5062785
View Table of Contents: http://aip.scitation.org/toc/apc/2021/1
Partial Least Squares with Discriminant Analysis and UV
–
Visible Spectroscopy for Qualitative Evaluation of Arabica
and Robusta Coffee in Lampung
Meinilwita Yulia
1,a), Aniessa Rinny Asnaning
1, Sri Waluyo
2and Diding Suhandy
2,b)1Department of Agricultural Technology, Lampung State Polytechnic, Jalan Soekarno Hatta 10, Rajabasa Bandar Lampung, 35141, Indonesia.
2Spectroscopy Research Group (SRG), Laboratory of Bioprocess and Postharvest Engineering, Department of Agricultural Engineering, Faculty of Agriculture, Lampung University, Jalan Prof. Dr. Soemantri Brojonegoro 1,
Bandar Lampung, 35145, Indonesia.
a)Corresponding author: [email protected] b)[email protected]
Abstract. Arabica coffee is considered to be of better quality than Robusta coffee. It has superior taste and aroma, better than Robusta coffee. To develop an authentication system for Arabica coffee, it is highly necessary to discriminate between pure Arabica coffee and Arabica adulterated with Robusta coffee. Ground roasted coffee samples are most difficult to discriminate from each other: visual inspection by the naked eye or even machine vision methods becomes very problematic. For this reason, we here propose a relatively new analytical method based on UV–visible spectroscopy for discrimination the pure and adulterated Arabica ground roasted coffee. In this study, 100 samples were used as samples with different degrees of adulteration (0%–60% of Robusta concentration in an Arabica–Robusta coffee blend). Spectral data of samples were acquired using a UV–visible spectrometer in the range of 190–1100 nm (Genesys 10s, Thermo Scientific, USA). Partial least square discriminant analysis (PLS-DA) was applied to discriminate between the pure and adulterated Arabica coffee based on UV–visible spectra data. Several pre-processing spectra were also tested to determine which one provides an appropriate discrimination model. The PLS-DA model has coefficient of correlation 0.89 (R2 = 0.79) with low Root mean square error of calibration (RMSEC) 0.226. The full-cross validation resulted in Q2
= 0.74 and low Root mean squared error of cross-validation (RMSECV) 0.254. Using this PLS-DA model, a total rate of correct classification of 97.5% was obtained in the prediction set. In conclusion, UV–visible spectroscopy in tandem with PLS-DA is a promising analytical method for differentiating between pure and adulterated Arabica ground roasted coffee.
Keywords: Arabica, coffee, robusta, visual inspection
INTRODUCTION
Coffee can be regarded as one of the most popular beverages in the world. The popularity of coffee is mainly due to its beneficial physiological effects on health, its good taste, its intense flavor, and its attractive aroma.1 In January
2018, global coffee exports amounted to 11.01 million bags (1 bag = 60 kg) [2]. It has increased about 20.7% compared to 2017. Until 2017, Indonesia was the number four producer in the world (after Brazil, Vietnam and Colombia), responsible for about 6.8% of the world’s coffee production.2
Up to now, Arabica (Coffea arabica) and Robusta (Coffea canephora) have been the most important coffee
chemical composition, but also in terms of commercial value, with Arabica coffees obtaining 20%–25% higher market prices.3-4
For green coffee beans, the difference between Robusta and Arabica can be observed visually because the color and shape of Arabica beans are typically different from Robusta beans: Arabica coffee beans have a slightly larger and elliptical shape than the smaller, rounder Robusta beans. After roasting, visual inspection to discriminate between the two beans becomes difficult and complicated.4 Furthermore, in the case of ground roasted coffee,
discrimination of the two beans based on visual inspection is almost infeasible.5 As Arabica coffee has a higher price
than Robusta coffee, the preparation of blends (Robusta-to-Arabica) is highly feasible. Therefore, the authentication of Arabica coffee is a really important issue, especially for 100% Arabica blends.6
For a ground roasted blend of Arabica and Robusta, several attempts have been reported to develop an analytical method for Arabica coffee authentication both in quantitative and qualitative studies such as gas chromatography (GC),7,8 mass spectrometry,9 high-performance liquid chromatography (HPLC),10 nuclear magnetic resonance
(NMR) spectroscopy,11 Raman spectroscopy,12 mid-infrared (MIR) spectroscopy,4 and near infrared (NIR)
spectroscopy.13
Recently, among the spectroscopy based methods, UV–visible spectroscopy has attracted considerable attention for food authentication purposes. Alamprese et al. investigated the potential of UV–visible, NIR and MIR spectroscopies in combination with LDA and PLS analysis methods for detecting minced beef adulteration with turkey meat.14 Among the quantitative studies, Dankowska et al. showed fluorescence and UV–visible spectroscopy
to have a complementary effect on the quantification of roasted Arabica and Robusta in blends.15 Among the
qualitative studies, UV–visible spectroscopy with PLS-DA and SIMCA has been used to discriminate between pure peaberry and pure normal ground roasted coffee.16 PLS-DA is the most widely used supervised method for
classification in chemometrics.17 The combination of spectroscopic method (NIR, mid-infrared, Raman, terahertz
(THz) and UV–visible) and PLS-DA for classification purposes have been reported with acceptable results.18-23
However, a combination of UV–visible spectroscopy and PLS-DA for a qualitative study of ground roasted Arabica and Robusta has not yet been investigated. Therefore, the objective of the present study is to evaluate the discrimination between pure and adulterated Arabica ground roasted coffee using UV–visible spectroscopy and the PLS-DA method.
MATERIALS AND METHODS
Samples
Roasted Arabica and Robusta coffee beans were purchased from local markets (Hasti Coffee Lampung). The samples were ground at room temperature in a home coffee grinder (Sayota) and sieved (50 mesh). One humdred samples of coffee blends were prepared with different proportions of Robusta coffee in Arabica coffee (0%–60% of Robusta concentration in an Arabica–Robusta coffee blend). Before spectral acquisition, an extraction procedure using hot water was performed for each sample as described in the previously reported studies.16,24-26
Spectral Data Acquisition
After coffee extraction, 3 mL of each sample solution was pipetted to a 10 mm quartz cuvette. The absorbance measurement of these aqueous coffee samples was recorded using a UV–Visible spectrometer (GENESYS 10S UV–
Vis, Thermo Scientific, USA) in the range of 190–1100 nm (full wavelength). A blank spectrum was recorded with distilled water.
Multivariate Data Analysis using PLS-DA
To perform a qualitative study, we applied the method of partial least squares discriminant analysis (PLS-DA). It is based on the PLS regression algorithm with one category (a dummy variable) as a reference value.16 In this
Before the PLS-DA model development, the spectra also underwent some pre-treatment. Three different preprocessings were applied: moving average with 11 points smoothing, first order derivative applying the Savitzky–Golay algorithm with an 11-point window and a polynomial order of 2, and the standard normal variate (SNV) and multiplicative scatter correction (MSC). The PLS-DA model was evaluated using two parameters: the coefficient of determination (R2) and the cross-validated coefficient of determination (Q2).27 The R2 and Q2 values
describe the fit of the model, where Q2 was calculated based on a full cross-validation. The developed PLS-DA
model was then used to predict the class membership for the prediction sample set using ± 0.5 as a threshold value to delimit the classes.16,18,23,28 Then, the overall rate of correct classification (accuracy) was calculated to evaluate the
performance of the PLS-DA model.29 The PLS-DA and all spectral transformations were done using the multivariate
analysis software of The Unscrambler® X (30 day trial version – CAMO Software, Oslo, Norway).
RESULTS AND DISCUSSION
Spectral Analysis of Pure and Adulterated Samples
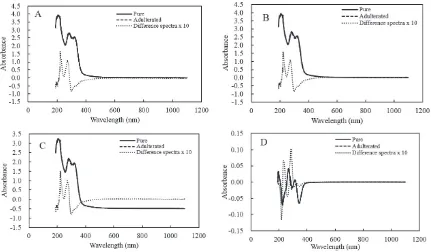
Fig. 1 shows the average UV–visible spectra for both pure Arabica coffee (solid line) and adulterated with 10%–
60% Robusta coffee (dashed line) for the original and pre-processed spectra. It can be seen that there are prominent absorption peaks at the wavelengths 275 nm, 315 nm and 350 nm. Fig. 1 shows that it is very difficult to distinguish between the two types of coffee (pure and adulterated) based only on their spectra. However, a calculation of the spectral difference between the pure and adulterated average spectra shows that the most informative portion of the spectrum is found in the UV region (190–400 nm). This spectral region may afford us the possibility of demonstrating a differentiation between pure and adulterated samples using chemometric classification techniques (PLS-DA method).
Principal Component Analysis (PCA)
After checking the most significant spectral region, a PCA of the coffee blends was conducted using the spectral range from 190 nm to 400 nm. The PCA was performed as an exploratory tool. The spectra were pre-processed using a moving average with 11-point smoothing, using the first order derivative applying the Savitzky–Golay algorithm with an 11-point window and a polynomial of order 2, and using a standard normal variate (SNV) and multiplicative scatter correction through the NIPALS algorithm and full cross-validation. Fig. 2 shows the resulting score graphics obtained for the discrimination of the blends by PCA with the first three principal components (PC1, PC2 and PC3). In all, 66%, 18% and 5% of the spectral variance was accounted for by PC1, PC2 and PC3, respectively. The cumulative percentage variance (CPV) of the first three principal variables was thus found to be 89% of the total variance in the whole spectral dataset, which meets the general requirements of CPV more than 70%–85% for PCA analysis.30
(a) (b)
FIGURE 2. PCA plot for the pure and adulterated ground roasted Arabica coffee based on preprocessed spectral data in the range 190-400 nm. PC1 versus PC2 (a). PC1 versus PC3 (b).
It can be seen from the PCA plot that there is complete differentiation and separation between the pure ground roasted Arabica coffee and the 10%–60% ground roasted Robusta coffee adulteration. They are spaced and grouped in the specific different regions of the PCA plot.
(a) (b)
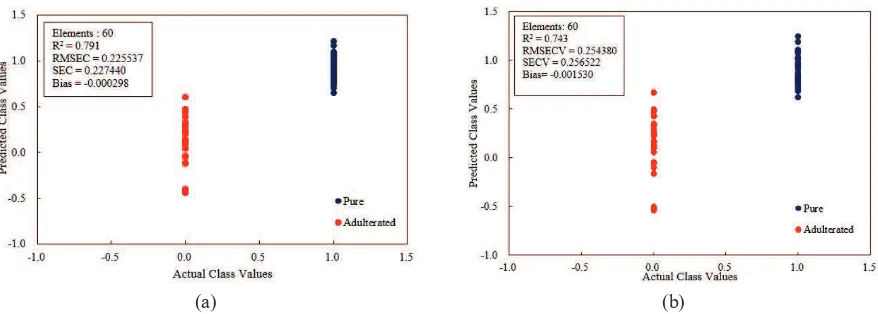
Partial Least Squares Discriminant Analysis (PLS-DA)
Fig. 3 shows a clear separation between the pure ground roasted Arabica coffee and the 10%–60% ground roasted Robusta coffee adulteration. It can be used as an identification tool to check for the adulteration of Arabica coffee with Robusta coffee. If there is any amount of Robusta coffee in the Arabica coffee, it will occupy the space in between the pure and adulterated samples of the PLS-DA plot. The PLS-DA model has a coefficient of correlation of 0.89 (R2 = 0.79) with a low RMSEC of 0.226. The full-cross validation resulted in Q2 = 0.74 and a low
RMSECV of 0.254.
PLS-DA Model Evaluation
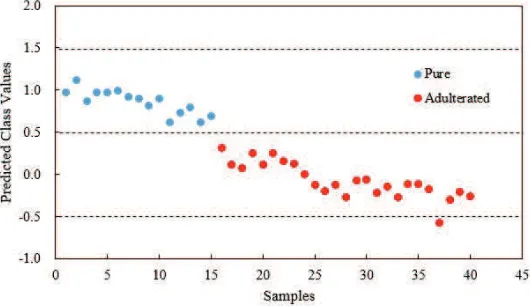
The classification result of the samples in the prediction set is shown in Fig. 4. Obviously, all the pure Arabica samples were correctly recognized (20 samples). Using ±0.5 as a threshold value, there was only one Arabica sample adulterated with Robusta which failed to be correctly recognized (19 samples were correctly classified from a total of 20 samples).16,18,23,28 Thus, a total rate of correct classification of 97.5% was obtained in the prediction set.
FIGURE 4. Result of classification between pure Arabica and adulterated Arabica coffee samples in the prediction set using developed PLS-DA model.
SUMMARY
This research demonstrates the potential of using UV–Visible spectroscopy coupled with the PLS-DA method to identify adulteration in ground roasted Arabica coffees. The classification result was satisfactory, with an accuracy rate of 97.5% in the prediction step. This promising result has opened a possible application of using UV–Visible spectroscopy and the PLS-DA method to establish a simple, chemical-free, rapid and accurate method for discriminating between pure and adulterated Arabica ground roasted coffee.
ACKNOWLEDGMENTS
This work has received funding from the Indonesian Ministry of Research, Technology and Higher Education (KEMENRISTEKDIKTI) through Hibah Penelitian Kerjasama Perguruan Tinggi (PKPT) 2018 (Grant Number: 758.9/PL15.8/PP/2018). The authors would like to thank Laboratory of Bioprocess and Postharvest Engineering, The University of Lampung for providing the laboratory facilities.
REFERENCES
http://www.ico.org/trade_statistics.asp.
3. D. F. Barbin, A. L. S. M. Felicio, D.W. Sun, S.L. Nixdorf and E.Y. Hirooka, Food Res. Int.61, 23–32 (2014). 4. C. Assis, L. S. Oliveira and M. M. Sena, Food Anal. Methods11, 578–588 (2018).
5. L.R. Cagliani, G. Pellegrino, G. Giugno and R. Consonni, Talanta106, 169–173 (2013).
6. E. Schievano, C. Finotello, E. Angelis, S. Mammi and L. Navarini, J. Agric. Food Chem. 62, 12309–12314 (2014).
7. G. Caprioli, M. Cortese, G. Cristalli, F. Maggi, L. Odello, M. Ricciutelli, G. Sagratini, V. Sirocchi, G. Tomassoni and S. Vittori, Food Chem.135, 1127–1133 (2012).
8. U. Jumhawan, S.P. Putri, B.T. Yusianto and E. Fukusaki, J. Biosci. Bioeng.122, 79–84 (2016). 9. R. Garrett, C.M. Rezende and D.R. Ifa, Anal Methods5, 5944–5948 (2013).
10. C.E. Mills, M.J. Oruna-Concha, D.S. Mottram, G.R. Gibson and J.P.E. Spencer, Food Chem.141, 3335–3340 (2013).
11. Y.B. Monakhova, W. Ruge, T. Kuballa, M. Ilse, O. Wilkelmann, B. Diehl, F. Thomas and D.W. Lachenmeier,
Food Chem.182, 178–184 (2015).
12. R.M. El-Abassy, P. Donfack and A. Materny, Food Chem.126, 1443–1448 (2011).
13. E. Bertone, A. Venturello, A. Giraudo, G. Pellegrino and F. Geobaldo, Food Control,59, 683–689 (2016). 14. C. Alamprese, M. Casale, N. Sinelli, S. Lanteri and E. Casiraghi, LWT - Food Sci. Technol. 53, 225–232
(2013).
15. A. Dankowska, A. Domagała and W. Kowalewski, Talanta172, 215–220 (2017). 16. D. Suhandy and M. Yulia, Int. J. Food Prop.20, S331–S339 (2017).
17. L. Yi, N. Dong, Y. Yun, B. Deng, D. Ren, S. Liu and Y. Liang, Anal. Chim. Acta914, 17–34 (2016). 18. R. Beghi, V. Giovenzana, L. Brancadoro and G. Guidetti, J. Food Eng.204, 46–54 (2017).
19. X. Li, S. Wang, W. Shi and Q. Shen, Food Anal. Methods9, 1713–1718 (2016).
20. X. Wang, C. Esquerre, G. Downey, L. Henihan, D. O`Callaghan and C. O`Donnell, Food Anal. Methods11, 1380–1389 (2018).
21. A.M. Jiménez-Carvelo, M. T. Osorio, A. Koidis, A. González-Casado and L. Cuadros-Rodríguez, LWT-Food Sci. Technol.86, 174–184 (2017).
22. W. Liu, Y. Zhang, S. Yang and D. Han, Spectrochim. Acta A Mol. Biomol. Spectrosc.196, 123–130 (2018). 23. V. Giovenzana, R. Beghi, A. Tugnolo, L. Brancadoro and R. Guidetti, Comput. Electron. Agric.146, 86–92
(2018).
28. V. Cortés, S. Cubero, N. Aleixos, J. Blasco and P. Talens, Postharvest Biol. Technol.133, 113–120 (2017). 29. D. Ballabio and V. Consonni, Anal. Methods5, 3790–3798 (2013).