THIS REPORT CONTAINS ASSESSMENTS OF COMMODITY AND TRADE ISSUES MADE BY
USDA STAFF AND NOT NECESSARILY STATEMENTS OF OFFICIAL U.S. GOVERNMENT
POLICY
Date:
GAIN Report Number:
Approved By:
Prepared By:
Report Highlights:
The exporter guide provides an economic and market overview, demographic trends and practical tips to U.S. exporters on how to conduct business in the Netherlands. The report also identifies the three market sectors (food retail, food service and food processing) and describes the best market entry approach and identifies the best high-value product prospects. The exporter guide focuses exclusively on consumer-oriented and fishery products.
Marcel Pinckaers
Susan Phillips
Exporting U.S. Food Products to the Netherlands
Exporter Guide
Netherlands
Table of Content
Section I. Market Overview 2
Section II. Exporter Business Tips 5
Section III. Market Sector Structure and Trends 7
Section IV. Best High-Value Product Prospects 8
Section V. Key Contact and Further Information 9
Appendix A. Key Trade & Demographic Information for the Netherlands 11 Appendix B. Consumer-Oriented & Fish Products Imports 12 Appendix C. Top 15 Suppliers of Consumer Foods and Edible Fishery Products 15
SECTION I. MARKET OVERVIEW
The Netherlands in a Nutshell
The Netherlands is a small country in Western Europe, bordering Germany to the east, Belgium to the south, and the North Sea to the northwest. The largest and most important cities in the Netherlands are Amsterdam, The Hague, Rotterdam and Utrecht, together referred to as the Randstad. Amsterdam is the country's capital, while The Hague holds the Dutch seat of government and parliament. The Netherlands' name literally means "Low Country", influenced by its low land and flat geography, with only half of its land exceeding one meter above sea level.
Macroeconomic Situation and Trends
The Dutch economy is firing on all cylinders after years of anemic and uneven economic growth. In its
September 2017 economic forecast, the Netherlands Bureau for Economic Policy Analysis (CPB) projects annual economic growth in 2017 to be 3.3 percent, clearing the three percent barrier for the first time since 2007;
however, CPB expects economic growth to consolidate at 2.5 percent in 2018.
The overall export of goods and services, an essential element of the very open Dutch economy, grew by 4.3 percent in 2016. Over half of all Dutch exports consist of re-exported goods, bound for an international destination with limited value added by Dutch firms after import from the originating countries. According to CPB’s forecast, exports will continue to grow by 4.9 percent in 2017 and by 4.5 percent in 2018.
The growing Dutch economy is also reflected in a declining unemployment rate. The unemployment rate has steadily declined since it reached its peak in 2014 at 7.4 percent. In 2016, the unemployment rate was 6.0 percent. This improvement is forecast to continue in 2017 (4.9 percent) and 2018 (4.3 percent), levels not seen since before the financial crisis.
The annual inflation rate fluctuated around 2.5 to 3.0 percent up to 2013, but the Netherlands has also experienced the deflationary pressure in the eurozone and 2016 inflation was 0.1 percent. Inflation for both 2017 and 2018 are expected to be 1.3 percent, as prices of energy and raw materials are forecast to grow.
Table 1. Key Data Dutch Economy
2015 2016 *2017 *2018
Economic Growth, % 2.3 2.2 3.3 2.5
Unemployment, % 6.9 6.0 4.9 4.3
Inflation (HICP), % 0.2 0.1 1.3 1.3
GDP (billion $) 759.4 780.7 814.9 848.9
Source: Central Bureau of Statistics, Netherlands Bureau for Economic Policy Analysis/Eurostat * Source: U.S. Embassy The Hague
The Netherlands is the perfect gateway for U.S. products due to the presence of the Port of Rotterdam, Amsterdam Airport Schiphol, the confluence of several major rivers and an excellent road and railway infrastructure. The Dutch are known for their expertise in transportation and logistics. The Netherlands is the second largest exporter of agricultural products in the world after the United States and before Germany. These exports include agricultural products produced in the Netherlands, such as flowers and plants, and also imported products that are re-exported, directly or after further processing. An estimated 25 percent of Dutch agricultural exports are products that are directly re-exported after being imported (see below chart).
Chart 1: Top 10 Dutch Exports per Product Group, billion Euro1
0 2 4 6 8 10
grain and dairy preparation fruit and vegetables preparation fruit cocoa animal feed drinks vegetables milk and dairy meat flowers and plants
export of Dutch product re-export of foreign product
Source: Central Bureau of Statistics (CBS)
In 2016, Dutch agricultural imports were valued at $59.2 billion, similar to 2015 imports. Imports from the United States totaled $2.9 billion, slightly up (3 percent) compared to the previous year. Especially imports of U.S. soybeans, fruit and vegetable products, prepared foods, condiments & sauces and beverages.
Table 2. Netherlands’ imports of selected product groups, million USD
2011 2012 2013 2014 2015 2016
Agricultural, Fish and Forestry Products:
Total imports 64,235 62,563 64,604 65,332 59,447 59,212
Imports from U.S. 2,226 2,258 2,582 2,750 2,844 2,943 Source: World Trade Atlas
The Netherlands is the largest market in the EU for U.S. products, followed by the United Kingdom, Germany, Spain and Italy. Dutch imports from the United States represented 20 percent of total EU imports from the United States ($14.6 billion).
The Exporter Guide’s main focus is on the trade of consumer-oriented and fishery products. For the United States, the Netherlands is the largest market within the EU for these products.
The United States is the 6th largest supplier of consumer-oriented products to the Netherlands after Germany, Belgium, Brazil, France and Spain. Dutch imports of consumer-oriented products from the United States continued to grow until 2015. Imports in 2016 ($1,229 million) were similar to those in 2015 ($1,231). .
Table 3. Netherlands’ imports of consumer-oriented products, million USD
2011 2012 2013 2014 2015 2016
Consumer Oriented Agricultural Products:
Total imports 30,116 29,576 31,292 32,803 30,395 30,799
U.S. imports 845 844 976 1,134 1,231 1,229 Source: World Trade Atlas
The United States is the 8th largest supplier of fishery products to the Netherlands. U.S. exports of fishery products to the Netherlands continued to grow until 2015 ($140 million) but dropped in 2016 to $131 million. The Netherlands continues to be a growth market for lobster, shrimp & prawns, sockeye salmon, cuttlefish & squid and frozen fish fillets.
Table 4. Netherlands’ imports of seafood, million USD
2011 2012 2013 2014 2015 2016
Fish and Seafood Products:
Total imports 3,129 3,023 3,067 3,560 3,070 3,233
U.S. imports 99 95 104 121 140 131 Source: World Trade Atlas
Demographic Developments and Trends
In 2016 the Dutch population passed 17 million. Roughly half of the population lives in cities. Mean population density is 487 inhabitants per square kilometer, making the Netherlands one of the most densely populated countries in the world.
There are three main demographic developments in the Netherlands: 1. the graying of the Dutch population, 2. more ethnic diversity and 3. a drop in the size of the average household .
The number of people in the Netherlands is expected to grow by over 900 thousand between 2015 and 2030. The growth will mainly take place in the age group of people 65 years and older. Not only is this group of consumers growing, but they are also expected to be more affluent, more active and more experimental than ever before. The growing number of older people in the Netherlands offers new opportunities for the food industry as these
consumers have specific demands with respect to food purchases. Older people tend to look for food products that address issues linked to old age such as vitamin deficiencies and high cholesterol. Convenient food products which are easy to handle and prepare are also popular in this age group. There are opportunities in this market segment for U.S. food and beverage manufacturers that can tailor their products by using functional ingredients that give older consumers health benefits, such as a boosted immune system.
In the first six months of 2017, the Dutch population grew by almost 35 thousand, of which 31 thousand was due to migration according to the Central Bureau of Statistics (CBS). The largest number of immigrants came from Asia followed closely by Eastern European countries such as Romania, Bulgaria and the Baltics. As a result, the Dutch population is becoming increasingly diverse. A decade ago 19 percent of the population (or 3.1 million people) were of non-Dutch descent2. Last year, this number grew to almost 3.7 million people (or 22 percent of the Dutch population).
Between 2005 and 2015, the number of households in the Netherlands grew by eight percent, from 7.1 million to 7.7 million. This growth is largely due to the growth of ‘one-person households’, up by 17 percent (to 2,867,797
2
in 2015). The number of ‘more than one-person households’ grew by only three percent over the same period (to 4,797,401 in 2015). The ‘one-person households’ now accounts for 37 percent of all households. Despite the fact that young people are leaving home later due to financial reasons, the CBS expects the number of ‘one-person households’ to continue to grow as the Dutch population gets older and longer lives independently.
An older, more diverse and more individual population results in a growing demand for innovative products, smaller portions, healthy food options, functional foods, convenience and more international food solutions. Young ‘one-person households’ are slowly moving from eating three meals a day to snacking and ‘grazing’ five times at different places and times.
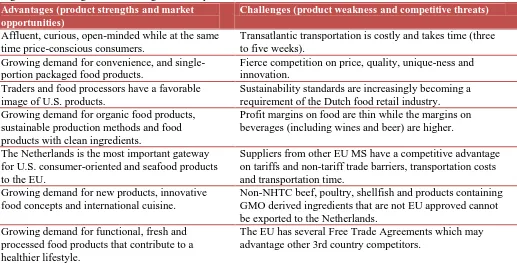
Figure 1. Advantages and Challenges U.S. Exporters Face in the Netherlands Advantages (product strengths and market
opportunities)
Challenges (product weakness and competitive threats)
Affluent, curious, open-minded while at the same time price-conscious consumers.
Transatlantic transportation is costly and takes time (three to five weeks).
Growing demand for convenience, and single-portion packaged food products.
Fierce competition on price, quality, unique-ness and innovation.
Traders and food processors have a favorable image of U.S. products.
Sustainability standards are increasingly becoming a requirement of the Dutch food retail industry. Growing demand for organic food products,
sustainable production methods and food products with clean ingredients.
Profit margins on food are thin while the margins on beverages (including wines and beer) are higher.
The Netherlands is the most important gateway for U.S. consumer-oriented and seafood products to the EU.
Suppliers from other EU MS have a competitive advantage on tariffs and non-tariff trade barriers, transportation costs and transportation time.
Growing demand for new products, innovative food concepts and international cuisine.
Non-NHTC beef, poultry, shellfish and products containing GMO derived ingredients that are not EU approved cannot be exported to the Netherlands.
Growing demand for functional, fresh and processed food products that contribute to a healthier lifestyle.
The EU has several Free Trade Agreements which may advantage other 3rd country competitors.
SECTION II. EXPORTER BUSINESS TIPS
Local Business Customs
Most business people speak and write in English and have a high level of education (Masters or Bachelor’s degree). They are straightforward, open-minded and well-traveled. After the first introduction they prefer to communicate on a ‘first name’ basis.
They are business-minded and like to be well informed about the exporting company, the product, the price and the business opportunity. Doing business does not require ‘wining & dining’. A healthy ‘work-life balance’ is important for the Dutch so preferably they want to get the job done during regular business hours.
Food retailers, foodservice companies and wholesalers do not buy directly from the United States. They work with dedicated and highly specialized traders. These importers look for long-term partnerships rather than a one-off business transaction.
Total consumer spending on foods certified as sustainable grew by 12 percent in 2015 to over $3.3 billion3. The share of sustainable food compared to total spending on food grew from seven in 2014 to eight percent in 2015. Sustainable food is the most important growth market in the Dutch food industry.
Consumers are looking for foods to improve their health. This is driving sales of fresh, premium, ‘free- from,’ ‘low-on’ and generally less processed foods such as organic vegetable chips with no additives. While at the same time consumers demand highly processed functional foods ‘rich-in’ products such as nutritional supplements.
The majority of supermarkets can be found within residential neighborhoods. The Dutch like to do their big basic shopping on Friday or Saturday. During the week, the average consumer visits the supermarkets an additional two times to buy fresh and cuisine-specific ingredients. The Dutch like to cook different cuisine styles, including Indonesian, Italian and Spanish cuisines. Another reason why shopping is undertaken every couple of days is the fact that kitchens and refrigerators are small. U.S. suppliers should consider small quantities when determining export package size.
Food Standards & Import Regulations
Food and Agricultural Import Regulations and Standards (FAIRS) provides the Dutch import regulations and standards.
Manufacturers (that are not eligible to export to the European Union) that want to send their products to the Netherlands for exhibiting at a trade show or for research purposes need to request an import waiver. Such products cannot be consumed and must be destroyed afterwards under supervision. You can contact the Netherlands Food and Consumer Product Safety Authority (NVWA) for obtaining an import waiver; see Appendix III of the above FAIRS report.
Inspection Procedures
Animals and plant products are brought from countries all over the world into the European Union. To prevent the introduction of plant and animal diseases and to protect the market from public health risks, the European Commission has set out detailed regulations. On this basis, the NVWA performs checks on:
- live animals (such as horses, chicks and ornamental fish) and products of animal origin (such as meat,
fish, wildlife, and animal feed): More detailed information on the import procedure of animals and products of animal origin can be found on the following websites
https://english.nvwa.nl/topics/themes/animal-health and https://www.nvwa.nl/onderwerpen/import-van-dieren-en-producten-van-dierlijke-oorsprong.
- food stuffs (such as vegetables, dried fruits, spices, nuts and seeds): More detailed information on the
import procedure of food stuffs can be found https://english.nvwa.nl/topics/themes/food-safety and
https://www.nvwa.nl/onderwerpen/import-van-levensmiddelen-en-consumentenproducten.
- plant products: Veterinary checks are applicable to some plant products, especially hay and straw.
These products may only be imported from certain countries. More detailed information on the import procedure of plant products can be found https://english.nvwa.nl/topics/themes/plant-health and
https://www.nvwa.nl/onderwerpen/import-planten-groenten-fruit-plantaardige-producten.
The CITES regulations (CITES: Convention on International Trade in Endangered Species of wild flora and fauna) are, in addition to the national and EU legislation, applicable on the import of live animals, animal products, food and plant products into the Netherlands.
Below is an overview of the possible checks:
- Documentary check: This is an examination of the original required documents that accompany the consignment based on model certificate according to EU legislation, carried out by Customs based on an agreement between Ministry of Economic Affairs and the Ministry of Finance.
- Identity check: This is to ascertain that the products correspond to the information given in the
accompanying certificates or documents. All veterinary goods undergo an Identity check and this check is conducted by comparing the seal number of the container with the seal number mentioned on the Health Certificate. If no seal number is mentioned on the Health Certificate, the veterinary authorities will need to open the shipment to conduct the Identity check.
- Physical check: This is a check on the product itself to verify compliance with the food or feed law.
When the NVWA decides to detain a shipment, it will draw up an official notification which will be sent to the freight forwarder. This notification will mention the reason why this shipment was detained and what needs to be done in order to release it. If the NVWA plans to reject a shipment it will draw up this notification; if the NVWA has decided to reject a shipment it will draw up this notification.
SECTION III. MARKET SECTOR STRUCTURE AND TRENDS
Food Processing Industry
The Dutch food processing industry is valued at $69.8 billion and employs just over 135,000 people. The sector not only caters to consumers in the Netherlands but has clients in all neighboring countries and beyond. On the sourcing side, Dutch food companies not only depend on Dutch growers but also those abroad, including the United States. It is a small country geographically but the food traders and processors are here. For more information, please download the NL4029 Food Processing Ingredients GAIN Report.
Food Retail Industry
The Dutch retail sector is characterized by heavy consolidation, the top two retailers control over 50 percent of the market, and a large number of smaller neighborhood stores. Consumers are increasingly looking for sustainable or organic products and more ready-to-eat meals and convenience products. For 2017, the turnover is expected to increase further due to the improving economy in the Netherlands and greater confidence in the economy among consumers. For more information, please download the NL5023 Food Retail GAIN Report.
Food Service Industry
The Dutch foodservice industry is expected to grow annually by over two percent due to a recovering economy and changing consumer eating culture. The growing segments within the foodservice industry are especially the specialist coffee shops, juice/smoothie bars and food trucks. Young consumers are increasingly looking for new and convenient food solutions. U.S. food product with clean ingredients and healthy food products have the best sales potential on the Dutch market. For more information, please download the NL6014 Food Service - Hotel Restaurant Institutional GAIN Report.
Each of the above mentioned reports provides an assessment of the market opportunities for U.S. consumer-oriented and fishery products on their respective Dutch market. The reports also summarize the key
SECTION IV. BEST HIGH-VALUE PRODUCT PROSPECTS
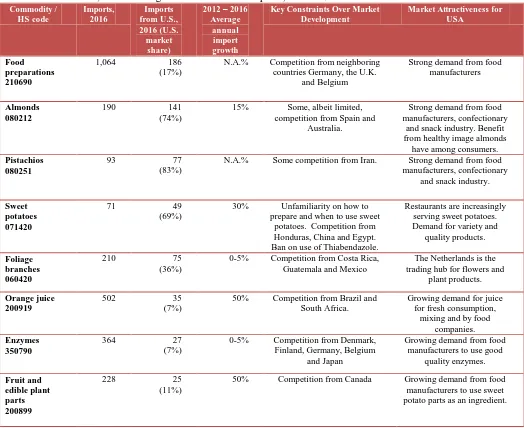
Table 5 provides an overview of the products that offer the best opportunities for U.S. exporters on the Dutch market. The table gives a brief overview of the size of the market the average annual growth rate, key constraints and market attractiveness for U.S. exporters.
Table 5. Netherlands, The Best High-Value Products Prospects, million $ Commodity /
Key Constraints Over Market Development
N.A.% Competition from neighboring countries Germany, the U.K.
and Belgium
Strong demand from food manufacturers
Almonds 080212
190 141
(74%)
15% Some, albeit limited, competition from Spain and
Australia.
Strong demand from food manufacturers, confectionary
and snack industry. Benefit from healthy image almonds
have among consumers. Pistachios
080251
93 77
(83%)
N.A.% Some competition from Iran. Strong demand from food manufacturers, confectionary
30% Unfamiliarity on how to prepare and when to use sweet
potatoes. Competition from Honduras, China and Egypt. Ban on use of Thiabendazole.
Restaurants are increasingly serving sweet potatoes. Demand for variety and
quality products.
0-5% Competition from Costa Rica, Guatemala and Mexico
The Netherlands is the trading hub for flowers and
plant products.
Orange juice 200919
502 35
(7%)
50% Competition from Brazil and South Africa.
Growing demand for juice for fresh consumption,
mixing and by food companies. Enzymes
350790
364 27
(7%)
0-5% Competition from Denmark, Finland, Germany, Belgium
and Japan
Growing demand from food manufacturers to use good
quality enzymes.
50% Competition from Canada Growing demand from food manufacturers to use sweet potato parts as an ingredient.
Source: World Trade Atlas
SECTION V. KEY CONTACTS AND FURTHER INFORMATION
U.S. Department of Agriculture’s Foreign Agricultural Service Office of Agricultural Affairs
Marcel H. Pinckaers
Embassy of the United States
Lange Voorhout 102, 2514 EJ The Hague, The Netherlands Phone: +31 (0)70 3102 305
[email protected] www.fas.usda.gov
This OAA also covers the countries in the Nordic market and prepared Exporter Guides for the following countries: Denmark, Finland and Sweden.
Trade shows are excellent venues for U.S. exporters to make contact with potential Dutch buyers, to conduct product introductions and to gauge buyers’ interest. Depending on the products, U.S. exporters should consider visiting or exhibiting at one of the many trade shows in Europe. A detailed overview of trade shows can be found in below table.
Table 6. Trade shows in Europe
Show When Show Details
ANUGA, Cologne, Germany
Europe’s largest food & beverages show in 2017 *USDA Endorsed*
Food Ingredients Europe, Frankfurt, Germany European food ingredients show
*USDA Endorsed*
International Confectionary Fair (ISM), Cologne, Germany
ProWein, Dusseldorf, Germany
Europe’s largest wine trade show in 2017 Contact: Hanna Khan
+49 3083 05 1152
March 18 – 20, 2018 Annually
prowein.com
PLMA, Amsterdam, The Netherlands World’s largest private label show Contact: Marcel Pinckaers +31 70 3102 305
May 28 – 30, 2018 plmainternational.com
Source: FAS The Hague
Foodservice Industry Organization: FoodService Instituut Nederland (FSIN) Galvanistraat 1, 6716 AE, Ede, the Netherlands Phone: +31 88 730 48 00
[email protected] www.fsin.nl
Food Retail Organization:
Centraal Bureau of Levensmiddelen (CBL)
PO Box 262, 2260 AG, Leidschendam, the Netherlands Phone: +31 70 337 6200
www.cbl.nl
Food Processing Organization:
Federatie Nederlandse Levensmiddelen Industrie Schenkkade 50 – 13th
2595 AR, The Hague, the Netherlands Phone: +31 70 336 5150
Appendix A. Key Trade & Demographic Information
2016 Figures
Agricultural, Fish and Forestry Imports From All Countries ($ Million) / U.S. Market Share (%)
59,212 / 5.0
Consumer Oriented Food Imports From All Countries ($ Million) / U.S. Market Share (%)
30,799 / 4.0
Fish and Seafood Imports From All Countries ($ Million) / U.S. Market Share (%)
3,233 / 4.0
Population (Million) / Annual Growth Rate (%) 17.1 / 0.5
Number of Major Metropolitan Areas One area, the so-called Randstad which covers Amsterdam, Rotterdam, The Hague and Utrecht
Per Capita Gross Domestic Product ($) 45,923
Unemployment Rate (%) 6.0
Appendix B. Consumer-Oriented & Fish Products Imports
Netherlands’ Imports of Consumer Oriented Products – by Product Group
Commodity Description United States Dollars
2014 2015 2016
HS code 32.802.936.501 30.395.010.678 30.798.799.664
210690 Food Preparations 1.053.499.232 1.028.762.104 1.063.664.707
220421 Wine 1.097.688.212 943.552.703 941.193.570
020130 Meat Of Bovine Animals 865.473.000 911.702.774 939.161.794
080610 Grapes 1.003.541.578 830.782.126 799.868.248
060311 Fresh Cut Roses And Buds 637.499.892 714.723.124 718.526.212
180690 Cocoa Preparations 760.587.491 679.442.319 696.503.499
040690 Cheese 723.549.415 658.448.485 640.582.535
080440 Avocados 333.927.257 403.417.439 632.129.567
190590 Bread, Pastry, Cakes 585.577.751 541.302.730 560.092.236
200919 Orange Juice 568.713.933 528.474.528 502.038.579
160232 Chicken Meat 532.834.312 579.089.258 482.654.576
080390 Bananas 320.226.224 412.965.358 449.690.568
230910 Dog And Cat Food 434.632.713 415.980.024 440.219.525
090121 Coffee 470.711.684 421.841.246 436.502.523
021099 Meat & Offal 539.525.551 452.174.914 411.674.028
080132 Cashew Nuts 323.359.962 384.307.954 410.560.014
040510 Butter 340.257.259 348.207.970 389.442.957
080510 Oranges 374.711.356 375.072.668 387.201.288
080550 Lemons And Limes 265.404.826 245.599.650 381.435.692
020713 Chicken Cuts 303.891.056 333.664.242 376.090.638
Other Products 21.267.323.797 19.185.499.062 19.139.566.908
Source: World Trade Atlas
Netherlands’ Imports of U.S. Consumer Oriented Products – by Product Group
Commodity Description United States Dollars U.S. Market Share, %
2014 2015 2016 2014 2015 2016
HS code 1.133.784.163 1.231.042.186 1.228.985.057 3 4 4
210690 Food Preparations 183.414.974 187.047.017 186.264.988 17 18 17
020130 Meat Of Bovine
Animals
102.629.024 162.411.660 145.660.305 12 18 16
080212 Almonds 134.605.378 152.227.012 140.703.377 70 70 74
080251 Pistachios 82.619.731 96.632.142 76.772.842 82 84 83
060420 Foliage Branches 60.674.820 61.935.435 75.465.090 28 29 36
080290 Nuts 32.702.294 37.217.423 50.692.687 46 44 49
200893 Cranberries 65.110.364 63.230.417 44.862.872 74 70 59
200919 Orange Juice 4.463.015 10.787.312 34.981.372 1 2 7
220290 Nonalcoholic
Beverages
33.731.186 27.113.517 31.069.270 10 14 14
200290 Tomato Paste 33.508.179 34.729.743 28.924.871 26 27 27
350790 Enzymes 17.936.069 24.298.178 27.499.667 5 7 7
200899 Fruit & Edible
Plant Parts
6.431.552 13.659.708 25.465.189 3 7 11
080540 Grapefruit 31.951.204 24.844.854 21.144.603 21 16 14
180690 Cocoa Preparations 26.348.097 16.006.836 20.830.153 3 2 3
Source: World Trade Atlas
Netherlands’ Imports of Fish & Seafood Products – by Product Group
Commodity Description United States Dollars
2014 2015 2016
HS code 3,560,067,542 3,069,639,626 3,233,369,202
030617 Shrimps And Prawns 403,762,623 369,974,042 358,188,220
030471 Cod Fillets, Frozen 259,675,904 218,729,774 240,937,644
160414 Tunas/Skipjack/Bonito 246,702,453 179,520,433 215,388,976
030363 Cod, Frozen 164,203,435 173,851,516 184,884,743
160521 Shrimp & Prawns 161,929,999 75,359,475 119,773,330
030562 Cod, Salted Or In Brine 101,637,817 101,726,957 99,608,700
030729 Scallops 71,418,722 81,519,580 94,545,134
160529 Shrimp/Prawns 131,785,200 118,266,081 87,966,675
030214 Atlantic Salmon 96,507,010 79,858,285 86,358,230
030354 Mackerel 108,723,561 89,690,170 82,280,423
030449 Fish Fillets 102,077,600 79,645,660 80,350,547
030475 Alaska Pollock Fillets, Frozen 57,540,682 68,575,546 69,776,485
030489 Fish Fillets, Frozen 64,126,457 62,092,730 62,952,668
030532 Fish Fillets, Nesoi 87,002,682 66,604,873 60,125,410
030389 Fish, Frozen 48,457,259 56,961,303 58,165,619
Source: World Trade Atlas
Netherlands’ Imports of U.S. Fish & Seafood Products – by Product Group
Commodity Description United States Dollars U.S. Market Share, %
2014 2015 2016 2014 2015 2016
HS code Group 9 (2012) 121,436,952 139,544,070 131,434,519 3 5 4
030475 Alaska Pollock Fillets 41,984,721 46,713,354 45,431,778 72 68 65
030729 Scallops 31,186,140 36,868,422 34,426,346 44 45 36
030363 Cod 18,994,690 21,647,781 11,019,038 12 12 6
160521 Shrimp & Prawns 375,530 1,336,459 7,935,511 0 2 7
030311 Sockeye Salmon 4,760,411 4,503,014 5,175,704 99 96 90
Appendix C. Top 15 Suppliers of Consumer Foods and Edible Fishery Products
Netherlands’ Imports of Consumer Oriented Products – by Partner Country Partner Country United States Dollars
2014 2015 2016
Germany 6,327,941,658 5,330,505,654 5,295,490,095
Belgium 4,341,319,529 4,121,440,982 4,190,205,905
Brazil 1,955,205,839 1,757,793,833 1,706,349,006
France 2,079,988,582 1,687,451,252 1,672,012,388
Spain 1,618,920,691 1,521,400,059 1,521,601,626
United States 1,133,784,163 1,231,042,186 1,228,985,057
United Kingdom 1,345,448,676 1,235,743,254 1,069,871,331
South Africa 1,052,533,613 976,377,005 1,053,193,773
Italy 1,087,227,740 989,580,525 988,111,350
Poland 905,325,433 919,737,865 811,011,161
Chile 765,002,337 707,140,235 769,140,791
Ireland 603,064,246 648,730,873 660,507,423
Peru 478,291,317 530,457,126 619,507,391
China 550,298,086 543,187,833 543,209,313
Thailand 539,907,160 548,479,832 525,788,145
Other 8,018,677,431 7,645,942,164 8,143,814,909
World 32,802,936,501 30,395,010,678 30,798,799,664
Source: World Trade Atlas
Netherlands’ Imports of Fish & Seafood Products – by Partner Country Partner Country United States Dollars
2014 2015 2016
Iceland 375,051,703 359,944,160 414,125,730
Germany 301,350,408 278,385,605 296,312,175
Russia 257,373,226 233,925,180 245,462,630
Norway 212,122,547 205,788,983 207,437,352
Belgium 263,281,428 191,842,707 187,794,122
Vietnam 133,411,365 142,401,774 167,961,179
China 149,937,684 106,492,806 136,966,047
United States 121,436,952 139,544,070 131,434,519
Turkey 133,893,783 123,659,772 125,104,486
India 109,710,298 115,659,732 118,184,498
Ecuador 134,164,148 95,898,903 101,250,323
Morocco 137,362,638 116,839,783 98,810,634
United Kingdom 119,136,860 101,147,125 92,347,734
Bangladesh 84,024,870 82,417,681 77,077,333
Other 887,070,247 679,743,568 742,239,664
World 3,560,067,542 3,069,639,626 3,233,369,202