SOCIO-ECONOMIC BASELINE
Prepared by
Richard B. Pollnac
December 2005
THAILAND POST-TSUNAMI SUSTAINABLE COASTAL
LIVELIHOODS PROGRAM
A Program of the Leader with Associates Cooperative Agreement on
Sustainable Coastal Communities and Ecosystems (SUCCESS)
Implemented by the Coastal Resources Center, University of Rhode Island
in partnership with the Asian Institute of Technology and the University of
Hawaii
Funded by:
Table of Contents
1. Fishing Gear Types and Use 4
2. Attitudes Towards the Occupation of Fishing 17
3. Investment Orientation 22
4. Perceptions of Coastal Resources and Factors Related to Their Management 29
5. Perceptions of Changes in Well-Being 36
Foreword
These 6 baseline reports were prepared for the USAID Post-Tsunami Sustainable Coastal
Livelihoods Program at the outset of the program. They are prepared under the supervision of Dr. Richard Pollnac, University of Rhode Island, with the assistance of Dawn Kotowicz. The
findings from the reports are based on household survey data from 5 villages in Kamphuan Tambon, Ranong Province. The field work was conducted in June and July 2005. A final synthesis report, with additional details on survey methods is also being prepared.
The purpose of the socio-economic assessment is to provide information and recommendations to enhance the impact of Tsunami recovery project activities. The information in these reports, combined with an end of project assessment are critical to capture lessons learned from the USAID Post-Tsunami Sustainable Coastal Livelihoods Program and use the project area as a demonstration project for replication in other disaster areas.
PRELIMINARY BASELINE REPORT #1
FISHING GEAR TYPES AND USE IN FIVE COASTAL VILLAGES,RANONG,THAILAND
INTRODUCTION
Natural disasters often involve recovery activities that are based on current, or previous, occupational practices. To adequately design fishery recovery programs, gear type and frequency should be assessed in the affected community, or communities. The following is a description of each type of fishing practiced in the tsunami affected communities as described by key informants and survey results of gear type use in each household.
Coastal Activities
Most farming activities take place away from the coast. Some cashew nut and a few fruit tree plantings were seen near the coast, but they are in the minority. For the most part, the coastal area is devoted to fishery activities, both in the mangrove, along the beach and in the open sea. The fishery includes both the capture fishery and aquaculture.
Capture fishery - Fishing gear
The relatively close proximity of the five project villages resulted in exploitation of approximately the same offshore waters, resulting in similarity in the capture fishery. Additionally, all villages have ready access to mangrove areas. Although the size of the mangrove area varies from village to village, the species targeted are quite similar. Similarity in coastal features also leads to similarity in coastal gears used. The only difference noted in the rapid assessment was that amount of mangrove between the residential area and the beach apparently influenced the use of push nets. This will be discussed below.
Ideally, a rapid assessment of the capture fishery is based on both interviews of key informants and observation. The tsunami washed away some gears; hence, observation was less reliable as a back-up for interview error. Interview error is often introduced when requesting an informant to list the fishing types. Frequently, a type out of season will not be mentioned, and observation is used to identify unmentioned gears.
The fishery in the five project villages can be classified as relatively small scale (see Pollnac and Poggie 1991), where mechanization is minimal with motors for relatively small boats (usually less than 13 meters long) and minimal use of winches for pulling gear such as traps. Cost of boats and gear is such that most fishers own their own gear, and if they do not, they can accumulate sufficient capital for purchase in a matter of a few years or obtain a loan from a fish buyer on reasonable terms.
Given the observation that the fishery can be classified as a small-scale fishery, the gears deployed cover most of the wide range of gears deployed by small-scale fishers around the world. Monofilament gill nets (both fixed and drifting), hook and line, and long lines are used for finfish; tangle nets for crab and shrimp; traps (pots) for finfish, squid and crabs; small push nets and small seines for tiny shrimp; spear guns and harpoons for fish and cephalopods; prying devices and bare hands for shellfish. No fixed gear such as weirs and stationary lift nets were observed or mentioned although they could have been destroyed by the tsunami. It should be noted that most fishers own and use multiple gear types; thus, they are able to respond to seasonal changes and market demand.
Buyers from 3 of the 5 villages were interviewed to determine the most important types harvested. There are no buyers now in Villages 1 and 2, but a fisher was requested to provide the information for Village 1, and buyers from Village 3 and 7 are now purchasing fish from fishers in village 2. Squid, swimming crab, and silver sillago were among the top 4 in all five villages. Squid was ranked as first in importance in three of the five, silver sillago as first or second in three, swimming crab as second in two, and shrimp as third in four of the five villages. Gears for capturing these types and others are described below.
Silver sillago The net used for pla sai is typically about 75 wah (arm spans)1 in length and a meter deep, with a mesh size about 3-4cm (1.5”). Some fishers attach an extra 40 or so wah length of netting to take total length up to about 110 wah. The nets are deployed during the dry season anywhere from around the islands just offshore (e.g., Koh Kam, about 10Km or 1.5 hours sailing time from Villages 2,3,4,and 7) to the Surin Islands (only during the dry season as reported by one fisher who leaves Village 7 at midnight, deploys the following morning and returns at 9pm). Depending on the fisher and the weather, the net is deployed and pulled 4 to 6 times per trip. Soak time is approximately 1 to 2 hours. Boats used to deploy the net range from 6 to 11+ meter long tails.
Average catches vary with net size—the larger net averaging 40-50Kg and the smaller 30-40Kg per trip. Minimum catch for the larger net is 10-20Kg and for the smaller 10Kg. Maximum catch was reported to be 120Kg for both sizes. Average price paid to the fisher varies between 50 and 60Bh2 per Kg. Fishers report that catches have declined over the past 5 years, with one fisher reporting a 50 percent drop.
Total crew size (owner-captain and crew) ranges from 3 to 4 (4 on larger boats), usually kinsmen. The lay system appears to vary more than in other fisheries; here it was reported that the owner share varies from 50 to 75% after expenses are deducted (only one owner said 50%), with the crew sharing the rest.
Jacks The net (wun twong) used for pla mong (jacks and trevallys--CARANGIDAE) is composed of four 40m long by about 6m deep nets for a total of 160m (about 95 wah) by 6m of 4.5” mesh net. The net is deployed during the monsoon season (June to September) behind Koh Kam, for about 6 hours soak time. Boat used to deploy the net is a 12m long tail.3
Average catch is 40Kg with a maximum of 100 and a minimum of 12. Prices paid average between 20 and 40Bh per Kg. Catch over the last 5 years has decreased greatly resulting in 2 to 3 times the effort to catch the same amount of fish.
Total crew size (including owner-captain) is three, sometimes kinsmen and sometimes not. Lay system is 70 percent (after expenses) for the owner-captain and 30 percent split among the rest of the crew.
General Fishers without a boat were observed deploying this type of net in shallow estuary and mangrove channel waters. In Village 2, fixed gill nets (mesh 2-3”) are extended between stakes (30-50m apart), perpendicular to the shoreline to capture “large” fish. Harvest is conducted at low tide.
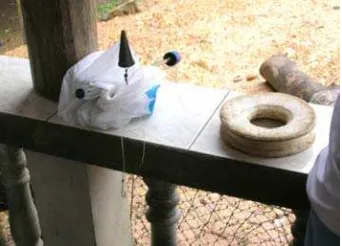
Hand Line The hand line most frequently used targets fin fish, with the most important being silver sillago (pla sai), Indo-Pacific king mackerel (pla in-si), bare-breast jack (pla mong) and John’s snapper (pla kapong daeng). The rig usually consists of a carved wooden or plastic spool to hold the line, a conical lead weight with a swivel attached to the bottom, two lines, each with a hook at the end, about 8 inches long tied to the swivel ring (see figure 3). The rig is baited (some say with shrimp) and dropped to the appropriate level for the target fish and left in the water until the fisher feels a strike. It was reported that most households practice this type of fishing, usually during the dry season. A fisher from Village 1 reported that many were out using this gear when the tsunami struck. Any size long tail boat can be used in this fishery since the gear takes little space.
1
Technically 1 wah equals 2 meters, but fishers informally measure a wah as an arm span (outstretched arms, about 1.7 meters—a measure somewhat like the English “fathom”)
Average catch is reported to be between 4 and 10kg, with one fisher reporting 10kg as the maximum. Price paid for hook-caught pla sai is reportedly 100 to 110Bh/Kg. In line with the reported catch trend for pla sai with net, the catch has reportedly decreased over the past five years.
Crew size varies between 1 and 3, probably depending on boat size and is usually composed of kinsmen, sometimes parents and children. Each fisher keeps his or her own catch and expenses are shared (if not a nuclear family fishing).
Long lines According to an informant in Village 7, only a few fishers from the village deploy long lines— it is usually done by commercial fishers (for a somewhat different discussion of long lines in Village 7, see Macintosh, et al. 2002). According to the informant, the long line consists of a long line with 120 to 140 hooks attached on leaders. A float marks where each long line enters the water. Target fish are pla in-si (Indo-Pacific Mackerel) and rays. Pieces of fish (usually mackerel) are used as bait for pla in-si, but the bare hook is used for ray. The line is deployed into the waters 4 to 6 miles around the offshore islands, usually for about 3 hours before retrieval. This type of fishing is conducted during the dry season. Long tail boats deploy this type of gear.
Average catch for pla in-si is about 100kg and for rays about 180kg; prices paid are about 100Bh/kg and 20Bh/kg respectively. We did not obtain information on catch trends for this type of fishing, but a buyer reported that catch of mackerel is decreasing, but a bit less in the past two years.
Shrimp net The shrimp net has three layers of mesh—the two outer layers are about 7cm mesh and the inner about 2cm mesh—it is basically a tangle net. Although the target is shrimp, it entangles many other species, which are also harvested and sold. Since fishers tie together 10 or more smaller nets per
deployable shrimp net, information concerning total length is variable, ranging from 40 to 60 wah long and about 1.5 meters deep. Fishers report deploying several of these nets (usually around 4) on or very close to the bottom and cross current. The shrimp drift into the net. One fisher reports setting the net in the evening and retrieving it the next morning; another sets it for about 30 minutes, pulls it, and if the catch is good, deploys it again in the same place. Nets are deployed anywhere from 100m offshore to 10km (behind Koh Kam), with the smaller shrimp being caught close to shore. The nets are set from long tail boats.
Average harvest for four nets is reported to be 20-30Kg, maximum 80-120Kg, and minimum 4-20kg. The wide range may be due to variation in net length. Prices paid vary greatly according to size and demand, but the smallest sell for about 50-110Bh/kg, the middle sized for 75-150Bh/kg, and the largest 110-190Bh/kg. Shrimp catches are reported to be decreasing. One fisher has maintained harvest levels by increasing effort (time and more efficient net). A buyer in Village 7 reported a 30 percent decrease in harvest, while a Village 4 buyer noted a large decrease.
Crew size is usually 3 kinsmen—sometimes the owner and two offspring of either sex. Share system after expenses are deducted is reported to be 60 percent to the owner and 20 percent to each of the other two crewmembers.
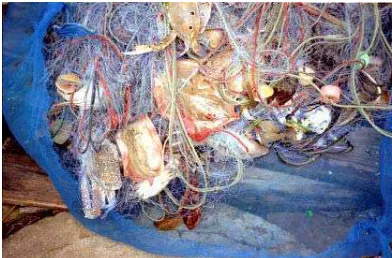
Crab net The crab net is a single layer,
Figure 5. Rectangular crab trap.
boat were observed deploying this type of net in shallow estuary and mangrove channel waters.
Catches with these nets vary widely in terms of species and amount of crab. A 15 wah net is reported to produce an average catch of 20-30kg, with a maximum of 50kg and a minimum of 10kg. Prices and
trends for crab are listed in the section on crab traps.
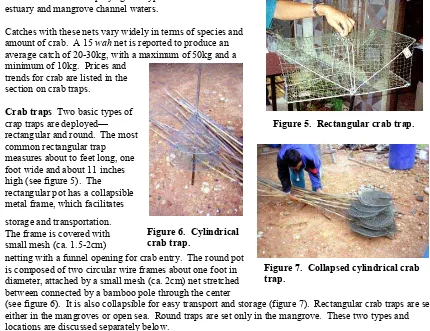
Crab traps Two basic types of crap traps are deployed— rectangular and round. The most common rectangular trap measures about to feet long, one foot wide and about 11 inches high (see figure 5). The rectangular pot has a collapsible metal frame, which facilitates
storage and transportation. The frame is covered with small mesh (ca. 1.5-2cm)
netting with a funnel opening for crab entry. The round pot is composed of two circular wire frames about one foot in diameter, attached by a small mesh (ca. 2cm) net stretched between connected by a bamboo pole through the center
(see figure 6). It is also collapsible for easy transport and storage (figure 7). Rectangular crab traps are set either in the mangroves or open sea. Round traps are set only in the mangrove. These two types and locations are discussed separately below.
Rectangular crab traps—open ocean Crab traps (same as in figure 5) deployed in the open ocean are baited with chopped fish (one informant reported using fresh chopped hard-tail scad (kang kai) connected by a single line and dropped some 10 to 30m to the bottom
forming a serpentine line of crab traps. The minimum traps per line were reported to be 300 with a maximum of 1000. Traps are deployed about 2 hours sailing time from the village (about 10k). Traps remain on the bottom for 5 to 6 hours, then are pulled using a small powered winch. Reportedly, each trap can catch up to 3 or 4 crabs. Size of long tail boat used depends on number of traps deployed, but they are usually greater than 10m.
Average harvest for a line of 1000 traps is reported to be 40-50kg, maximum 100kg and minimum 30kg. Prices paid for the biggest size (8-9 per kg.) start at 105Bh, medium size
(about 14 per kg.) 60Bh and the smallest (about 20 or more per kg.) 40Bh/kg. Reports concerning trends are variable. Colorful garlands draped on the bow of the boat are for protection and good luck (see figure 8). One fisher reported adding a garland when the catch exceeds 6000Bh in value.
Crew size for a large operation is reported to be four—owner operator and three crewmembers. Crewmembers are usually related to the owner. The owner operator usually gets 73 percent of the catch after expenses, and each of three crewmembers receive 9 percent. If catches are low, one owner reported he gives each crewmember 300-400Bh instead of the 9 percent share.
Figure 8. Garlands on crab boats. Figure 7. Collapsed cylindrical crab trap.
Rectangular and round crab traps—mangroves Mangrove fishers usually set some 70 to 150 crab pots in the mangroves. They are baited with “trash fish”, individually set at high tide and collected at low tide. Some set the traps in the evening and retrieve them in the morning. A float marks the location of the rectangular trap, which is pulled by hand. Round traps are marked by the bamboo pole to which they are attached. These traps are usually deployed from a small, gasoline engine powered, long tail boat (ca. 4-5m). Often the boat is used to take the fisher to a desired area where he walks into the mangroves to place the traps.
Average catches are reported to be between 3 and 10kg/day, with a minimum of only one kg/day. Prices paid for the mud crab vary somewhat, with the small size selling for 30-60Bh/kg, the middle size about 60Bh/kg and the large 80-90Bh/kg. Crab trapping in the mangroves is usually an individual activity due to the small size of vessel used and characteristics of the methods used. No more than one fisher is necessary to carry out the activity.
2.4.1.1.7. Squid traps Squid traps are cylindrical in shape, approximately 1m wide and 1.25m long with a flattened bottom. The frame is made of lengths of a flexible tree branch (ca. 2cm diameter) cut in the forested hills. A rectangular base is formed and three boughs are attached and bent to form the cylindrical shape. Five more boughs are nailed along the length of the cylinder to provide support. Within the frame, two boughs are attached to form a triangular shape from the flattened bottom to the mid-point on the cylinder for attaching bait (see figure 9). The frame is covered with a multifilament mesh (ca 4cm) that has a conical opening for squid entry. Stones are used as weight in the pot which is dropped to a
depth that averages 10-30m but can reach 50m. Pots are marked by floats (several liter plastic jug) and sets of pots (about 3) are marked by a pole with a flag (floated and partially weighted with a 1-1.5 liter plastic bottle). Soak time is about 12 hours. Pots are either pulled by hand or with a small gasoline engine (ca. 10hp) powered winch. A fisher with a winch deploys 50-60 pots/day, without a winch about 20 pots a day. Fishers may deploy over 100 pots on a multi-day trip. One fisher interviewed uses a GPS to plot location of deployed pots. Boat size and season determine location of deployment. A large boat can deploy pots as far offshore as the Surin Islands (ca 50km) during the non-monsoon season. During the monsoon season pots are deployed closer to shore (10-15k). Most fishers with smaller boats deploy around the offshore islands (10-15k).
Average harvests vary between 20 and 40kg with highs of 50-70kg. Prices paid vary widely but seem to be between 70-80Bh/kg. Reported crew sizes vary between 2 and 4. Share system varies between 50 to 60 percent for the owner operator and the rest shared by the crew. Crewmembers are usually relatives or neighbors. The trend in harvests over the past 5 years is reportedly stable, but one fisher reported an increase last year.
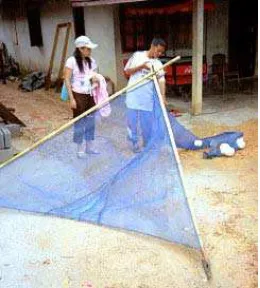
2.4.1.1.8. Other fishing gears The rapid assessment method limited the amount of information that could be collected, and the focus was on the most important fisheries discussed above. Other fisheries, some which were discovered too late to be investigated in all communities, were not as thoroughly investigated. These other fisheries, represented by fishing gears such as shrimp push nets and mini-seines, fish traps, spear guns, harpoons, and other methods will be briefly discussed in this section.
Figure 10. Small shrimp push net.
crossed near the top where the fisher holds onto the net as it is pushed through the water (see figure10). It is similar to push nets used to collect small aquatic organisms in inshore areas worldwide. The target is a small shrimp, which is converted into shrimp paste. Although this push net is reportedly used in all villages except Village 3, Village 1 was the only village where they were seen stored by numerous houses. Both males and females operate this gear.
Shrimp mini-seine net The shrimp mini-seine net targets the same shrimp targeted by the push net. It is basically a very small mesh bag (approximately 3 wah wide), with larger multifilament mesh (ca. 2cm) wings (each approximately 4 wah) that extend from each side of the smaller bag to guide the shrimp into the bag. This type of net was found only in Village 4. Both genders are said to operate this type of net.
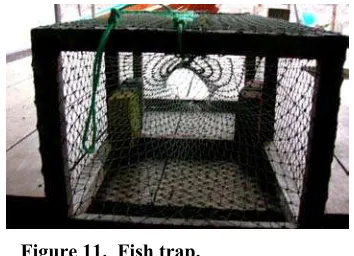
Fish traps Several types of fish traps are used by the project villagers. The main target is small grouper in the
mangroves which are then grown out in cages (see figure 11). Fish traps observed are round (approximately 24cm diameter and 60cm long) or rectangular (ca. 35cm square and 60cm long), both covered with small mesh (2-3cm multifilament) with a conical entry way for fish entry. Some slightly larger traps were observed as well. These traps are set in the mangroves to trap grouper.
A very large rectangular trap (2.75m square and 3.15m deep) with a wooden frame and chicken fence wire mesh
was reported in Village 2. Only one survived the tsunami, but it is not being used at the present time. They were set any where from 3km from shore on rock bottom or out on the artificial reef. Target fish were reported to be “big” and pla mong (jacks and trevallys--CARANGIDAE) were used as an example.
Spear gun, harpoon and noose Use of a spear gun was only reported in village 2. Only a couple of fishers reportedly used this method. One, who had an Italian built spear gun, lost it in the tsunami. Another, who made a spear from a steel rod and used a rubber sling to fire it, still uses it in the mangrove. Harpoons were mentioned in Villages 2 and 7. The principal target is eel, which can also be captured live with the use of a noose.
Collecting shellfish Most households collect mollusks in the mangroves and on the tidal flats during low tide. This can be done by hand or with a prying device (an old knife, a long flat piece of metal). Both males and females are involved in this activity. Macintosh, et al. (2002) provide a list of mollusk species used in the Ranong mangrove ecosystem, and we asked a village informant to indicate those collected and used by local families. The species collected and used by village households are: hoy nang rom (Oyster, Crassostrea commercialis), hoy marang poo (green mussel, Perna viridis), hoy wan (poker chip venus, Meretrix lusoria), hoy chak tin (Strombus sp.?), hoy jub jeng (Cerithidea rhizophorarum, and hoy kem (nerites, Nerita articulate). We observed, but unfortunately were unable to identify, some shells collected for the ornamental trade.
Introduction of Analysis
Recovery efforts to reinstate livelihoods are important to build capacity within communities to recovery on their own by enabling people to begin providing food and income for themselves and their families. When designing livelihood projects for fishing communities, it is essential to understand the type and distribution of gear used in the fishery pre-disaster as well as post-disaster, if any. This information may inform project designers and managers to implement projects that are better suited for the recovering community. These projects are then more likely to have greater participation and longer life spans after outside assistance with the project ends.
Our household survey gathered information on gear type use and contribution to household food and income. We asked respondents to list all gear types/fishing types that they practiced in a given year and to
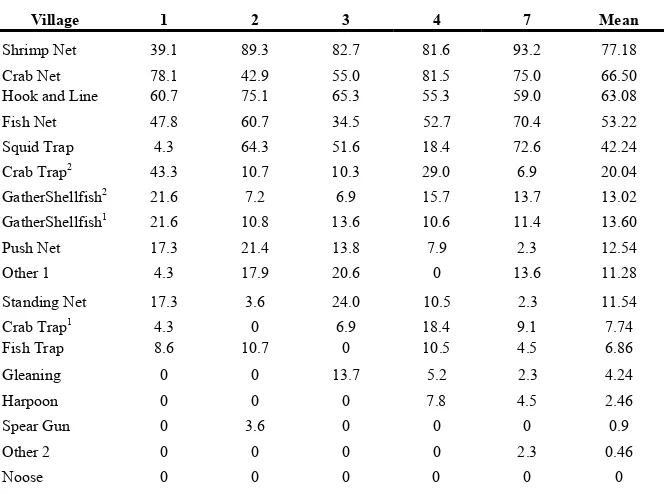
Table 1. Fishing type percent distribution overall
Village 1 2 3 4 7 Mean
Shrimp Net 39.1 89.3 82.7 81.6 93.2 77.18
Crab Net 78.1 42.9 55.0 81.5 75.0 66.50 Hook and Line 60.7 75.1 65.3 55.3 59.0 63.08
Fish Net 47.8 60.7 34.5 52.7 70.4 53.22
Squid Trap 4.3 64.3 51.6 18.4 72.6 42.24 Crab Trap2 43.3 10.7 10.3 29.0 6.9 20.04
GatherShellfish2 21.6 7.2 6.9 15.7 13.7 13.02
GatherShellfish1 21.6 10.8 13.6 10.6 11.4 13.60
Push Net 17.3 21.4 13.8 7.9 2.3 12.54
Other 1 4.3 17.9 20.6 0 13.6 11.28
Standing Net 17.3 3.6 24.0 10.5 2.3 11.54
Crab Trap1 4.3 0 6.9 18.4 9.1 7.74
Fish Trap 8.6 10.7 0 10.5 4.5 6.86
Gleaning 0 0 13.7 5.2 2.3 4.24
Harpoon 0 0 0 7.8 4.5 2.46
Spear Gun 0 3.6 0 0 0 0.9
Other 2 0 0 0 0 2.3 0.46
Noose 0 0 0 0 0 0
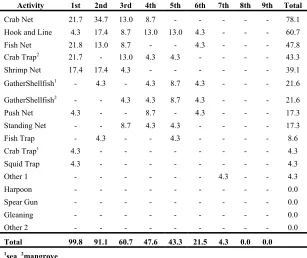
Table 2. Fishing type distribution Village 1 (Small Sample)
Activity 1st 2nd 3rd 4th 5th 6th 7th 8th 9th Total
Crab Net 21.7 34.7 13.0 8.7 - - - 78.1
Hook and Line 4.3 17.4 8.7 13.0 13.0 4.3 - - - 60.7
Fish Net 21.8 13.0 8.7 - - 4.3 - - - 47.8 Crab Trap2 21.7 - 13.0 4.3 4.3 - - - - 43.3
Shrimp Net 17.4 17.4 4.3 - - - 39.1
GatherShellfish1 - 4.3 - 4.3 8.7 4.3 - - - 21.6
GatherShellfish2 - - 4.3 4.3 8.7 4.3 - - - 21.6 Push Net 4.3 - - 8.7 - 4.3 - - - 17.3
Standing Net - - 8.7 4.3 4.3 - - - - 17.3
Fish Trap - 4.3 - - 4.3 - - - - 8.6
Crab Trap1 4.3 - - - 4.3
Squid Trap 4.3 - - - 4.3
Other 1 - - - 4.3 - - 4.3
Harpoon - - - 0.0
Spear Gun - - - 0.0
Gleaning - - - 0.0
Other 2 - - - 0.0
Total 99.8 91.1 60.7 47.6 43.3 21.5 4.3 0.0 0.0
1sea 2mangrove
As illustrated in Table 1, the most common primary fishing gear (ranked first) are crab nets, fish nets and crab traps set in the mangroves (each about 22 percent) for the sampled households in Village 1. Shrimp nets (17.4 percent) rank next most often as primary fishing gear. Other primary gear used in this village are crab traps set in the sea, squid traps, hook and line (or hand line) and a small shrimp push net. Crab nets (34.7 percent) are the most common gear ranked second for the households surveyed. Shrimp net and hook and line (each 17.4 percent) were ranked second by less than one-fifth and fish net was ranked second by 13 percent of households. Other secondary gear includes fish traps and gathering shellfish from the sea (each 4.3 percent). Crab nets and mangrove crab traps were each ranked third by 13 percent of the sample. Less than ten percent of households ranked fish nets, hook and line, and standing nets (8.7 percent) third for income and food generation. Other fishing types ranked third are shrimp nets and gathering shellfish from the sea. This table also shows that over ninety percent of the sample practice more than one type of fishing (91.1 percent), and almost two-thirds (60.7 percent) of households in the sample, use three types of fishing gear.
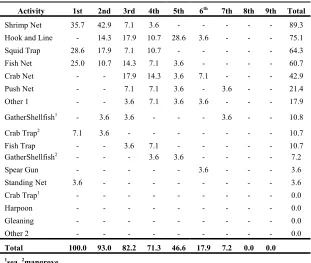
Table 3. Fishing type distribution Village 2
Activity 1st 2nd 3rd 4th 5th 6th 7th 8th 9th Total Shrimp Net 35.7 42.9 7.1 3.6 - - - - - 89.3
Hook and Line - 14.3 17.9 10.7 28.6 3.6 - - - 75.1
Squid Trap 28.6 17.9 7.1 10.7 - - - 64.3
Fish Net 25.0 10.7 14.3 7.1 3.6 - - - - 60.7
Crab Net - - 17.9 14.3 3.6 7.1 - - - 42.9
Push Net - - 7.1 7.1 3.6 - 3.6 - - 21.4
Other 1 - - 3.6 7.1 3.6 3.6 - - - 17.9
GatherShellfish1 - 3.6 3.6 - - - 3.6 - - 10.8
Crab Trap2 7.1 3.6 - - - 10.7
Fish Trap - - 3.6 7.1 - - - - - 10.7 GatherShellfish2 - - - 3.6 3.6 - - - - 7.2
Spear Gun - - - - - 3.6 - - - 3.6
Standing Net 3.6 - - - 3.6
Crab Trap1 - - - - 0.0
Harpoon - - - - 0.0
Gleaning - - - - 0.0
Other 2 - - - - 0.0
Total 100.0 93.0 82.2 71.3 46.6 17.9 7.2 0.0 0.0
1sea 2mangrove
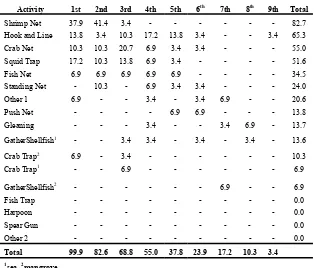
Table 4. Fishing type distribution Village 3
Activity 1st 2nd 3rd 4th 5th 6th 7th 8th 9th Total Shrimp Net 37.9 41.4 3.4 - - - 82.7
Hook and Line 13.8 3.4 10.3 17.2 13.8 3.4 - - 3.4 65.3
Crab Net 10.3 10.3 20.7 6.9 3.4 3.4 - - - 55.0
Squid Trap 17.2 10.3 13.8 6.9 3.4 - - - - 51.6
Fish Net 6.9 6.9 6.9 6.9 6.9 - - - - 34.5
Standing Net - 10.3 - 6.9 3.4 3.4 - - - 24.0
Other 1 6.9 - - 3.4 - 3.4 6.9 - - 20.6
Push Net - - - - 6.9 6.9 - - - 13.8
Gleaning - - - 3.4 - - 3.4 6.9 - 13.7
GatherShellfish1 - - 3.4 3.4 - 3.4 - 3.4 - 13.6
Crab Trap2 6.9 - 3.4 - - - 10.3
Crab Trap1 - - 6.9 - - - 6.9
GatherShellfish2 - - - 6.9 - - 6.9
Fish Trap - - - 0.0
Harpoon - - - 0.0
Spear Gun - - - 0.0
Other 2 - - - 0.0
Total 99.9 82.6 68.8 55.0 37.8 23.9 17.2 10.3 3.4
1
sea 2mangrove
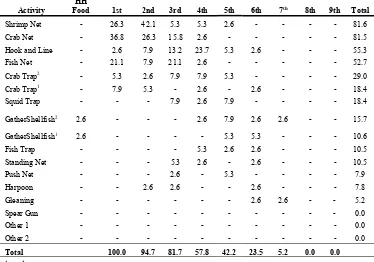
Table 5. Fishing type distribution Village 4
Activity
HH
Food 1st 2nd 3rd 4th 5th 6th 7th 8th 9th Total Shrimp Net - 26.3 42.1 5.3 5.3 2.6 - - - - 81.6
Crab Net - 36.8 26.3 15.8 2.6 - - - 81.5
Hook and Line - 2.6 7.9 13.2 23.7 5.3 2.6 - - - 55.3
Fish Net - 21.1 7.9 21.1 2.6 - - - 52.7
Crab Trap2 - 5.3 2.6 7.9 7.9 5.3 - - - - 29.0
Crab Trap1 - 7.9 5.3 - 2.6 - 2.6 - - - 18.4
Squid Trap - - - 7.9 2.6 7.9 - - - - 18.4
GatherShellfish2 2.6 - - - 2.6 7.9 2.6 2.6 - - 15.7
GatherShellfish1 2.6 - - - - 5.3 5.3 - - - 10.6
Fish Trap - - - - 5.3 2.6 2.6 - - - 10.5
Standing Net - - - 5.3 2.6 - 2.6 - - - 10.5
Push Net - - - 2.6 - 5.3 - - - - 7.9
Harpoon - - 2.6 2.6 - - 2.6 - - - 7.8
Gleaning - - - - - - 2.6 2.6 - - 5.2
Spear Gun - - - - - 0.0
Other 1 - - - - - 0.0
Other 2 - - - - - 0.0
Total 100.0 94.7 81.7 57.8 42.2 23.5 5.2 0.0 0.0
1sea 2mangrove
Table 6. Fishing type distribution Village 7
Activity 1st 2nd 3rd 4th 5th 6th 7th 8th 9th Total Shrimp Net 18.2 31.8 31.8 11.4 - - - 93.2
Crab Net 20.5 13.6 25.0 13.6 2.3 - - - - 75.0
Squid Trap 24.9 25.0 4.5 11.4 4.5 2.3 - - - 72.6
Fish Net 13.6 20.5 18.2 13.6 4.5 - - - - 70.4
Hook and Line 11.4 2.3 4.5 13.6 15.9 6.8 4.5 - - 59.0
GatherShellfish2 - 2.3 - - 2.3 4.5 2.3 2.3 - 13.7
Other 1 4.5 - - 2.3 2.3 4.5 - - - 13.6
GatherShellfish1 - - - 9.1 2.3 - - 11.4
Crab Trap1 4.5 - - - 2.3 2.3 - - - 9.1
Crab Trap2 - - 2.3 - 2.3 2.3 - - - 6.9
Fish Trap - - - - 4.5 - - - - 4.5
Harpoon - - - 4.5 - - 4.5
Push Net 2.3 - - - 2.3
Standing Net - - - 2.3 - - - 2.3
Gleaning - - - 2.3 - 2.3
Other 2 - 2.3 - - - 2.3
Spear Gun - - - 0.0
Total 99.9 97.8 86.3 65.9 40.9 34.1 13.6 4.6 0.0
1sea 2mangrove
Table 5 shows the fishing gear distribution as ranked by the surveyed households in Village 7. One quarter of the sample ranked squid traps (24.9 percent) first for food and income generation to the household. Crab nets (20.5 percent), shrimp nets (18.2 percent), fish nets (13.6 percent) and hook and line (11.4 percent) were each ranked first by ten to twenty percent of the households surveyed. Crab traps set in the sea and longlines (4.5 percent) were also ranked as the most important gear type in this sample. Push nets (2.3 percent) were ranked by two percent of the sample households as the primary gear type. Shrimp nets (31.8 percent) were ranked second by almost one third of the sample. One quarter of the households ranked squid traps second most important and one-fifth ranked fish nets (20.5 percent). Crab nets (13.6 percent) were also ranked second by over ten percent of surveyed households. Hook and line, gathering shellfish from mangroves and longlines (each 2.3 percent) were each ranked second in importance by just over two percent of the sample. It should be noted here that almost 98 percent of the sample ranked two or more types of fishing in Village 7. Shrimp nets (31.8 percent) and crab nets (25.0 percent) were each ranked third by at least one quarter of the surveyed households in income and food generation. Fish nets (18.2 percent) were ranked by over fifteen percent of households. Other gear ranked third, each by less than ten percent of households, is squid traps and hook and line (each 4.5 percent) and crab traps set in
mangroves (2.3 percent). No gear was ranked fourth by more than one-fifth of the surveyed households. Crab nets, fish nets and hook and line (each 13.6 percent) and shrimp nets and squid traps (11.4 percent) were all gear types ranked by between ten and fifteen percent of the sample. Longline (2.3 percent) was also ranked fourth by households in Village 7. Fifteen percent of the sample ranked hook and line (15.9 percent) fifth. The other gear types ranked fifth important to household food and income were all ranked by less than ten percent of the sample. This includes fish nets, squid traps, fish traps (each 4.5 percent), crab traps set at sea and in mangroves, gathering shellfish from mangrove areas and longlines (each 2.3 percent). Gathering shellfish from the sea (9.1 percent) was the most common fishing type ranked sixth in
CONCLUSION
PRELIMINARY BASELINE REPORT #2
ATTITUDES TOWARDS THE OCCUPATION OF FISHING IN FIVE COASTAL VILLAGES,RANONG,THAILAND
INTRODUCTION
Following the tsunami, many predicted that fishers would be reluctant to resume their fishing activities. Observations in the fishing communities, however, indicate that as soon as fishers obtained replacements for equipment damaged by the tsunami, they began to fish again. Nevertheless, it is possible that their attitudes towards the occupation might be affected. In order to determine fishers’ attitudes towards their occupation, we asked households with past or present involvement in the capture fishery the following five questions:
1. Would you advise a young person to become a fisher today? 2. Do you like fishing?
3. If you had the opportunity to change the primary source of your household’s income to one that provided the same amount of income as fishing, would you change?
4. There is no need to worry when a fisher goes out fishing, the job is very safe. Do you agree or disagree? If agree/disagree ask if he/she strongly agrees(disagrees), agrees (disagrees), or just slightly agrees(disagrees). Strong disagree(1)__ disagree(2)__ slight disagree(3)__ neither(4)__ slight agree(5)__ agree(6)__ strong agree(7)__
5. If your household’s income had to be derived from a source other than fishing,
what type of work would you prefer to do?
ATTITUDES TOWARDS FISHING
were or are presently involved in fishing in the five project villages are tabulated in tables a and b.
Table a indicates that, overall, just a little over one fourth of those interviewed with past or present involvement in the capture fishery would advise a young person to enter the fishery. The differences between the villages are not statistically significant (χ2 = 2.132, df = 4, p>0.05). More than half the respondents, however, report that they like the occupation of fishing, and there are statistically significant differences between the communities (χ2 = 21.890, df = 4, p<0.001). Finally, only about one-fifth of the respondents say that they would not change the primary source of their
household’s income to one that provided the same amount of income as fishing, but there were statistically significant intervillage differences, ranging from nine to 42 percent (χ2 = 45.787, df = 4, p<0.001). Table b clearly indicates that most respondents (80 percent) disagree to some extent with the statement that “there is no need to worry when a fisher goes out fishing, the job is very safe”. Nevertheless, there are some statistically significant intervillage differences, with a high of 33 percent of village 2 respondents agreeing
Since
and the degree to which the household depends on fishing, the same data is examined for males from households that rank fishing as contributing most to household income (tables c and d). None of the observed differences between the villages are statistically significant (p>0.05). Nevertheless, it appears that there are statistically significant differences in the responses of males from households that have a primary dependence on fishing and others in all villages except Village 1 with regard to liking the occupation of fishing. For example in Village 2, 81 percent of these males like fishing in contrast to only 31 percent of the others (χ2 = 13.10, df = 1, p<0.001). In Village 3, respective percentages are 89 and 33 (χ2 = 18.93, df = 1, p<0.001), in Village 4, 85 and 52 (χ2 =
8.84, df = 1, p<0.005), and in Village 7, 87 and 55 (χ2 = 9.36, df = 1, p<0.005). The only other response that manifests a statistically significant within village difference is that in Village 7, males from primarily fishing households are more likely to state that they would not change their occupation than others (19 versus 3 percent, respectively; Yates corrected χ2 = 5.06, df = 1, p<0.05). The percentage of fishers who would not leave fishing for an available alternative is much lower than reported by similar fishers in the Philippines and Indonesia (84 and 64 percent, respectively; Pollnac, et al. 2001). Perhaps this difference can be attributed to changes in perceptions of the occupation of fishing resulting from the tsunami.
With regard to attitudes toward the relative safety of fishing, once again respondents in Village 2 seem to be less likely to disagree with the statement than respondents from the other villages (table d). This time, however, differences across the 5 villages are not statistically significant (Kruskall Wallace one-way analysis of variance coefficient=4.80, df=4, p>0.05).
Alternatives to fishing As a means of determining acceptable alternative occupations that could be used to replace fishing if for some reason community members could no longer fish, respondents were asked to indicate the type of job they would like to have if they had to leave the occupation of fishing. Table e includes categorized responses cross-tabulated by village. Almost one-half the respondents indicated that they would like to be involved in some type of trading. Farming was suggested by about one-third, and aquaculture, which is often suggested as an appropriate alternative to the capture fishery, was selected by only six
percent of the respondents. Village 7 had the highest percentage of people mentioning aquaculture, but it was only 15 percent. When the survey was given, two small scale aquaculture projects - catfish and frog -
Table d. Percent distribution of attitudes towards the relative safety of fishing among males in households where fishing is of primary importance.
Table c. Percent distribution of selected attitudes towards fishing among males in households where fishing is of primary importance.
Since alternative occupations for households where fishing is of primary importance are those of most interest concerning attitudes towards the occupation, and since it is the fishers, who are principally males, who will be shifting their occupation, table f presents data for males from households where fishing is of primary importance. As can be seen in this table, trading is still selected as the alternative occupation of choice, with farming being the second choice alternative. The rank-orders of these alternatives,
however, are reversed in Village 2 where males from primarily fishing households show a greater preference for farming as an alternative. A detailed
breakdown (uncategorized responses) of
alternatives to fishing can be found in Appendix A.
Predictors of variability in attitudes toward fishing Variables found to be associated with job satisfaction among fishers in other research (Binkley 1995; Gatewood and McCay 1990; Pollnac and Poggie 1988) include age, education, income from fishing and number of years in the occupation. Since it has been predicted that the tsunami might have influenced attitudes toward fishing, aspects of the impacts of this variable are also examined. It has also been suggested that a fatalistic attitude helps fishers cope with the dangers of their occupation (see Pollnac, et al. 1998), hence the influence of a fatalistic attitude is
examined. Perceived safety of the occupation is also expected to be related to attitudes toward fishing. Finally, the analysis explores relationships between attitudes toward fishing and gender, religion and media exposure. The analyses of the impacts of these final three variables are strictly exploratory—some relationship is expected, but the direction of
the relationship is not predicted. For example, media exposure could result in people either fearing the impacts of tsunamis through raising and maintaining the level of awareness or ignoring them because of the reported rarity of such extreme phenomena.
In all cases the variables were converted to dichotomies or were natural dichotomies (e.g., gender, religion). Age, education and years fishing were dichotomized at sample medians (38, 6 and 18 years
respectively). Those who did not disagree with the statement that fishing is safe (question 4, above) are treated as perceiving fishing as safe. Respondents who agreed with the
statement “there is no point in planning for the future, what happens, happens and we cannot do anything about it” are treated as fatalistic.If any household members, relatives or friends were reported as killed or injured by the tsunami, “killed” or “injured”, as appropriate, was coded as present for the respondent, and whether or not the respondent was injured by the tsunami is a natural dichotomy. Reporting fishing as first in importance for household income is used as the indicator for income from fishing; and male from a household where fishing is first in importance is treated as a variable. Finally, media exposure is evaluated by summing the number of times per week the respondent reports being exposed to TV news, radio news, and newspapers and this figure was dichotomized at the sample mean (8.26). The correlations (phi) of these dichotomous variables with attitudes toward fishing are in table g. Probabilities are based on the chi-square associated with the phi.
Most significantly with regard to table g, it is clear that those who perceive fishing as a safe occupation are more likely to advise a young person to become a fisher, like fishing, and less likely to leave
Table g. Correlations (phi) between attitudes towards fishing and independent variables.
Advise Like Leave
percent) of the respondents who would not recommend fishing as an occupation used the rationale of danger while another 4 percent mentioned fear of the tsunami. Fatalistic individuals are also less likely to leave fishing. This may be related to the fact that fatalism is also positively correlated with perceptions of fishing as not dangerous (phi=0.21, p<0.001). Male and Muslim respondents also have a tendency to report that they would not leave fishing.
Having a household member, kinsman, or friend killed or injured by the tsunami tends to influence the respondent’s desire to leave fishing, but injury to self seems to have no effect on willingness to change occupation. This finding is supported by the fact that those who were injured by the tsunami still like fishing and would advise a young person to enter the occupation. This seems to be related to the finding by Pollnac, et al. (1998) that fishers who experience dangerous incidents at sea are likely to treat the incidents as less serious—they experienced the incident and survived, so why worry. A possible explanation for the negative relationship between a friend/family member being injured or killed and the desire to leave fishing could be because often kinsmen are part of the boat crew. Therefore, if a fisherman lost a person that was part of his crew, he would be less likely to want to go out after the disaster without him. Additionally, if a fisher is accustomed to a crew with close relations, he may not want to expose his crew to the dangers of fishing even if he, alone, would wish to continue to fish. A useful observation of these findings is that the ARC criteria for replacement boats include loss of a household member in the tsunami. Given that those who experienced death/injury to someone close to them were more inclined to desire to leave fishing, this criteria seems to be counterproductive. If one of the program goals is to ease stress on the fishery, a better solution in future projects of this type may be to give these households priority for training for alternative livelihoods. Within the confines of the current situation, those households that received boats but would be willing to accept an alternative occupation might be trained in another occupation using the boat such as boat trips for tourists.
Age is not significantly correlated with attitudes toward fishing. Those with a higher level of education and females, however, are less likely to state that they like fishing. It is interesting that the proximity to injury and/or death from the tsunami did not seem to have a negative impact on a person’s liking fishing—in fact, those who had a household member, kinsman, or friend killed or injured or who were injured themselves tended to report that they liked the occupation of fishing. Liking fishing is not statistically significantly correlated with the willingness to leave the occupation (phi=0.05, p>0.05), but it is significantly correlated with willingness to advise a young person to enter the occupation (phi=0.25, p<0.001).
CONCLUSIONS AND RECOMMENDATIONS
The results clearly indicate that attitudes towards the occupation are more negative than those reported by Pollnac, et al. (2001) for comparable Southeast Asian fisheries. Whether or not this can be attributed solely to the impacts of the tsunami is not clear at this point. The tsunami indicators, as analyzed in this report, did not have a negative impact on either liking the occupation or advising a young person to enter the occupation. Those who lost family members or friends to the tsunami did tend to report that they would leave the occupation for an alternative providing the same income. Nevertheless, personal injury resulting from the tsunami did not have this effect. Further, those with a fatalistic attitude and those who perceived fishing as not dangerous tended to report that they would not leave the occupation.
alternatives be the starting point for developing a comprehensive alternative occupation program for the involved villages.
PRELIMINARY BASELINE REPORT #3
INVESTMENT ORIENTATIONS IN FIVE COASTAL VILLAGES,RANONG,THAILAND
INTRODUCTION
Recovery from natural disasters often involves providing loans associated with investment opportunities for impacted community members. It is therefore important to understand what people say they would do with a sudden windfall of money. This may give development workers some indication of activities perceived as worthy of investment by community members. This information can then be used in the structuring of credit schemes and complementary training programs to foster investment opportunities in targeted communities.
In order to assess villagers investment orientations, we asked a sample of 502 individuals from 251 households in the five villages to respond to the following two questions:
1. If you were to suddenly inherit or win 9,000B in a lottery, what would you do with this money?
2. Now I will ask the same question involving more money. If you were to suddenly inherit or win in a lottery 110,000B, what would you do with this money?
INVESTMENT ORIENTATIONS
Inter-village variation Ninety-nine distinct responses to the questions were coded into 12 categories plus an “other” catch-all category. Individuals were allowed to provide more than one response to each question. Tables a through c below provide the percent distributions of the first response to the 9000B question and the first and
household would like to do if they could no longer fish (Pollnac 2005), some form of trading is the most frequent response (28 percent) to the 9000B question (table a). This response ranged from a low of 15 percent in Village 1 to a high of 38 percent in Village 2. Putting the money into a bank or a revolving fund is the next highest projected use (11 percent) followed closely by education for a child (8 percent), farming (7 percent) and fishing (6 percent). Village 1 manifests a relatively high percent of individuals responding they would put the money in a bank or revolving fund—28 percent, which is more than two to five times higher than in any of the other villages. It is useful to note that Village 1 has had the most experience with development organizations, especially WARED (Wildlife Animal Rescue Foundation of Thailand) which worked in the area prior to the tsunami. Respondents from Village 1 also seem to be more likely to invest in a child’s education. Use for a boat was not specified, but if we assume it was for fishing (a good assumption) it would increase the percent invested in fishing up to 11 percent, tying with bank/revolving fund. Further, some responses coded “equipment” were also not specified; hence, a few more percent may possibly be directed at fishing.
Table a. Percent distribution of investment orientations(9000B)
Table b
(12 and 9 percent, respectively). Similar to the response to the 9000B question, Village 1 respondents, once again, seem most likely to invest in a bank or revolving fund. The second response adds only a few percent to those categories, with trading being the highest again with 4 percent.
Responses to both the 9000B and 110,000B questions were re-coded so that individuals providing a specific response to either question, be it a first or later response, would be coded as indicating that category. For example, if a person reported that they would invest the money in trading for either question, they would be coded as “trading”. Hence, an individual could be coded as reporting several investment options. Percent distribution of the re-coded responses across the seven villages can be found in table d. Columns in table d can sum to greater than 100 percent since an individual may provide more than one response. Tests of significance for inter-village differences were calculated for all responses provided by more than five percent of the sample. These analyses indicate that inter-village differences are statistically significant for all responses except for investment in farming, fishing, house and business. Distributions of responses are quite similar to those in the preceding tables. Respondents from Villages 1 and 4 are most likely to suggest investing in a child’s education, while those from Village 3 are least likely. Village one reports investment in a bank or revolving fund to the greatest extent, and it manifests the lowest number of respondents interested in trading or investment in a boat. The largest number of respondents interested in aquaculture can be found in Villages 3 and 7 while a larger percentage of individuals from Village 7 are
Table b. Percent distribution of investment orientations(110
,
000B)across the five villages (1st response).
Table c. Percent distribution of investment orientations(110
,
000B)Predictors of variability in investment orientation Research has related several variables to investment orientations (see Pollnac 1989). The variables analyzed here include age, education, income from fishing and number of years in the occupation. It is also expected that impacts of the tsunami might influence investment orientations. This is speculative at this point, but it is possible that such a disaster might result in people wondering if it is rational to invest in such an unpredictable environment. It also seems that a fatalistic attitude might result in feelings of powerlessness, which might influence investment for the future; hence, the influence of a fatalistic attitude is examined. Principal occupation might also influence
investment orientations. For example, members of households where fishing is of primary importance would probably be more likely to reinvest in fishing than members of households where farming or some other occupation is primary. Likewise, people who consider fishing as unsafe, would probably not be likely to invest in fishing. Finally, the analysis explores relationships between investment orientations and gender, religion and media exposure. The analyses of the impacts of these final three variables are strictly exploratory. For example, media exposure could result in raising awareness of investment opportunities, and we have no idea as to how gender or religion might be related to this variable.
In all cases the variables were converted to dichotomies or were natural dichotomies (e.g., gender, religion). Age, education and years fishing were dichotomized at sample medians (38, 6 and 18 years respectively). Those who did not disagree with the statement that fishing is safe are treated as perceiving fishing as safe. Respondents who agreed with the statement “there is no point in planning for the future, what happens, happens and we cannot do anything about it” are treated as fatalistic.If any household members, relatives or friends were reported as killed or injured by the tsunami, “killed” or “injured”, as appropriate, was coded as present for the respondent, and whether or not the respondent was injured by the tsunami is a natural dichotomy. Reporting fishing as first in importance for household income is used as the indicator for income from fishing. Finally, media exposure is evaluated by summing the number of times per week the respondent reports being exposed to TV news, radio news, and newspapers and this figure was dichotomized at the sample mean (8.26). The correlations (phi) of these dichotomous variables with attitudes toward fishing are in table e. Probabilities are based on the chi-square associated with the phi.
The statistically significant (p<0.05) correlations in table e are all rather weak, but it appears that there is a tendency for those who think fishing is safe to not invest in a child’s education. This may be related to the fact that those who think fishing is safe are likely to invest in a boat or equipment, rather than education or farming. In addition, if a fisher wishes the next generation to become a fisherman, he does not have to invest in their education because education is not required to participate in the fishery. In this case, investment in productive materials for fishing is also investment for the future generation. There is also a tendency for those from households where fishing is primary to invest in a bank or revolving fund. This finding is in accordance with earlier research findings which indicate that aspects of the marine
Table d. Percent distribution of investment orientations (both questions) across the five
villages (all response
s
).Village
Use of money 1 2 3 4 7 Total N χ2
df prob. Child’s education 27 12 7 25 11 16 79 23.636 4 <0.001 Bank/Revolving fund 50 13 11 16 18 21 103 56.872 4 <0.001 Trading 17 42 43 35 43 37 185 18.761 4 <0.01 Farming 15 27 25 21 18 21 107 5.458 4 >0.05 Fishing 3 8 11 11 12 9 46 5.156 4 >0.05 Aquaculture 3 4 11 6 15 8 41 11.747 4 <0.05 House (fix/build) 9 12 3 11 10 9 44 6.557 4 >0.05 Boat 0 8 4 8 13 7 33 14.085 4 <0.01 Livestock 0 4 3 1 5 3 14 * * * Equipment 6 8 7 12 19 10 51 12.554 4 <0.05 Land 8 2 2 7 0 4 19 * * * Business (other) 0 2 0 0 0 0 2 * * * Other 1 7 4 6 8 5 26 5.064 4 >0.05 *chi-square not calculated for responses provided by less than 5% of sample.
future needs associated with their productive activities (Pollnac and Poggie 1978; Poggie 1978; Pollnac, et al. 1975).
Trading seems to be the most likely option for older, fatalistic individuals who reported that none of their household members, kinsmen or friends was killed by the tsunami. Muslims appear less likely to invest in either fishing or a boat, while older individuals tend to mention aquaculture as an investment. Younger people are more likely to invest in their house, while those with more education and media exposure are less likely to invest in equipment. Finally, those who report that they were injured by the tsunami tend to say they would invest in a business.
CONCLUSIONS AND RECOMMENDATIONS
The results presented above can be used to provide tsunami recovery workers some indication of activities perceived as worthy of investment by community members. Inter-village and inter-individual differences in investment orientations is information important in the structuring of credit schemes and complementary training programs to foster investment opportunities in targeted communities. But this information must be used with care—responses to questions do not always reveal realistic behavioral responses—some may see themselves as a successful traders, but do they have the necessary skills and is there a market for the proposed trade?
Trading is used as an example in the introduction to this section because investment in trading is the most frequently mentioned option in the interviews. It appeared as a first or later response in 37 percent of the interviews (table d). Responses were often general; e.g., “invest in trading,” “open a shop,” “expand shop.” Only a few were specific; e.g., “trade fish,” “buy drugs for pharmacy,” “open grocery,” “trade fruit.” This suggests that most respondents had not even carefully considered the type of trading they would become involved in. Further, one needs to ask, how many traders are needed. If more than one third of the respondents open some sort of trading enterprise, would there be enough business to support such a large number of traders? The same questions could be asked of some of the other alternatives.
Investment in farming (21 percent of respondents, table d), probably a realistic venture in these rural communities, also needs more specification. What type of farming, and is there a distribution system and market for proposed crops? Since farming is already widely practiced throughout the region, answers to these questions are probably easy to obtain, and since many families both farm and fish, it appears that minimal training would be necessary. Investment in a bank or revolving fund (21 percent, table d) tells us little about the purpose of this type of investment. Is it to provide capital to replace or repair damaged or destroyed fishing equipment sometime in the future? The marine environment is tough on gear, and many fishers plan for future needs by saving money, but we do not know if this is the reason for saving. It does, however, demonstrate a cautious attitude towards expenditure of funds, an attitude that bodes well for future development and sustainability of development efforts.
If we include investment in a boat with fishing, investment in fishing ties with investment in a child’s education (16 percent, table d). Investment in education demonstrates a realistic concern for the future, but does investment in fishing? If education is not required to become a fisherman, why would a household involved in fishing invest in a child’s education? In the sense that the project villages have
Table e. Correlations (phi) between investment orientations and selected independent variables.
Fishing Fishing Self
Investment First Age Educate safe Fatal Killed Injured Injured Female Muslim Media
Child’s
education -0.01 -0.06 -0.02 -0.13* -0.08 0.04 -0.01 -0.08 0.03 0.04 0.06
Bank/Revolving
fund 0.14* -0.08 0.08 0.09 0.03 0.04 0.00 0.03 0.00 0.02 0.04
Trading -0.04 0.16* 0.02 0.03 0.14* -0.13* -0.06 -0.01 0.09 -0.03 -0.03 Farming 0.03 -0.03 -0.04 -0.10* -0.05 -0.01 0.03 -0.04 -0.04 0.03 -0.07 Fishing -0.01 0.03 -0.06 0.05 -0.06 0.04 0.01 0.02 0.00 -0.15* -0.02 Aquaculture -0.08 0.10* -0.04 -0.06 -0.04 -0.01 0.02 -0.01 0.01 -0.07 -0.04 House (fix/build) -0.07 -0.14* 0.06 0.07 0.01 0.09 0.02 0.07 0.02 0.02 -0.07 Boat 0.04 -0.02 -0.02 0.13* 0.05 -0.01 0.01 0.02 -0.09 -0.15* -0.08 Equipment 0.03 -0.07 -0.13* 0.15* 0.01 0.03 0.01 0.06 -0.04 -0.09 -0.15*
Business (other) -0.10 -0.02 0.01 0.07 0.05 0.02 0.03 0.10* 0.03 -0.00 -0.00
recovery assistance began to contribute to the process. The fishing families wanted to resume their livelihoods in the ways they knew how. But some “experts” have questioned the sustainability of the traditional fisheries and have suggested that it would be desirable to perhaps deflect some fishers from returning to their traditional occupation. Given the argument above, if the objective of a recovery program is to divert people out of the fishery, is education a way to accomplish this goal for the next generation?
If movement out of the fishery is desirable for conservation purposes, it is suggested that actions be taken soon, and that appropriate alternatives—those that provide some of the same satisfactions as fishing, and perhaps some of those uncovered by this investment orientation analysis—be provided (Pollnac, et al 2001; Pollnac and Poggie 1988; Sievanen, et al. 2005). The investment orientations uncovered in this analysis and the analysis of attitudes towards fishing in these villages (Pollnac 2005) might be of some assistance in this endeavor, but the relative recency of the tsunami and villagers’ awareness and realistic perceptions of suitable alternatives as discussed above may limit, somewhat, the usefulness of the information provided here. It is suggested that the investment orientations presented here, in conjunction with human resource, economic and marketing analyses, as well as education programs directed at raising awareness concerning suitable alternatives be the starting point for developing comprehensive alternative occupation and recovery programs for the involved villages.
REFERENCES CITED
Poggie, John J. 1978 Deferred gratification as an adaptive characteristic for small-scale fishermen. Ethos 6:114-123.
Pollnac, Richard B. 2005 Attitudes toward the occupation of fishing in five coastal villages, Ranong, Thailand. Preliminary Baseline Report (circulated manuscript).
Pollnac, Richard B. 1989 Income variability, uncertainty, and investment orientations among small-scale fishermen in the Gulf of Nicoya, Costa Rica. in (R. Pollnac & M. Morrissey, eds.) Aspects of Small Scale Fisheries Development. Kingston, R.I.: International Center for Marine Resource Development.
Pollnac, Richard B. and John J. Poggie, Jr. 1988. The structure of job satisfaction among New England fishermen and its application to fisheries management policy. American Anthropologist 90(4): 888-901.
Pollnac, Richard B. and John J. Poggie 1978 Economic gratification orientations among small-scale fishermen in Panama and Puerto Rico. Human Organization 37:355-367.
Pollnac, Richard B., Carl Gersuny and John J. Poggie 1975 Economic gratification patterns of small-scale fishermen and millworkers in New England. Human Organization 34:1-7.
Pollnac, R.B., R.S. Pomeroy and I.H.T. Harkes 2001 Fishery policy and job satisfaction in three Southeast Asian fisheries. Ocean and Coastal Management 44:531-544.
APPENDIX A
Below is a list of the loans distributed through this project’s revolving fund as of 11/04/2005:
Project Name Location
Catfich culture ล ล อ Village 1
Green mussel culture ล อ ล Village 1
Goat raising ล Village 1
Fishery Village 1
Goat raising ล Village 1
Rubber tree plantation Village 1
Beef cattle raising ล Village 1
Trading ค Village 1
Fruit orchard ( ล ) Village 1
Beef cattle raising ล Village 1
- Village 1
Grouper cage culture ล ล Village 2
Grouper cage culture ล ล Village 2
Grouper cage culture ล ล Village 2
Grouper cage culture ล ล Village 2
Buying marine products อ ล ํ Village 2
Fishery Village 2
- Village 2
- Village 2
ํ ล Village 2
Steaming mackerel Village 2
- Village 2
- Village 2
- Village 2
- Village 2
Bitel nut drying Village 2
- Village 2
Ice selling Village 2
Live fish buying Village 2
Trading Village 2
Beef cattle raising Village 2
Purchasing shrimp-giltnet ออ Village 3
Purchasing Plasai-giltnet ออ ล Village 3
Purchasing shrimp-giltnet ออ Village 3
Grouper cage culture ล ล Village 3
Shrimp paste, Sweet-cooked ํ Village 3
Green mussel culture ล อ ล Village 3
Green mussel culture ล อ ล Village 3
Fish culture ล ล ล Village 3
Clothes trading อ ํ Village 3
Coconut milk selling ํ Village 3
Glocery shop อ Village 3
Dressing shop อ Village 3
Roti and fruit juice ล ํ ล Village 3
Cable TV. Service shop ค ล Village 3
Dressing shop อ ํ Village 3
Cooky-pip trading ค Village 3
Chicken fry selling อ Village 3
Ready cooked-food ํ Village 3
Clothes shop อ ํ Village 3
Seafood processing products อ ล Village 3
By-product of Rubber milt ค Village 3
Electronic lamp selling อ ลอ Village 3
Fresh chicken selling ค Village 3
Saroeng Clothes selling ค Village 3
Furniture shop ค อ อ Village 3
Fisheries and agriculture ล Village 4
Fishing gear and equipment อ Village 4
Trading ค Village 4
Fishing gear production ํ ค อ อ Village 4
Food processing อ Village 4
Fishing gear and equipment อ Village 4
Shrimp paste and packaging Village 4
Beef cattle raising ล Village 4
Fishery Village 4
Trading ค Village 4
Fish processing อ Village 4
Fisheries Village 7
Fisheries Village 7
Fisheries Village 7
Fisheries Village 7
Trading Village 7
Fisheries Village 7
Trading Village 7
Fisheries Village 7
ลอ Squid Trap Village 7
Fisheries Village 7
ล Frog culture Village 7
Fisheries Village 7
ค Glocery shop Village 7
Fisheries Village 7
Catfish culture ล ล Village 7