Full Terms & Conditions of access and use can be found at
http://www.tandfonline.com/action/journalInformation?journalCode=vjeb20
Download by: [Universitas Maritim Raja Ali Haji] Date: 11 January 2016, At: 19:41
Journal of Education for Business
ISSN: 0883-2323 (Print) 1940-3356 (Online) Journal homepage: http://www.tandfonline.com/loi/vjeb20
Improving Student Performance in a Management
Science Course With Supplemental Tutorial Videos
Janice K. Winch & E. Susanna Cahn
To cite this article: Janice K. Winch & E. Susanna Cahn (2015) Improving Student Performance in a Management Science Course With Supplemental Tutorial Videos, Journal of Education for Business, 90:7, 402-409, DOI: 10.1080/08832323.2015.1081865
To link to this article: http://dx.doi.org/10.1080/08832323.2015.1081865
Published online: 18 Sep 2015.
Submit your article to this journal
Article views: 22
View related articles
Improving Student Performance in a Management
Science Course With Supplemental Tutorial Videos
Janice K. Winch and E. Susanna Cahn
Pace University, New York, New York, USAThe authors describe the implementation and assessment of supplementary online video tutorials in a management science course. The videos were a mix of existing videos curated from the web and new videos created by the instructors of the course. Students were encouraged to use the resources with grade incentives. Students who used more of these resources performed significantly better in the course. In addition, most of the students perceived the videos as helpful.
Keywords: instructional podcasts, management science, supplements, tutorial videos
INTRODUCTION
The availability of free online resources for learning has increased dramatically over the past few years. Khan Academy, for example, offers thousands of high-quality free tutorial videos on mathematics, science and other subjects. YouTube offers countless tutorial videos in every subject imaginable. Numerous other sources for educational videos can be found in websites such as Refseek (2013) and Getting Smart (Schneider, 2013). In addition, a number of massive open online course platforms such as Coursera, Udacity, and edX offer free college-level courses with video lectures. Use of online videos and podcasts has become increasingly pop-ular in traditional university courses as well, sometimes replacing face-to-face lectures (e.g., in the flipped classroom model) and sometimes supplementing them.
Supplemental tutorial videos can be helpful in science, technology, engineering, and math courses where underpre-pared students can quickly become lost due to materials building upon one another. This is also true of quantitative courses in the business curriculum, such as business statis-tics or management science, which require applying previ-ously learned mathematics concepts.
In this article, we describe a successful implementation of supplementary video tutorials in an introductory man-agement science course required of undergraduate business
students. Meeting in traditional classroom format, this man-agement science course covered the following topics: deci-sion analysis, forecasting, linear programming, Monte Carlo simulation, project scheduling with optional coverage of inventory models, queueing models and transportation models. Students were the juniors and seniors who had taken finite mathematics (a freshman-level course covering introduction to probability concepts, linear programming concepts, and basic financial mathematics) and a statistics course as prerequisites. Although these students have taken two college-level math courses, many of them had diffi-culty with seemingly simple algebraic concepts such as inequalities and interpreting simple linear expressions.
The main objective of the supplementary video tutorials was to improve learning in a course that students typically find challenging, and especially to improve learning of the underprepared students. By carefully considering how the tutorials would be developed, what topics they would cover, and how to motivate students to use them, we were able to achieve high student participation and overall improvement in student performance. The purpose of this study was twofold: (a) to illustrate the implementation pro-cess of the tutorial videos into the course and (b) to give empirical evidence of its effectiveness.
The setting of the tutorial project is a private metropoli-tan university with the total enrollment of approximately 13,000 with about 4,000 students in the business school offering undergraduate and graduate programs. The under-graduate student body is characterized by a wide range of ability with the average combined SAT score slightly above the national average. The business school is accredited by Correspondence should be sent to Janice K. Winch, Pace University,
Department of Management & Management Science, One Pace Plaza, New York, NY 10038, USA. E-mail: [email protected]
Color versions of one or more figures in this article are available online at www.tandfonline.com/vjeb.
ISSN: 0883-2323 print / 1940-3356 online DOI: 10.1080/08832323.2015.1081865
the Association to Advance Collegiate Schools of Business (AACSB) in both business and accounting.
In evaluating the effectiveness of the tutorials, the ques-tions we address are as follows:
Research Question 1 (RQ1): Did a substantial number of students make use of the tutorial videos?
RQ2: Was there a positive relationship between the students’ performance on the related assessment and the use of the videos?
RQ3: Did the students perceive the tutorial videos to be effective?
Before we answer these questions, we review the litera-ture on two groups of studies: those that theorize how sup-plemental videos could be helpful in quantitative courses, and those that describe implementation of such videos. Next, we describe how the video tutorials were imple-mented in our management science course. This is followed by the section giving the results of the assessment. In the last section we discuss the implications of the findings.
LITERATURE REVIEW
Learning Quantitative Disciplines
In teaching quantitative courses in a university setting, pro-fessors have often reported finding students entering their classes deficient in the math skills that are needed for suc-cess in the course (Baharun & Porter, 2012; Johnson & Kuennen, 2006; Kay & Kletskin, 2012; Xu, Meyer, & Mor-gan, 2009). Johnson and Kuennen noted that prior math skills are important to achieving success in a business sta-tistics course; a follow-up study by Lunsford and Poplin (2011) reinforced this finding.
It may be hypothesized that quantitative courses could benefit from a tool that would help create a more uniform set of prior knowledge or aid review, preferably without detracting from class time for the new material. Johnson and Kuennen (2006) suggested using reviews of back-ground math as a supplement to courses in statistics in order to improve success. Yates (2005) suggests building in a course routine that includes remediation, review, and indi-vidualizing instruction to each student’s needs. Complex material should be broken down into small parts so students can learn incrementally (Ayres 2006; Mayer, Mathias, & Wetzell, 2002; Sweller & Chandler, 1994).
Benefits of Supplemental Videos
Video tutorials are a potential tool for addressing some of the difficulties inherent in teaching quantitative disciplines. Videos have been used in several ways: to deliver lectures in an online class, to supplement the class by adding
material that is not included in lectures, or as a creative tool for students to present their own work (McGarr, 2009). In particular, McGarr advocated supplemental video use as the most beneficial to learning. Such supplements may be used to reinforce, provide extra examples, and add visual perspective to fields that are awkward to present without videos.
Videos are thought to be especially useful in situations requiring instructors to demonstrate methods and solve exercises (Gattis, 2008; Holden & Westfall, 2006). Sargent, Borthick, and Lederberg (2011) suggested that weak stu-dents could benefit from supplements enabling them to master small pieces of learning. Videos increase contact time for students when used to supplement class time (Chickering & Gamson, 1987). Furthermore, repetition can be used to deepen understanding and achieve high levels of academic performance (Cooper, 2004), and videos provide opportunities for students to view content as many times as necessary. Stephenson, Brown, and Griffin (2008) found that videos of PowerPoint slides with audio annotations are associated with better than average performance on factual recall exam questions. One explanation cited by these stud-ies is that students can listen to or watch tutorials multiple times, while lectures are available only once.
Studies With Supplemental Videos
Instructor-authored videos have been used in a variety of quantitative courses taken by business students: manage-ment science and operations research (Hardin & Ellington, 2005; Leon, Seal, & Przasnyski, 2007; Nurre & Sharkey, 2013), accounting (Rich, 2012; Sargent et al., 2011), and precalculus (Kay & Kletskin, 2012). Overall, the student response to video availability was positive in all of these studies. However, empirical support for improvement in learning outcomes has been weak; and not all authors mea-sured learning outcomes. The results from these studies are summarized here.
Hardin and Ellington (2005) created video tutorials dem-onstrating the Palisade DecisionTools suite (Palisades Corp., Ithaca, NY), a set of add-ins for Excel (Microsoft Corporation, Redmond, WA), in an undergraduate mathe-matical modeling course. Pretest and posttest demonstrated significant improvement after viewing the videos.
Leon et al. (2007) developed interactive screen capture modules for demonstration and practice of Excel modeling tools such as regression and data table for a graduate level financial modeling course and an undergraduate production operations analysis course. Nurre and Sharkey (2013) developed video tutorials to provide additional examples for various topics covered in an operations research course. Students perceived the tutorials as effective in both of these studies.
Sargent et al. (2011) used 27 three-minute videos for students in a principles of accounting course. Video use IMPROVING PERFORMANCE WITH SUPPLEMENTAL VIDEOS 403
was significantly correlated with better pass rates and lower drop rates and small but significant increases in exam scores; comparing two-year periods before and after adding the videos to the course, course grades were higher. In another accounting course reported in Rich (2012), a series of 10 instructor-authored exercise-based supplemental video tutorials improved student performance on the mid-term compared to an earlier semester without the videos, although the difference was not statistically significant.
Kay and Kletskin (2012) created a series of 59 video tutorials covering five precalculus areas: operations with functions, solving equations, linear functions, exponential and logarithmic functions, and trigonomet-ric functions. Each video had a problem solved by a teacher along with a corresponding problem to be solved by the student. Students’ self-reported knowl-edge improvement in precalculus was significantly cor-related with video use.
In addition to videos created by the instructors, instructors can integrate videos that are available online. G€on€ul and Solano (2013) required Khan Acad-emy assignments in business statistics and operations management courses. The effect of participation in Khan Academy assignments on exam scores was signifi-cant and positive, but not signifisignifi-cant after accounting for student-specific characteristics.
Limitations
A limitation of many of these studies is that it is difficult to isolate the effect of the tutorial videos on learning. It may be that much of the benefit derived from tutorial videos is from the extra time on task that any supplement to the course would provide. Students’ repetition, drill, and prac-tice might have been accomplished similarly without online delivery; technology then just provides an efficient delivery tool (Leidner & Jarvenpaa, 1995). Also, it is possible that those students who opt to use the video tutorials are the more motivated students who generally tend to do better.
In these studies, the effectiveness of the tutorial videos was typically measured by surveying of student percep-tions. In addition, some of the studies attempted to measure the effect of the tutorials by comparison of student perfor-mance between the term when the videos were offered and a prior term when the videos were not offered. In this study, by contrast, we measured the relationship between the use of the tutorials and performance for the same cohort of stu-dents. In addition, existing online videos and custom-designed videos were integrated to provide remediation of basic materials and reinforcement of concepts covered in the course.
In the next section, we describe the ways in which the tutorial videos in our management science course were implemented to maximize its effectiveness.
IMPLEMENTATION AND ASSESSMENT OF THE TUTORIAL VIDEOS
We determined that students needed two types of materials: the videos that helped them review the prerequisite basic math and Excel skills and the videos that helped reinforce the topics that were being taught in the course. The videos were to be a mix of existing online videos and new videos created for the course. An extensive search of online videos provided a list of relevant videos. For the topics for which appropriate videos could not be found, the instructors cre-ated a set of videos and uploaded them on YouTube. The links of all the videos were embedded on the Blackboard Learn (Blackboard Inc., Washington, DC), the learning management system for the course.
Review Tutorials
The idea of providing a review at the beginning of the term is consistent with the recommendation Johnson and Kuennen (2006) gave in the study of student characteris-tics associated with success in a business statischaracteris-tics course. In our management science course, a review module consisted of nine short videos curated from the web listed in Table 1. The first three videos of the nine videos were from Khan Academy. The total length was approximately 1 hour. To encourage the underprepared students to view these videos, students were given a prereview quiz and a postre-view quiz covering the materials in the videos. The prere-view quiz, given on the first day of the class, served as a diagnostic tool and did not count toward the course grade. The quiz was graded immediately, so students were able to see which questions they missed. They were then given a postreview quiz a week later under the same conditions (which did count toward their grade) after having had a chance to view the tutorials covering the questions they missed. The postreview quiz differed from the prereview quiz, but covered the same topics at a slightly more chal-lenging level. While students were not required to view the videos, many of them were motivated to view many of them to prepare for the postreview quiz. According to students’ self-reporting, the average number of videos viewed by students was 4.6 of 9, with 76% of students viewing at least one video and 24% reporting that they viewed all nine videos.
Course Topic Tutorials
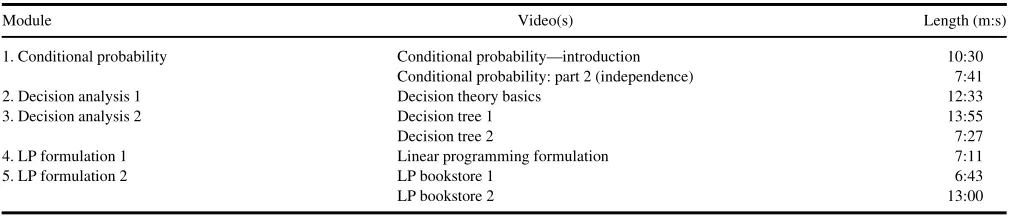
In addition to the review videos, students were provided videos with alternative examples for the course topics they tend to find challenging. These topics were conditional probability, decision analysis, and linear programming for-mulation. A set of five optional tutorial modules were pro-vided as shown in Table 2. Each module had one or two videos with an accompanying online quiz.
The two conditional probability videos were found on You-Tube (http://youtu.be/UE8u7JZqyl4, http://youtu.be/KID-plYpM4tM). The others were created by the authors with Camtasia Studio (Techsmith Corp., Okemos, MI).Decision Analysis 1covered an introductory example with one-step decision making and Decision Analysis 2 covered two-step decision making with a decision tree. Linear Programming (LP) Formulation 1 covered a simple example with two products and three resource constraints and LP Formulation 2 illustrated a translation approach with the bookstore example from Stevens and Palocsay (2004). As a sample, the Decision Analysis 2: Decision Tree 1 video can be seen at: http://youtu.be/ez4yTfUQXG8.
The quiz included in each module served to reinforce the concepts covered in the videos and to verify that students had viewed the videos. Using a quiz to verify tutorial com-pletion was considered preferable to counting number of hits since having to complete the quiz motivated students to pay attention to the material. As an incentive, an extra credit of one percentage point was assigned for each mod-ule completed with a minimum quiz grade of 80%. Each module deadline coincided with the timing of the topic. These extra-credit course topic tutorials were provided in addition to required weekly assignments. Those who wanted to complete a module for extra credit were advised to do it before attempting the related assignment.
Assessment
We evaluated the effectiveness of the review video tutorials by testing the following hypotheses:
Hypothesis 1(H1): The performance on the postquiz would be higher than the performance on the prequiz.
H2: The performance on the postquiz would be positively related to the number of review tutorials viewed.
As for the course topic tutorial modules, they could be evaluated by the midterm exam performance. The midterm exam covered decision analysis, linear programming for-mulation, and forecasting, containing all the topics covered by the tutorial modules. Hence, we tested the following hypotheses:
H3: The performance on the midterm exam would be posi-tively related to the number of course topic tutorials viewed.
H4: The performance on the assignments covering the topics on the tutorials would be positively related to the number of course topic tutorials viewed.
In addition, an important objective of the tutorials was to increase the proportion of students who achieved
TABLE 2 Course Topic Tutorials
Module Video(s) Length (m:s)
1. Conditional probability Conditional probability—introduction 10:30 Conditional probability: part 2 (independence) 7:41
2. Decision analysis 1 Decision theory basics 12:33
3. Decision analysis 2 Decision tree 1 13:55
Decision tree 2 7:27
4. LP formulation 1 Linear programming formulation 7:11
5. LP formulation 2 LP bookstore 1 6:43
LP bookstore 2 13:00
TABLE 1 Review Tutorials
Video Length (m:s) Link
1. Order of operations 1 4:35 http://youtu.be/gjrGd9TjjnY 2. Variables, expressions, equations 6:54 http://youtu.be/vDqOoI-4Z6M 3. Inequality examples 8:01 http://youtu.be/xOxvyeSl0uA 4. Interest word problem 4:13 http://youtu.be/Pv-OZ3UJzMQ 5. Interpreting slope and intercept 4:07 http://youtu.be/w0PMKYVXXIA 6. Cumulative probability 5:17 http://youtu.be/YX4XK1R_I8g 7. Excel for beginners 12:37 http://youtu.be/L7dHA_8GzKw
8. The SUM and average functions 3:27 http://office.microsoft.com/en-us/excel-help/the-sum-and-average-functions-RZ101862712.aspx?CTTD1§ionD4
9. More about cell references and formulas 9:50 http://office.microsoft.com/en-us/excel-help/more-about-cell-references-and-formulas-RZ101862712.aspx?CTTD1§ionD5
IMPROVING PERFORMANCE WITH SUPPLEMENTAL VIDEOS 405
acceptable performance. Here, acceptable was defined as achieving a score of 80% or higher on the midterm exam. The last hypothesis was the following:
H5: The proportion of students who achieve a minimum score of 80% on the midterm exam would be positively related to the number of course topic tutorials viewed.
The effect of the tutorials was evaluated in the manage-ment science course taught by the authors: two sections in fall 2013 and four sections in spring 2014. With 66 students from fall 2013 and 103 students from spring 2014, the total number of students enrolled in the six sections was 169. In addition to tracking the student performance related to the video tutorials, three surveys were conducted during spring 2014:
1. Background survey to determine items such as class standing, major, work hours per week, and number of course credits taken during the term
2. A review tutorial survey that asked for each review tuto-rial video whether the student viewed it and whether the video was helpful
3. A course topic tutorial survey that asked for each course topic tutorial video whether the student viewed it and whether the video was helpful
The students in the study were evenly divided between juniors and seniors and between male and female. Most were traditional college-age students with approximately 65% working part-time (including internship) and 5% working full-time. All of the students were full-time stu-dents taking 12–18 credits of course work.
RESULTS
Review Tutorials
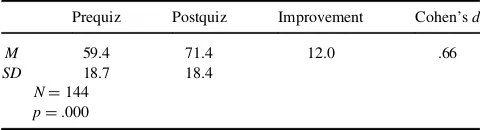
A total of 144 of 169 students took both the prequiz and the postquiz (some students were absent one of the quiz days). The comparison of performance is summarized in Table 3. The mean score increased from 59.4 on the prequiz to 71.4 on the postquiz. The paired-samplet-test indicated that the difference was statistically significant with p D .000. In
addition, Cohen’s d of .66 indicated medium effect size. Hence, H1 was supported by the data. Table 3 gives the aggregate results over the two semesters, but the results for the two semesters were similar; for example, in spring 2014, the mean scores were 58.8 on the prequiz and 71.3 on the postquiz withpD.000.
To testH2,in spring 2014, student surveys were used to relate the improvement in the quiz score to the self-reported number of review videos viewed. Table 4 shows the corre-lations among the prequiz score, number of review videos viewed, score on the postquiz, and the improvement from the prequiz to the post quiz. Surprisingly, there was no sig-nificant relationship between the number of review videos viewed and the performance on the postquiz (or improve-ment from pre- to postquiz). Both relationships had correla-tions close to zero (rD ¡.042,p D.734 for postquiz and
rD ¡.115,pD.349 for improvement). Hence, the data did not supportH2.
The lack of relationship between the number of review videos viewed and performance on the postquiz could be due to imprecise or inflated reporting, as the survey was not anonymous. Another possible reason is that some students may have used other methods of studying, perhaps review-ing the prequiz and other resources. Additionally, since the prequiz did not count toward the grade and the postquiz did, students may have tried harder on the postquiz. The prequiz was given without warning while the postquiz was announced ahead of time and students knew what kind of questions to expect.
The postquiz was evaluated for content validity, that is, the degree to which the scale measures what it is designed to measure. The quiz was critically evaluated by a number of management science faculty members at the university who had taught the course for over 20 years. As the ques-tions were based on the materials covered in the review tutorials, these faculty members were satisfied the quiz questions measured the proficiency in the review topics covered in Table 1. To measure internal consistency of the quiz questions, Cronbach’s alpha reliability measure was computed. Cronbach’s alpha was .72 demonstrating satis-factory level of reliability. Both the prequiz and postquiz are available from the authors by request.
TABLE 3
Comparison of Prequiz and Postquiz Scores
Prequiz Postquiz Improvement Cohen’sd
M 59.4 71.4 12.0 .66
SD 18.7 18.4
ND144
pD.000
TABLE 4
Correlations Among Prequiz Score, Number of Review Videos Viewed, Postquiz Score, and Improvement (Postquiz Score—Prequiz
Score)
Item Prequiz Videos viewed Postquiz Improvement
Prequiz — .066 .557** ¡.508**
Course Topic Tutorials
To assess the effectiveness of course topic tutorials, the sample used included 117 students from two sections in fall 2013 and two sections in spring 2014 taught by one of the authors (J.K.W.). The number of tutorial modules success-fully completed was measured by the number of accompa-nying quizzes with minimum score of 80%. Hence, this measure was not self-reported and did not include those who viewed the videos but did not complete the quizzes. Eighty-two students (70%) completed at least one of the five tutorial modules.
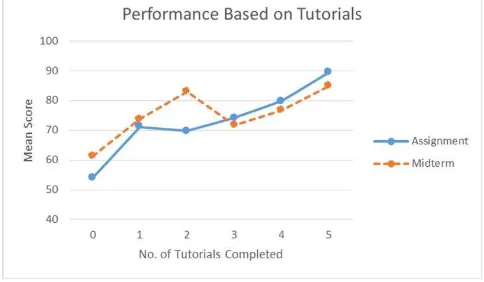
Table 5 shows the mean percentage points on the related assignments and the midterm exams based on number of tutorials completed. The mean scores of assignments and midterms are also plotted in Figure 1. While the mean scores do not always increase with each additional tutorial, the general trend is clearly upward. One-way analysis of variance (ANOVA) of assignment scores and midterm scores based on the number of tutorials indicated the tutori-als had a significant effect on both measures of perfor-mance. The results of the ANOVA for assignment scores,F
(5, 111)D7.29,pD.000, and midterm scores,F(5, 111)D
4.42,pD.001, supportH3andH4.
Table 5 also shows the percentage of students who scored 80% or higher on the midterm exam. The percentage of 80%-plus scores on midterm was significantly related to the number of tutorials,x2(5,ND117)D20.32,pD.001, supportingH5.Comparing the students who completed two or fewer tutorials to those who completed three or more, 39% of the two-or-fewer group and 68% of the three-or-more group achieved 80-plus scores. The tutorials were sig-nificantly correlated to the assignment score (rD.495) and midterm score (rD.390) as well.
While the number of tutorials was correlated with the midterm exam, the assignments had a much higher
correla-tion with the midterm exam withrD.700 (pD.000). This is expected because the assignments were the main vehicle through which students practiced what they learned. The tutorials may have helped somewhat in completing the assignments, but they did not have as much effect on the midterm as the assignments did.
It should be mentioned that the instructor attempted to encourage weaker students to complete the tutorials by stat-ing that students who received a lower score on the prequiz would benefit from the tutorials. However, stronger stu-dents ended up completing more of the tutorials. The corre-lation between the number of course topic tutorials completed and the prequiz score (measuring student’s abil-ity) was somewhat positive withrD.265 (pD.006).
Survey of Student Perception
In spring 2014, two surveys were conducted to measure students’ perception of tutorial effectiveness. Of 103 enrolled students from four sections, 79 (76.7%) partici-pated in the survey on review tutorials, and 65 (63.1%) par-ticipated in the survey on course topic tutorials.
On both surveys, for each tutorial, students who viewed it were asked to choose among definitely helpful, somewhat helpful, not helpful, and unsure. Tables 6 and 7 summarize the results. The percent of students rating the video defi-nitely or somewhat helpful ranged from 77% to 100% with an average of 89%.
The free-form comments on the videos were generally positive, and it was clear students appreciated them. Several students who did not feel confident about their quantitative ability commented they felt helped by the videos. Below are samples of such student comments:
Without these tutorials I would have been lost in the begin-ning of the semester.
Tutorials were very helpful. I watched a lot of them because I was struggling in this class. A lot of this class has to do with math and is very technical, which are two of my
TABLE 5
Percentage Points on the Related Assignments and the Midterm Based on the Number of Course Topic Tutorials Completed
Assignments Midterm Midterm D80
Tutorials n M SD M SD Count %
0 35 54.0 31.3 61.3 25.3 10 28.6 1 16 71.2 19.2 73.8 19.3 6 37.5 2 13 69.8 18.2 82.9 8.8 9 69.2 3 10 74.1 20.3 71.8 18.2 4 40.0 4 19 79.8 19.1 76.8 22.3 13 68.4 5 24 89.3 17.9 84.8 18.9 19 79.2 Overall 117 71.2 26.3 73.6 22.4 61 52.1
Sig.p .000 .001 .001
Correlation .495** .390**
Note.Sig.pindicatespvalues of analysis of variance for assignments
and midterm andpvalue of chi-square for midterm80. **p<.01.
FIGURE 1 Mean assignment and midterm scores based on number of tutorials completed.
IMPROVING PERFORMANCE WITH SUPPLEMENTAL VIDEOS 407
weakest areas. After watching these videos I was able to do homework and understand the material better in general. I wish there were tutorials for everything.
This is a tough class that I was nervous about taking, but the instructor has done a great job offering many resources to help the class learn.
Some of the better students felt some of the review vid-eos were unnecessary: “The [review] vidvid-eos were really helpful, but I found some to be unnecessary (especially the first 3 videos).” Some students admitted not utilizing the review videos: “Did not watch [review] videos. Used the prequiz to help with postquiz.”
DISCUSSION AND IMPLICATIONS
The video tutorials had a high participation rate and were overall effective in helping the students in course perfor-mance. In general, students who completed course topic tutorials tended to do better on the related assignments and the midterm exam. Students’ average performance improved from the prequiz to the postquiz after students were given a chance to view the review tutorial videos. However, the improvement was not significantly related to the number of review videos students reported viewing. Some students who did not view the videos could have improved by prepar-ing for the postquiz by other means. Motivation of the graded postquiz and familiarity with the type of questions could have helped improve performance as well.
There are some limitations to this study. One is that in the implementation of the tutorials, it did not focus specifically on the weaker students as we had originally intended. It would have been desirable to identify the remedial students and require them to complete the tutorials. However, this approach could be problematic since labeling some students as remedial and requiring them to do additional work can cause negative feelings among such students. Hence, it was deemed more practical to make the tutorials available to all the students. It was hoped that the underperforming students would be motivated to use the tutorials with the postquiz and the extra credit incentives. However, the extent to which students utilized the videos was independent of their ability in case of the review tutorials (correlation of .066 in Table 4) and had a weak positive relationship with the abil-ity in case of the course topic tutorials (correlation of .265).
It should be mentioned here we attempted to accommo-date stronger students by providing extra credit opportuni-ties for solving more challenging problems on certain assignments. In general, online tutorials can potentially be vehicles for differentiation. For example, students could be asked to complete either tutorials for remediation or tutorials that cover advanced topics beyond those normally covered in class. This could be toward extra credit or as a part of course requirement. In a future study, it would be very inter-esting to see if effective differentiation could be achieved in a quantitative course by use of existing online resources.
Another limitation of this study is that in assessing the effectiveness of review video tutorials, we relied on self-report for the number of videos watched. Counting the
TABLE 6
Rating of Review Videos by Students (ND79)
Video
% of those who viewed Definitely
Rating of Course Topic Tutorials by Students (ND65)
Video Cond. Prob. Dec. Analysis 1 Dec. Analysis 2 LP Form. 1 LP Form. 2 Mean
% viewed 71 72 66 69 66 69
% of those who viewed
Definitely helpful 57 55 60 56 56 57
Somewhat helpful 35 32 28 36 33 33
Not helpful 2 4 5 4 5 4
Not sure 7 9 7 4 7 7
number of hits or requiring accompanying quizzes as we did with the course topic tutorials would have provided a more accurate measure.
This study differed from the existing studies in two ways. First, we did not compare the performance of the stu-dents between the term with the tutorials and a previous term without the tutorials. But we attempted to compare performance of students who utilized the tutorials to those who did not during the same term.
The second way this study was different was that we mixed curated videos with instructor-authored videos. Some students who have trouble with the course material will seek online tutorials, but it is difficult for students to find the video with the level, context, and emphasis that fit the course. An instructor supplying the appropriate tutorials fills the need of such students.
While curating or developing video tutorials is labor-intensive, this study and several other studies have shown there is apparent benefit to the students, and students tend to appreciate being provided such resources. A question instructors may ask is if students’ appreciation will translate to a more positive student evaluation of the instructor. This could be an interesting direction of a future study.
As online resources continue to proliferate, a part of instructors’ responsibilities could be to guide the students to the appropriate resources. The curation of the appropriate material could add significant value to course development and student learning. There is a need for more research on effectively creating, curating, and integrating the online resources to meet the learning objectives.
ACKNOWLEDGEMENTS
A preliminary version of this article was published in the Proceedings of the Northeast Decision Sciences Institute Annual Meeting, Philadelphia, March 2014 (Winch, 2014). The authors would like to thank Dr. Chu-hua Kuei of Pace University for his invaluable assistance in planning the video tutorial project and curating existing videos.
REFERENCES
Ayres, P. (2006). Impact of reducing intrinsic cognitive load on learning in a mathematical domain.Applied Cognitive Psychology,20, 287–298. Baharun, N., & Porter, A. L. (2012). A web-based learning support to
improve students’ learning of statistics.Proceedings of the 1st ISM
International Statistical Conference, 359–367.
Chickering, A., & Gamson, Z. (1987). Seven principles for good practice in undergraduate education.AAHE Bulletin,39(7), 3–7.
Cooper, B. J. (2004). The enigma of the Chinese learner.Accounting
Edu-cation,13, 289–310.
Gattis, L. (2008). Getting started with instructional podcasting.
Proceed-ings of the Journal of the Academy of Business Education,9. Retrieved
from http://www.abeweb.org/proceedings/proceedings08/gattis2.pdf
G€on€ul, F. F., & Solano, R. A. (2013). Innovative teaching: An empirical study of computer-aided instruction in quantitative business courses.
Journal of Statistics Education,21, 1–23.
Hardin, J. R., & Ellington, A. J. (2005). Using multimedia to facilitate soft-ware instruction in an introductory modeling course.INFORMS
Trans-actions on Education,5(2), 9–16.
Holden, J. T., & Westfall, P. J. L. (2006).An instructional media selection
guide for distance learning. Boston, MA: U.S. Distance Learning
Association.
Johnson, M., & Kuennen, E. (2006). Basic math skills and performance in an introductory statistics course. Journal of Statistics Education, 14(2). Retrieved from http://www.amstat.org/publications/jse/v14n2/johnson.html Kay, R., & Kletskin, I. (2012). Evaluating the use of problem-based video
podcasts to teach mathematics in higher education.Computers & Educa-tion,59, 619–627.
Leidner, D. E., & Jarvenpaa, S. L. (1995). The use of information technol-ogy to enhance management school education: A theoretical view.MIS
Quarterly,19, 265–291.
Leon, L., Seal, K. C., & Przasnyski, Z. H. (2007). Captivate your students’ minds: Developing interactive tutorials to support the teaching of spreadsheet modeling skills.INFORMS Transactions on Education,7, 70–87.
Lunsford, M. L., & Poplin, P. (2011). From research to practice: Basic mathematics skills and success in introductory statistics.Journal of
Sta-tistics Education,19(1). Retrieved from http://www.amstat.org/publica
tions/jse/v19n1/lunsford.pdf
Mayer, R. E., Mathias, A., & Wetzell, K. (2002). Fostering understanding of multimedia messages through pre-training: Evidence for a two-stage theory of mental model construction.Journal of Experimental
Psychol-ogy: Applied,8, 147–154.
McGarr, O. (2009). A review of podcasting in higher education: Its influ-ence on the traditional lecture. Australasian Journal of Educational
Technology,25, 309–321.
Nurre, S. G., & Sharkey, T. C. (2013, May).On student use and perception of video tutorials in an undergraduate operations research course within
an engineering curriculum. Paper presented at the 2013 Industrial and
Systems Engineering Research Conference, San Juan, Puerto Rico. Refseek. (2013). Educational video sites. Retrieved from http://www.
refseek.com/directory/educational_videos.html
Rich, K. T. (2012). Exercise-based video podcasts as a learning aid for introductory financial accounting students.Advances in Accounting
Edu-cation,13, 185–211.
Sargent, C. S., Borthick, A. F., & Lederberg, A. R. (2011). Improving retention for principles of accounting and elementary statistics students: Ultra-short tutorials designed to motivate effort and improve perfor-mance.Issues in Accounting Education,26, 657–679.
Schneider, C. (2013, July 22).40 sources for curated educational videos. Retrieved from http://gettingsmart.com/2013/07/40-sources-for-curated-educational-videos/
Stephenson, J. E., Brown, C., & Griffin, D. K. (2008). Electronic delivery of lectures in the university environment: An empirical comparison of three delivery styles.Computers & Education,50, 640–651.
Stevens, S., & Palocsay, S. (2004). A translation approach to teaching linear pro-gramming formulation.INFORMS Transactions on Education,4(3), 38–54. Sweller, J., & Chandler, P. (1994). Why some material is difficult to learn.
Cognition and Instruction,12, 185–233.
Winch, J. (2014, March).Tutorial videos as a supplement in a management
science course. Presented at the Northeast Decision Sciences Institute
Annual Meeting, Philadelphia, PA.
Xu, Y. J., Meyer, K. A., & Morgan, D. D. (2009). A mixed-methods assessment of using an online commercial tutoring system to teach intro-ductory statistics. Journal of Statistics Education, 17(2). Retrieved from http://www.amstat.org/publications/jse/v17n2/xu.html
Yates, G. C. R. (2005). “How obvious”: Personal reflections on the data-base of educational psychology and effective teaching research.
Educa-tional Psychology,25, 681–700.
IMPROVING PERFORMANCE WITH SUPPLEMENTAL VIDEOS 409