Received November 16th, 2011, Revised August 31st, 2012, Accepted for publication November 9th, 2012. Copyright © 2012 Published by LPPM ITB, ISSN: 1978-3086, DOI: 10.5614/itbj.ict.2012.6.3.1
Performance Comparison of Several Pre-Processing
Methods in a Hand Gesture Recognition System based on
Nearest Neighbor for Different Background Conditions
Regina Lionnie, Ivanna K. Timotius & Iwan Setyawan
Department of Electronic Engineering, Satya Wacana Christian University, Jalan Diponegoro 52-60, Salatiga, 50711, Indonesia
Email: reginalionnie@gmail.com
Abstract. This paper presents a performance analysis and comparison of several processing methods used in a hand gesture recognition system. The pre-processing methods are based on the combinations of several image pre-processing operations, namely edge detection, low pass filtering, histogram equalization, thresholding and desaturation. The hand gesture recognition system is designed to classify an input image into one of six possible classes. The input images are taken with various background conditions. Our experiments showed that the best result is achieved when the pre-processing method consists of only a desaturation operation, achieving a classification accuracy of up to 83.15%.
Keywords: binary image processing; desaturation; edge detection; hand gesture
recognition; histogram equalization; low-pass filtering; nearest neighbor.
1
Introduction
Many people still find the interaction with machines an uncomfortable experience. Using keyboard and mouse are cumbersome ways to interact. Efforts should be made to adapt machines to our natural means of communication [1]. Hand gestures, as a part of human body language, are used for many purposes. Hand gestures as a communication tool with machines can be used in many fields. Examples of such uses are socially assistive robotics, computer interfaces, game technology, assistance of surgeons and also military robotics [2],[3].
A recognition system typically consists of pre-processing steps and a classifier. The classifier used in the proposed system is a nearest neighbor classifier. In our previous work [7], we have presented a hand gesture recognition system using images against a uniform white background. In this paper, we improve the system using images taken against a different background, namely an environmental background, because this type of background is mostly found in military situations. We have also implemented more pre-processing methods compared to our previous work [7], in which we have only used combinations of histogram equalization and desaturation. The additional pre-processing methods implemented in this paper are: edge detection, low pass filtering and image binary processing in HSI color space.
The rest of this paper is organized as follows. Section 2 discusses the image processing operations we used as pre-processing methods. In Section 3, a more detailed discussion of the nearest neighbor classifier is presented. Section 4 describes the overall system proposed in this paper. Experiment design and results are presented in Section 5. An analysis of the results is presented in Section 6. Finally, our conclusions are given in Section 7.
2
Pre-Processing
Pre-processing is a process of preparing data for another procedure. This pre-processing step aims to transform the data into a form that can be more easily and effectively processed [8]. In this paper, the pre-processing steps are built on the basis of several combinations from the following image processing operations: edge detection, low pass filtering, histogram equalization, binary image processing (i.e. thresholding) in HSI color space, and desaturation. These image-processing operations are discussed in more detail below.
Figure 1 The Sobel operators.
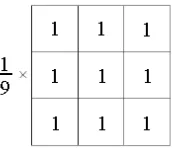
The second image processing operation used during pre-processing is the application of a low pass filter. Low pass filters or smoothing filters are used to produce an output image that is smoother than the input image. This filter works by suppressing the high-frequency contents of the image, including noise. Since we worked with color images in this study, the smoothing filter was applied to each color component (i.e., the R, G and B components) of the image. In this study, we have used the 3×3 averaging filter [11]. The kernel of the low pass filter is shown in Figure 2.
Figure 2 The kernel of the low pass filter.
The next image-processing operation used during pre-processing is histogram equalization. The histogram of an image represents the distribution of pixel values in the image. Furthermore, it also approximates the probability distribution of pixel values in the image. This distribution is directly reflected in the appearance of the image. An image with poor contrast will have a narrow histogram. On the other hand, an image whose histogram resembles a uniform distribution has good contrast. Histogram equalization is a process employed to adjust the histogram of an image such that the pixel values in the image are more uniformly distributed. Because of this, histogram equalization can be used to adjust the contrast of an image [12]. Since histogram equalization enhances the contrast of the image, it can reveal more details in the image. This can potentially aid the classfication process.
performed in HSI color space because it is appropriate for describing color, especially human skin color. HSI color space is an ideal tool for developing image processing algorithms based on color descriptions that are natural and intuitive to humans. Hue is an attribute associated with the dominant wavelenght in a mixture of light waves. Saturation refers to the relative purity or the amount of white light mixed with a hue [11], while intensity shows the amount of light or white it contains [13]. The conversion from the original RGB color space to HSI is performed after the low pass filtering or histogram equalization operations (or after both operations in cases in which the pre-processing step contains both operations), and before the edge detection operation (if applicable). After conversion, a thresholding operation is performed to produce a binary image in which the areas of the image that correspond to human skin color will be changed into white and other areas will be changed into black. The detection of human skin color is based on the hue value of the pixels. In this study, areas having hue values < 43 were designated as human skin areas. This threshold has been obtained empirically.
The final image processing operation used during pre-processing is desaturation. Desaturation is a process that converts an image into a grayscale image by removing the chromatic (color) information. In other words, we only preserve the intensity information of the pixels. We can do this most easily by using the HSI color space, since it can be achieved by simply taking the intensity layer (I). The conversion from RGB color space to HSI color space is performed before the edge detection operation (if applicable). In this study, we did not combine the desaturation operation with low pass filtering, histogram equalization or thresholding.
As mentioned in the previous section, the pre-processing methods implemented in this study consist of combinations of two or more of the five image processing operations described above. These combinations will be discussed further in Section 4.
3
1-Nearest Neighbor
The K-nearest neighbor (k-NN) classifier is a method that classifies objects based on the class of k-closest neighbors [14]. The input vector for this method is the vector obtained by reshaping the input image into a column vector.
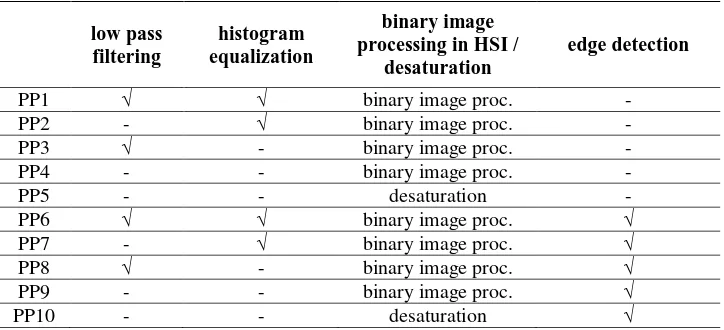
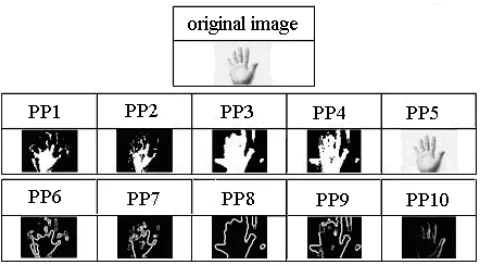
according to the Euclidean distance criterion, the distance between a and b is operates in two phases, namely the training phase and the testing phase. During the training phase, the input images of the system are training images, while during the testing phase the input images of the system are test images. As shown in this figure, the input images are first processed using various combinations of the image-processing operations described in Section 2. We have used ten pre-processing combinations in order to compare their performances. These combinations are presented in Table 1. The pre-processing operations were performed sequentially, that is from the leftmost entry of this table to the rightmost entry. The pre-processing output is shown in Figure 4. After pre-processing, the input image was fed into the nearest neighbor classifier. The classifier then classified the input image into one of six classes.
Table 1 Ten variants of the pre-processing methods.
Figure 3 Overall block diagram of the proposed system.
Figure 4 Examples of image as output from system with and without edge detecton with a uniform white background.
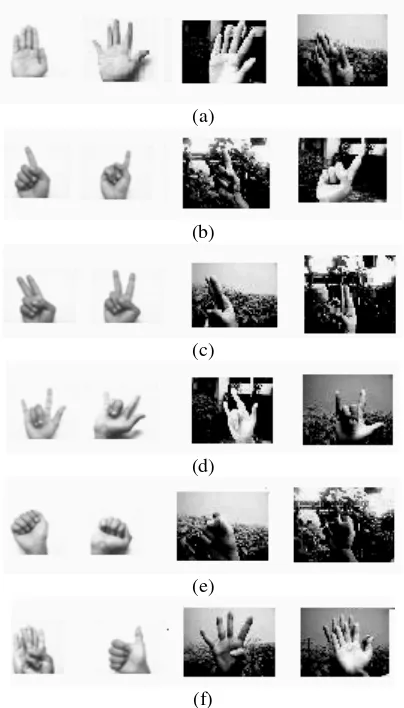
Figure 5 shows examples of several hand gestures and their variations. Within each class there are two main variations, namely in the exact shape of the gesture and in the background, with various background conditions. For example, Figure 5(a) shows gestures belonging to one class. But it can be clearly seen that while all gestures show an open palm with all fingers extended, the exact positions of the hand and fingers vary. Furthermore, the first two images in Figure 5(a) are taken against a uniform white background, while the last two are taken against environmental backgrounds. These backgrounds are much more complex as there are other objects (including trees and bushes) in the frame beside the hand gesture itself.
overlapping hands in the input image, although these hands do make valid gestures. An example of this is shown in the rightmost image of Figure 5(f).
(a)
(b)
(c)
(d)
(e)
(f)
Figure 5 Classes in classification: (a) first class (b) second class (c) third class (d) fourth class (e) fifth class (f) sixth class.
5
Experimental Setup and Results
The experiment conducted in this study employed cross validation to measure the performance of the system using the various pre-processing variants. We used 10 runs of 2-fold, 5-fold and 10-fold cross validations.
University (SWCU) hand gesture database. Each of the images is taken using a web camera. The images are in RGB color format, with a resolution of 320×240 pixels. The camera’s automatic white balance was used. The hand gestures images were taken from 30 respondents. The images were taken against two different backgrounds, a uniform white background and an environmental background. All input images were taken under controlled conditions. The images with a white background were taken in a closed room with sufficiently bright and uniform lighting from fluorescent light. The images with a real-world background were taken in bright daylight.
For each respondent and each background condition, the VISiO hand gestures database contained 48 hand gesture images belonging to 6 classes. Each class consisted of 8 images with variations in the angle of the hands. In total, 2880 images were used as the training and testing data set for cross validation. Some examples of these images are presented in Figure 3.
In the proposed system, the original 320×240 pixels images are resized by resampling the images into a resolution of 64×48 pixels. This step is performed to reduce the computational load of the system. In reducing the size of the images, we do lose a considerable number of pixels. The loss of pixels mainly affecs the small details in the image, for example the surface details of the skin. Since in this system we are interested only in the shape of the hand in the gestures and not in the details of the skin surface, this loss of pixels should not have any significant effect on the performance of the proposed system.
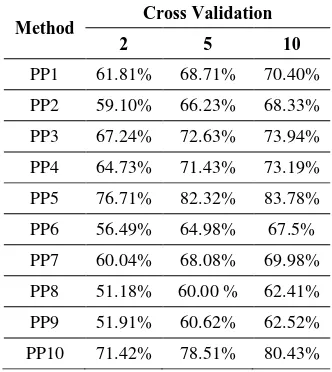
Table 2 Average accuracy with a uniform white background.
Method Cross Validation
2 5 10
PP1 61.81% 68.71% 70.40%
PP2 59.10% 66.23% 68.33%
PP3 67.24% 72.63% 73.94%
PP4 64.73% 71.43% 73.19%
PP5 76.71% 82.32% 83.78%
PP6 56.49% 64.98% 67.5%
PP7 60.04% 68.08% 69.98%
PP8 51.18% 60.00 % 62.41%
PP9 51.91% 60.62% 62.52%
Table 3 Average accuracy with an environmental background.
Method Cross Validation
2 5 10
PP1 60.17% 68.92% 71.12%
PP2 56.45% 65.16% 66.98%
PP3 70.51% 77.15% 78.95%
PP4 70.12% 77.01% 78.83%
PP5 71.45% 79.81% 82.17%
PP6 57.24% 66.35% 68.76%
PP7 58.12% 66.47% 68.90%
PP8 58.51% 66.64% 68.91%
PP9 59.10% 67.03% 68.90%
PP10 64.83% 73.80% 75.96%
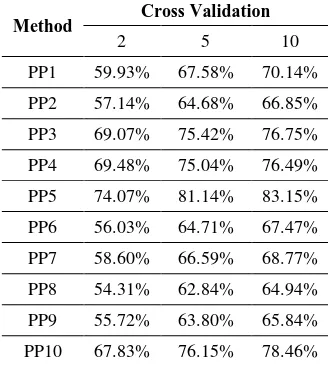
The results of the experiment, i.e. the average accuracy of the 10 runs of cross-validation, are presented in the following tables. Table 2 presents the average accuracy achieved by the system when the input images had a uniform white background. Table 3 presents the average accuracy of the proposed system when the input images had an environmental background. Finally, Table 4 presents the average accuracy of the proposed system when the input included both images with a uniform white background and an environmental background.
Table 4 Average of accuracy with both white and enviromental backgrounds.
Method Cross Validation
2 5 10
PP1 59.93% 67.58% 70.14%
PP2 57.14% 64.68% 66.85%
PP3 69.07% 75.42% 76.75%
PP4 69.48% 75.04% 76.49%
PP5 74.07% 81.14% 83.15%
PP6 56.03% 64.71% 67.47%
PP7 58.60% 66.59% 68.77%
PP8 54.31% 62.84% 64.94%
PP9 55.72% 63.80% 65.84%
6
Discussion
From Tables 2, 3 and 4 we can see that the performance of the system was higher with a higher number of folds for the cross-validation, since a higher number of folds means that the number of training data, compared to the test data, is larger. Therefore, in this section we will base our discussion on the accuracy obtained by the system with 10-fold cross-validation.
Table 2 shows that for input images with a uniform white background, the use of edge detection as part of the pre-processing step lowered the accuracy. For example, the accuracy of PP1 was higher than that of PP6. The difference between these two pre-processing steps is in the use of edge detection. This can be explained as follows. The output of an edge detector contains only the edges of the input image without the areas within the objects in the image. Therefore, a slight variation in object’s position will greatly influence the result of the classification process. The proposed system uses a nearest neighbor classifier. This type of classifier only performs a substraction operation between the training and testing vectors. Since the vectors containing image edges are very sparse, even a slight variation of the object position (and hence, the edge positions) will result in a large difference. An exception is observed, however, for PP2 and PP7 in which the accuracy of PP2 is lower than PP7, although the difference is not significant and can be attributed to the randomization performed in the cross validation process. A similar trend is also observed in Tables 3 and 4, i.e. the use of edge detection tends to lower system accuracy except in the case of PP2 and PP7.
When we compare the results of Tables 2 and 3, we observe that for most cases, the system’s performance was higher when the hand gesture was captured against an environmental background. In the case of PP1 and PP6, the performance improvement was very small and can be attributed to the randomization done in the cross validation process. However, in other cases, such as PP3, PP4, PP8 and PP9, the performance increase was quite significant. In the case of PP3, PP4, PP8 and PP9, the main contributing factor to this phenomenon is the hue of the background. The environmental background used in these experiments was dominated by a green hue, which is very different from that of the human skin. Therefore, the thresholding operation was capable of separating the object (i.e. the hand) from the background. This in turn improved the performance of the classifier.
the system operates as if we have two parallel classifiers, one for the images with a white background and one for the images with an environmental background. The overall system performance then falls between the performances of these two classifiers. Finally, we can also conclude that the best pre-processing variant (in terms of system accuracy) was PP5. This holds true for all types of input image background.
7
Conclusion
In this study, we have compared ten variants of pre-processing methods applied to a hand gesture recognition system. Our experiments showed that the best pre-processing variant was PP5, giving a system accuracy of up to 83.78%. In future work, we will expand our hand gesture database to include images with more varied backgrounds, both in terms of complexity and hue variation.
References
[1] Nielsen, E.S., Anton-Canalis, L. & Herandez-Tejera, M., Hand Gesture Recognition for Human-Machine Intelligence, Journal of International Conferences in Central Europe on Computer Graphics, Visualization and Computer Vision, 12(1-3), 2004.
[2] Chung, W.K., Wu, X. & Xu, Y., A Real Time Hand Gesture Recognition based on Haar Wavelet Transformation, in Proc. of IEEE International Conference on Robotics and Biometrics, 2009.
[3] Kypson, A.P. & Chitwood Jr, W.R., Robotic Applications in Cardiac Surgery, in Proc. International Journal of Advanced Robotic Systems, 1(2), 2004.
[4] Visual Signals, Field Manual (FM 21/60), Department of The Army, Washington, DC, 1987.
[5] Triesch, J. & Von der Malsburg, C., A Gesture Interface for Human-Robot-Interaction, in Proc. 3rd International Conference on Face & Gesture Recognition, 1998.
[6] Stern, H., Parameter Calibration for Reconfiguration of Hand Gesture Tele-Robotic Control System, in Proc. Japan–USA Symposium on Flexible Automation, 2004.
[7] Lionnie, R., Timotius, I.K. & Setyawan, I., An Analysis of Edge Detection as a Feature Extractor in a Hand Gesture Recognition System based on Nearest Neighbor, in Proc. of International Conference on Electrical Engineering and Informatics, 2011.
[9] Canny, J., A Computational Approach to Edge Detection, IEEE Trans. Pattern Anal. Mach. Intell., PAMI-8(6), pp. 679-698, 1986.
[10] Panda, C.S. & Patnaik, S., Better Edgegap in Grayscale Image Using Gaussian Method, International Journal of Computational and Applied Mathematics, 5(1), 2010.
[11] Gonzales, R.C. & Woods, R.E., Digital Image Processing, 3rd ed., Prentice Hall, 2008.
[12] Yoon H., Han Y. & Hahn, H., Image Contrast Enhancement based Sub-histogram Equalization Technique without Over-equalization Noise, in Proc. International Conference on Control, Automation and System Engineering, 2009.
[13] Burdick, H.E., Digital Imaging: Theory and Applications, McGraw-Hill, 1997.