Suitability of laser data for DTM generation: a case study in the
context of road planning and design
L.M. Gomes Pereira
a,), L.L.F. Janssen
ba
Ministry of Transport, Public Works and Water Management Rijkswaterstaat, SurÕey Department, PO Box 5023, 2600 GA Delft,
Netherlands
b ( )
International Institute for Aerospace SurÕey and Earth Sciences ITC , PO Box 6, 7500 AA Enschede, Netherlands
Abstract
Laser range data acquired from a helicopter are evaluated in terms of the information that can be derived from them and the accuracy. The objective is to study the suitability of laser data to generate a DSM for road planning and design in The Netherlands. The conclusion is that high-density laser measurements allow the reconstruction of the terrain relief with the required accuracy. Nonetheless, they do not allow the extraction of all the information required, particularly semantic information. Thus, the combination of laser data with existing information is a prerequisite. This process of combining laser data with existing geographic information is not trivial. The rate of success depends much on the quality of the individual datasets and the method used to combine them. This problem appears in a much broader context, that of spatial data fusion, and should be the object of future research.q1999 Elsevier Science B.V. All rights reserved.
Keywords: laser scanning; DTM; DSM; road planning and design; accuracy
1. Introduction
Rijkswaterstaat is involved in the planning, de-sign, construction and maintenance of the highways in The Netherlands. Presently, Rijkswaterstaat main-tains approximately 3000 km of highways, having at a minimum 4 lanes.
Because of the importance of the road network for further economic development, new highways are being proposed and their impact, especially on the environment, needs to be evaluated. If the planned
)Corresponding author. Escola Superior de Tecnologia e Gestao
˜
´ ´
de Agueda, Apartado 473, Zona Industrial-Alagoa, 3751 Agueda Codex, Portugal. Fax:q351-34-603838; E-mail: [email protected]
road has to be changed, alternative routes have to be planned rapidly. Thus, the method to acquire the new information has to be fast. At present, road planning and design are carried out with the help of a DSM generated by photogrammetric means. Because pho-togrammetry is a time consuming technique, infor-mation is acquired over a much wider area than that needed to plan the initial road.
Laser scanning could fulfill the desire for faster methods. In this article, we investigate the suitability of laser data to generate a DSM for road planning and design in The Netherlands.
Over the past years, Rijkswaterstaat has been experimenting on using laser scanning data to map
Ž
the coastal regions of The Netherlands Huising et al., 1996; Huising and Vaessen, 1997; Vaessen et al.,
0924-2716r99r$ - see front matterq1999 Elsevier Science B.V. All rights reserved.
Ž .
( )
L.M. Gomes Pereira, L.L.F. JanssenrISPRS Journal of Photogrammetry & Remote Sensing 54 1999 244–253 245 .
1998 , and to produce a DTM of the complete country in a grid format of 1 point per 16 m2 ŽMinistry of Transport, Public Works and Water
.
Management, 1997 . Obviously, these types of appli-cations are less demanding than that of producing information for road planning and design. Although all applications require filtering of both blunders and
Ž
undesired objects Fritsch and Kilian, 1994; Pfeifer .
et al., 1998 , the extraction of information from laser measurements for the purpose of road planning and design requires more sophisticated procedures to
re-Ž
cover and identify the objects on the terrain Weidner, .
1996; Haala and Brenner, 1997 .
In the following sections, we will first present briefly the current practice of DSM production for road planning and design at Rijkswaterstaat. In addi-tion, we will determine which type of informaaddi-tion, both semantic and geometric, can be extracted from high-density laser measurements. The planimetric and altimetric accuracies of the laser data are also as-sessed by using reference measurements. The article finishes with some conclusions and recommenda-tions.
2. Current practice of DSM production for road planning and design at Rijkswaterstaat
At the Survey Department of Rijkswaterstaat, the terrain relief is extracted by measuring pertinent morphologic features. These features consist of both single points, and strings of points on flat surfaces and on places where the terrain slope or curvature
Ž .
changes abruptly category 1 in Table 1 . Attached to
the coordinates of these features is also semantic information that classifies the feature, e.g., as a single point or a breakline. This semantic informa-tion is however not further used, except to compute a
Ž .
triangulated irregular network TIN . The recovery of the objects on the terrain relates to the determina-tion of the co-ordinates of specific points as well as to their semantic information explicitly required by
Ž .
the user category 2 in Table 1 .
The DSM produced at the Survey Department has thus two different types of semantic information. One type is relevant solely to recover the terrain relief with sufficient accuracy, while the other is explicitly requested by the user. This means that, if laser scanning allows the extraction of terrain relief with the required quality and efficiency by measur-ing a dense set of points, only the second type of semantic information is required.
The DSM is presently generated by photogram-metric means using colour photography at a scale of 1:4000. The user requirements in terms of accuracy are 25 cm in planimetry and altimetry for both the planning and design phases. In case of hard struc-tures such as roads, and for the purpose of road design, the altimetric accuracy is required to be 7.5 cm. Although photogrammetric DSMs have been used to plan and design roads for several years, it is not yet known if it has the required accuracy. This is because the DSM accuracy is a function of not only the measuring precision, which is known, but also of the sampling and modelling strategies. The sampling strategy has a strong human component. Although
Ž .
the features to be measured are listed as in Table 1 , and there are guidelines to help the operator in
Table 1
Information content of a DSM produced at the Survey Department of Rijkswaterstaat DSM features
Category 1: terrain relief Category 2: objects on terrain
Ž .
Slopes: upper side and lower side described by breaklines Separation line between two paved surfaces
Ž .
Flat surfaces described by strings of points Separation line between paved and unpaved surfaces
Ž .
Highly curved surfaces described by strings of points Lines painted on roads
Individual points Protection walls: dam, quay
Water boundaries Ditches
selecting such features and the number of measure-ments per feature, human interpretation always plays a role. The modelling strategy relates to the function
Ž used for interpolation and to the data format e.g.,
.
grid or TIN . At present, a study is being carried out to assess the accuracy of photogrammetric DSMs by using tachymetric measurements as reference.
3. Study area and data
The laser data were acquired by the contracted Ž
survey company Eurosense P.O. Box 4923, 4803 .
EX Breda, The Netherlands . This company was responsible for the flight procedure, the calibration of the laser system, and post-processing of the laser measurements. The latter included conversion of the coordinates of the points to the Dutch national refer-ence system, and filtering of blunders and of mea-surements made on trees and houses. Filtering was carried out by means of automatic procedures devel-oped at the company, followed by visual control and manual editing.
The laser system consists of a laser scanner, the Saab TopEye, a Trimble 4000 SSi GPS receiver and
Ž
a Honeywell H423 INS technical details of the laser .
system can be found in Janssen, 1997 . The expected planimetric and height accuracy varies between 10
Ž .
and 30 cm www.combitech.sersurvey . To obtain a dense distribution of measurements, the system was mounted on a Eurocopter AS 350 helicopter that flew at a mean flying height of 240 m. The flight took place in March 1996, during which period the amount of leaves on trees is minimal, facilitating acquisition of data at the ground level. By using a pulse frequency around 5 kHz and a scanning angle of 108 a swath width of approximately 80 m was obtained. This, together with a mean flying speed of 15 m sy1, yielded on the average 4 points per m2.
These points are distributed on the ground in a Z-shaped form.
The data acquired with the help of the laser system refer to the X, Y, and Z coordinates of points
2 Ž .
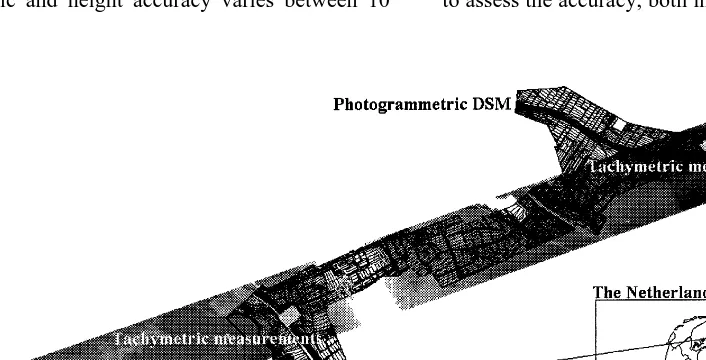
in a 10 km area in the region of Groningen Fig. 1 . The area has flat relief and parts are covered with trees and man-made objects such as buildings and roads.
To study the feasibility of extracting the geo-graphical information in Table 1 from laser data, the unfiltered laser measurements need to be used. To facilitate the extraction of the terrain relief, the fil-tered data, delivered by the company in a grid format of 1 m=1 m, is used instead. These two datasets will be referred to as laser-DSM and laser-DTM.
To inspect the laser data for systematic errors and to assess the accuracy, both in planimetry and
altime-Ž Ž . Ž
Fig. 1. Laser-DSM and reference measurements photogrammetric DSM region with black overlay and tachymetric measurements two
..
( )
L.M. Gomes Pereira, L.L.F. JanssenrISPRS Journal of Photogrammetry & Remote Sensing 54 1999 244–253 247 try, three sets of reference measurements are used.
Two of these datasets are tachymetric measurements ŽFig. 1 carried out in March 1996. The third set is a. DTM of the area and the coordinates of the roof
Ž .
corners of buildings Fig. 1 . This DSM has been generated by means of photogrammetric measure-ments on true colour aerial photographs at a scale of 1:4000 also acquired in March 1996. The expected planimetric and height accuracies of the measured features are 6 and 7 cm, respectively.
4. Information content of the laser data
In this section, it is assessed which of the infor-mation in Table 1 can be extracted from laser mea-surements. For this purpose, the laser-DTM and the laser-DSM mentioned above are used. The informa-tion that cannot be extracted from the laser data has to be collected from existing sources of information, such as databases. In this context, some considera-tions are also given to the combination of laser data with Dutch 2D and 3D databases.
4.1. Extraction of information from laser data alone
Extraction of information comprises detection, identification, modelling, measuring, and labelling. The last two processes provide the geometric and semantic information of the features, while the first three permit one to recover this information. The modelling procedure will have a great impact on the
Ž .
final accuracy Section 5 . Some of the procedures may be considered together like detection and identi-fication, and modelling and measuring. Thus, the terms ‘detection’ and ‘modelling’ are used hereafter in this broader sense.
Extraction of information is considered both man-ually and automatically. To extract manman-ually geo-metric and semantic information, visual inspection of the laser data is required. This can be done with the help of so-called laser images created by assigning a grey value to, for example, the height information. The laser images can also be displayed as a perspec-tive view or in stereo, which facilitates
interpreta-Ž
tion. The display of an image in stereo can easily be achieved by creating two perspective views from two
different viewpoints and by using a screen with .
stereo capability.
By using the laser images, the operator is only able to extract 2D geometric information. The Z coordinate has to be estimated afterwards by means of automatic modelling. The information that can be extracted in this way from the laser-DSM is tabu-lated in Table 2. From this table, it can be seen that it is possible to extract all the features that describe the terrain relief. Concerning objects on the terrain, the semantic information of 60% of the object types Ži.e., 4 out of the 7 features of category 2 in Table 1. cannot be recovered.
The automatic extraction of information is only partly possible because its labelling is still unfeasi-ble. Automatic extraction of the geometric informa-tion in Table 1 was only implemented for those features that correspond to abrupt changes in terrain
Ž .
slope hereafter referred to as breaklines . This means that only the features that describe the terrain relief were extracted by using the laser-DTM. Objects on the terrain cannot be extracted automatically solely from laser range data. The research on this subject
Ž .
combines laser with images Haala, 1994, 1995 ,
Ž .
existing databases Haala and Brenner, 1997 , or the intensity of the laser beam recorded simultaneously
Ž .
with the range data Hug and Wehr, 1997 .
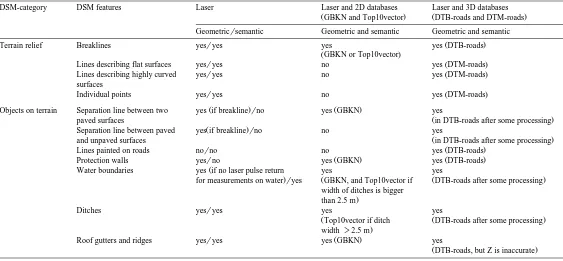
To extract the breaklines automatically, first a laser-DTM image was created. The Laplacian opera-tor is applied to this laser image to detect edges. Fig. 2a illustrates automatically detected breaklines. The corresponding manually extracted breaklines are de-picted in Fig. 2b. As it can be seen, there are more breaklines detected manually than automatically. Furthermore, the breaklines detected automatically need to be edited. As for the manually extracted breaklines, the automatically extracted breaklines have to be converted from 2D to 3D features. This procedure signifies modelling, which may be done in several ways. If only linear interpolation is used, the
Ž
quality of the modified laser-DTM with the
break-. Ž .
()
L.M.
Gomes
Pereira,
L.L.F.
Janssen
r
ISPRS
Journal
of
Photogrammetry
&
Remote
Sensing
54
1999
244
–
253
Table 2
Geographic information that can be extracted from laser measurements alone or in combination with existing databases
DSM-category DSM features Laser Laser and 2D databases Laser and 3D databases
ŽGBKN and Top10vector. ŽDTB-roads and DTM-roads.
Geometricrsemantic Geometric and semantic Geometric and semantic
Ž .
Terrain relief Breaklines yesryes yes yes DTB-roads
ŽGBKN or Top10vector.
Ž .
Lines describing flat surfaces yesryes no yes DTM-roads
Ž .
Lines describing highly curved yesryes no yes DTM-roads
surfaces
Ž .
Individual points yesryes no yes DTM-roads
Ž . Ž .
Objects on terrain Separation line between two yes if breaklinerno yes GBKN yes
Ž .
paved surfaces in DTB-roads after some processing
Ž .
Separation line between paved yes if breaklinerno no yes
Ž .
and unpaved surfaces in DTB-roads after some processing
Ž .
Lines painted on roads norno no yes DTB-roads
Ž . Ž .
Protection walls yesrno yes GBKN yes DTB-roads
Ž
Water boundaries yes if no laser pulse return yes yes
. Ž Ž .
for measurements on waterryes GBKN, and Top10vector if DTB-roads after some processing width of ditches is bigger
.
than 2.5 m
Ditches yesryes yes yes
ŽTop10vector if ditch ŽDTB-roads after some processing. .
width)2.5 m
Ž .
Roof gutters and ridges yesryes yes GBKN yes
( )
L.M. Gomes Pereira, L.L.F. JanssenrISPRS Journal of Photogrammetry & Remote Sensing 54 1999 244–253 249
Ž . Ž .
Fig. 2. a Automatically detected breaklines from a laser-DTM image; b the corresponding manually measured breaklines.
surface approximation methods. A simple model is to reconstruct a breakline as the intersection of two planes, computed by using the least squares method. Before modelling, some processing may be needed to close broken lines, and delete small lines as well as those lines that result from wrongly detected edges. This editing process is totally or partly man-ual.
4.2. Extraction of information from laser data in combination with existing databases
In Section 4.1, it was clearly stated that laser data alone does not allow the extraction of all the infor-mation needed to generate a DSM for road planning and design. Furthermore, the quality of information may need to be improved. Thus, combination of laser with existing information is a prerequisite. In this section, only the combination of laser data with 2D and 3D Dutch databases is considered. No testing was carried out for the feasibility of such combina-tion.
The databases considered are the 2D databases GBKN and Top10vector, and the 3D databases DTB-roads and DTM-roads. GBKN is a large-scale topographic base map, and Top10vector is a large-scale topologically structured vector database in large-scale 1:10000, generated by photogrammetric means. DTB-roads is a large scale database for road mainte-nance, produced by photogrammetric and terrestrial means, while DTM-roads is a database for road construction, generated by terrestrial means.
Information stored in such databases can be used not only to label some of the features in the DSM,
but also to locate them, e.g., boundaries of buildings or lines painted on roads. If the database is not object-oriented, as is the case of GBKN, before feature extraction, e.g., of buildings, from the points and lines, some processing has to be carried out to
Ž
group them into meaningful objects Lemmens et al., .
1997 . Their location in the laser data furnishes the height values for the objects in the database. This process, i.e., the projection of the objects or features in the database onto the laser data, requires some care. Their related semantic information should be used for a more adequate estimation of the heights. For objects on the terrain, like buildings, this estima-tion must be carried out using the raw measurements Žlaser-DSM . Obviously, if the database is 3D and. the heights are accurate, modelling may not be re-quired.
Table 2 lists which of the information in Table 1 can be collected by combining laser data with the databases mentioned above. Since laser allows the extraction of the relief information, combination with databases is in principle needed solely to extract objects on the terrain.
5. Accuracy assessment of the laser data
Considering that the required height accuracy of the Ž DTM for road planning and design is 25 cm 7.5 cm
.
for hard surfaces like roads , and the laser-DTM is quite dense, one should verify first if the laser-DTM allows the terrain to be reconstructed with an accu-racy comparable to that required.
In this section, we estimate first both the plani-metric and height accuracy of the laser measure-ments. Then, the altimetric accuracy of the laser-DTM is computed. Accuracy is represented here by
Ž .
the root mean square difference RMSE between the laser and reference data.
5.1. Accuracy of the raw laser measurements
The accuracy of the measurements is determined by the laser system, the process of measuring pro-cess, and the terrain itself. With respect to the laser system, the accuracy depends for instance on the signal-to-noise ratio of the received signal, the diver-gence of the laser beam, and the laser wavelength. Aspects of the measuring process that influence ac-curacy are for example, the viewing direction of the system, position and orientation errors of the plat-form, angle of incidence, transmission properties of the atmosphere, and the amount of background varia-tion. Regarding the terrain itself, the shape and spec-tral properties of land cover, and the slope with respect to the viewing direction also influence the
Ž
accuracy Heerd et al., 1997; Lemmens and Fortuin, .
1997 .
Another factor that influences accuracy is the strategy adopted by the company to acquire and process the data. Of great importance is the way the adjustment of the several strips of laser data is carried out. Our experience of sub-contracting com-panies that acquire laser data shows that different
companies have different adjustment methods, if any. Therefore, it is advisable that customers specify a proper adjustment procedure before data acquisition.
5.2. Altimetric accuracy
The height accuracy of the laser measurements is strongly related to the accuracy of the laser system and to the terrain geometry. Because the latter is variable, and because its impact on the measured heights is also expressed in terms of the accuracy of the laser-DTM, the accuracy in altimetry is only estimated at locations where the terrain is generally
Ž
flat furthermore, the influence of errors in planime-.
try will be minimised . This estimate is considered to be a fair approximation of the altimetric accuracy of the laser measurements. The points used for testing are not the original points as measured by the laser, but those bilinearly interpolated from the laser-DTM at the same locations as the reference measurements. Because only flat regions are used, the related inter-polation errors are very low.
Three datasets are used to estimate the altimetric accuracy of the laser measurements: two sets are made of tachymetric measurements, and the third set is made of photogrammetrically measured points. The two sets of tachymetric measurements were carried out on bare soil and soil covered with low
Ž .
grass mean height 5 cm respectively, with an
ex-Ž .
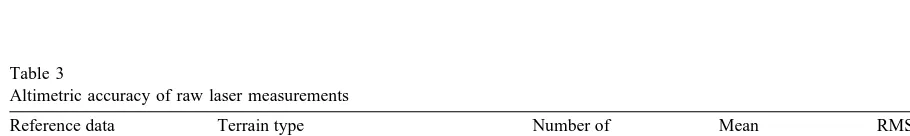
pected accuracy RMSE of 3 cm. The photogram-metrically measured points were collected separately on roads covered with asphalt, and on bare soil and soil covered with low grass, with an expected RMSE of 7 cm. The obtained results are shown in Table 3. The RMSE values of 8 cm on roads and around 15 cm on fields with low grass and on bare soil
Table 3
Altimetric accuracy of raw laser measurements
Reference data Terrain type Number of Mean RMSE
Ž . Ž .
measurements error cm cm
Tachymetric bare soil 362 y5 10
soil with low grass 397 y2 16
Photogrammetric paved road 344 y2 8
( )
L.M. Gomes Pereira, L.L.F. JanssenrISPRS Journal of Photogrammetry & Remote Sensing 54 1999 244–253 251
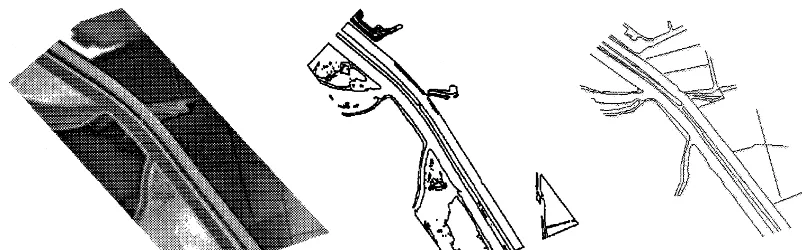
Ž . Ž .
Fig. 3. a Manually extracted outlines of building roofs in a laser image; b the corresponding roof outlines collected photogrammetrically.
corroborate the specified height accuracy of 15 cm ŽSection 3 ..
5.3. Planimetric accuracy
The accuracy in X and Y of laser measurements should be computed by identifying the same points in the laser data and in the reference data. The most suitable points are the corners of building roofs. Obviously, the laser beam does not necessarily hit the corners of building roofs in the reference data. Thus, the planimetric accuracy can only be estimated roughly by modelling the roof boundaries. This is done by creating a grid for which the height values are estimated from the raw measurements in a neigh-bourhood. This grid can be converted into a laser image and the roof corners can then be measured manually. The grid spacing and neighbourhood sizes will influence the operator’s interpretation. This is
also influenced by the method the height value as-signed to each pixel is computed within its neigh-bourhood. For this test, the height value of each pixel is estimated as the maximum height in the neighbourhood. As grid spacing and neighbourhood sizes, we chose the somewhat ad-hoc values of 50 cm=50 cm, and of 80 cm=80 cm.
The final set of X and Y coordinates of 163 corners of the building roofs as measured by an operator in the laser images are then compared with those measured photogrammetrically with an
accu-Ž .
racy of 6 cm Fig. 3 . The variance of the differences thus computed is influenced by the measuring accu-racy of the operator. Therefore, the variance of the operator’s measurements is also estimated and
sub-Ž
tracted from that of the differences the measuring .
accuracy of the operator is 14 cm . The final plani-metric accuracy of the laser measurements is found to be equal to 21 cm, whereas the mean error is 4
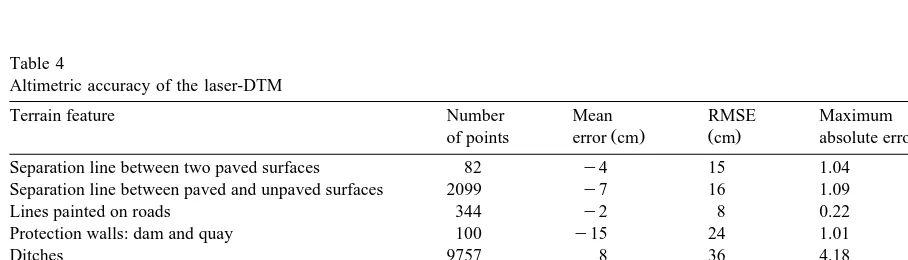
Table 4
Altimetric accuracy of the laser-DTM
Terrain feature Number Mean RMSE Maximum
Ž . Ž . Ž .
of points error cm cm absolute error m
Separation line between two paved surfaces 82 y4 15 1.04
Separation line between paved and unpaved surfaces 2099 y7 16 1.09
Lines painted on roads 344 y2 8 0.22
Protection walls: dam and quay 100 y15 24 1.01
Ditches 9757 8 36 4.18
Upper side of a sloped surface 1049 y25 38 1.97
Lower side of a sloped surface 729 15 28 1.00
String of points on flat surfaces 5336 y5 15 2.17
Individual points 127 6 18 0.66
cm. As stated above, this estimate is a coarse esti-mate as it is influenced by extrinsic factors such as
Ž .
the grid spacing pixel size of the images and the operator’s interpretation. Nonetheless, it agrees with
Ž .
the specified planimetric accuracy Section 3 .
5.4. Altimetric accuracy of the laser-DTM
Accuracy of the laser-DTM quantifies the fidelity of the laser data with respect to the terrain relief. It is influenced by the terrain characteristics, measuring accuracy, sampling spacing, and modelling function. Because it is difficult to identify the same points in the laser grid and the reference data, only the alti-metric accuracy is computed. This will as well re-flect the quality in planimetry of the laser-DTM.
To get a good estimate of the altimetric accuracy of the laser-DTM for the purpose of road planning and design, the Z values along the terrain features that are part of the DTM in Table 1 are interpolated in the laser-DTM and compared with the correspond-ing values measured photogrammetrically.
Ž .
The results obtained Table 4 can be summarised as follows: for flat or near flat regions the altimetric accuracy of the laser-DTM varies from 8 cm to 15 cm. For sloped terrain, the RMSE varies from 25 cm to 38 cm. The RMSE of all the different features together is equal to 29 cm. This figure is slightly worse than that required for road planning and
de-Ž .
sign 25 cm . For sloped terrain, the height values are less accurate. If necessary, they may be improved by a more adequate modelling function than bilinear interpolation. As stated in Section 2, the accuracy of the photogrammetrically generated DSM has never been assessed. This means that the user may not know the minimum accuracy required or that his requirements in terms of accuracy are flexible. The need for improvement as well as better modelling should be a subject of further research.
6. Conclusions
Based on the results of this study, a DSM derived from laser measurements with an average density of 4 points per m2 has sufficient quality to represent the
terrain relief for the purpose of road planning and design. For the specific tested situation, conditioned
by the type of laser system used and the specific
Ž .
terrain, the height accuracy is 29 cm RMSE , which approaches the 25 cm required.
When compared to the current DSM product used for road planning and design, almost all features can be extracted geometrically from the laser measure-ments alone. With respect to the extraction of their
Ž
semantic information, 40% i.e., 4 out of the 11 .
classes in Table 1 cannot be interpreted without additional geographical information.
Although the time to generate a laser-DSM is substantially shorter than that presently required to produce a DSM photogrammetrically, further re-search is also needed on combining laser measure-ments with other existing geographic information.
Acknowledgements
The authors are very grateful to their colleague Rene van Heerd at the Survey Department for
´
preparing some of the figures and for carrying out some of the computations in Section 5.
References
Fritsch, D., Kilian, J., 1994. Filtering and calibration of laser scanner measurements. Int. Arch. of Photogrammetry and
Ž .
Remote Sensing 30 3r1 , 227–234.
Haala, N., 1994. Building detection by fusion of range and image data. Zeitschrift fur Photogrammetrie und Fernerkundung 5,¨
161–167.
Haala, N., 1995. 3D building reconstruction using linear edge segments. 45th Photogrammetric Week. In: Fritsch, D.,
Hob-Ž .
bie, D. Eds. , Wichmann Verlag, Karlsruhe, pp. 19–28. Haala, N., Brenner, C., 1997. Generation of 3-D City models from
airborne laser scanning data. 3rd EARSel Workshop on Lidar Remote Sensing of Land and Sea, Tallinn, Estonia, 17–19 July 1997, pp. 105–111.
Heerd, R., Janssen, L.L.F., Pereira, L.M., 1997. From Laser Data to DTM. Survey Department Rijkswaterstaat, Delft, The Netherlands, 45 pp., in Dutch.
Hug, C., Wehr, A., 1997. Detecting and identifying topographic objects in imaging laser altimeter data. Int. Arch. of
Pho-Ž .
togrammetry and Remote Sensing 32 3–4W2 , 19–26. Huising, E.J., Vaessen, E.M.J., 1997. Evaluating laser scanning
( )
L.M. Gomes Pereira, L.L.F. JanssenrISPRS Journal of Photogrammetry & Remote Sensing 54 1999 244–253 253 Huising, E.J., Jordans, R.W.L., Spruijt, F.M., Vaessen, E.M.J.,
Wicherson, R.J., Zomerdijk, J.F., van Persie, M., 1996. Framework Digital Elevation Models Dutch Coast. Various Techniques for Topographic Measurement Tested on a Com-mon Site. NRSP report 96-15, Netherlands Remote Sensing Board, Delft, The Netherlands, 63 pp.
Ž .
Janssen, L.L.F. Ed. , 1997. Special Issue: Laser Scanning. EARSeL Newsletter, December 1997, pp. 5–22.
Lemmens, M.J.P.M., Fortuin, E.H.W., 1997. Error analysis of airborne laser altimetry. Survey Department Rijkswaterstaat, Delft, The Netherlands, 70 pp., in Dutch.
Lemmens, M.J.M., Deijkers, H., Looman, P.A.M., 1997. Building detection by fusing airborne DEMs and 2D digital maps. Int.
Ž .
Arch. of Photogrammetry and Remote Sensing 32 3–4W2 , 42–49.
Ministry of Transport, Public Works and Water Management, 1997. Hoogtepunten. Nieuwsbrief over het Actueel Hoogtebe-stand Nederland. Meetkundige Dienst, Delft, The Netherlands, 4 pp.
Pfeifer, N., Kostli, A., Kraus, K., 1998. Interpolation and filtering¨
of laser scanner data — implementation and first results. Int.
Ž .
Arch. of Photogrammetry and Remote Sensing 33 3 , 153– 159.
Vaessen, E.M.J., Platschorre, Y., Huising, E.J., Gomes Pereira, L.M., 1998. Extraction of Beach Profiles from Laser Altimetry Data; Results of the 1997 Projects. Survey Department Rijk-swaterstaat, Delft, The Netherlands, 33 pp., in Dutch. Weidner, U., 1996. An approach to building extraction from
digital surface models. Int. Arch. of Photogrammetry and
Ž .