July 2010
Consumer Confidence Index remained on the optimistic
level, albeit down slightly by 5.7 points to 105.7 in July 2010.
The deterioration in confidence was broad base, all
components measuring current economic condition and
expectation for the next 6 months registering a decline. The
index dropped by 5.4 and 6.0 points respectively.
Consumers believe that inflationary pressure will continue
to increase over the next 3 and 6 months, as the indexes
were raised by 13.7 and 6.9 points each againts previous
month. The highest pressure was attributable to the increase
in the price of housing, electricity, gas and fuels group and
foodstuff group.
Consumer Confidence Index
Consumer confidence index (CCI) in July 2010 remained stand at
optimistic level, although it slightly slipped down over previous
month
. The survey encountered that CCI stood at optimistic area of 105.7
down 5.7 points against previous month survey. The lower CCI was due to
respondent’s dwindle perception on current economic condition and the
expectation for the next 6 months. The perception index plummeted by 5.4
and 6.0 points each.
Graph 1. Consumer Confidence Index
60.0
70.0
80.0
90.0
100.0
110.0
120.0
130.0
140.0
1 2 3 4 5 6 7 8 9 10 11 12 1 2 3 4 5 6 7 8 9 10 11 12 1 2 3 4 5 6 7
2008 2009 2010
(Index)
Current Economic Condition Index
Consumer Expectation Index
Consumer Confidence Index
Optimistic
Pessimistic
Fuels Hike
Global Economic
Crisis
CONSUMER SURVEY
Consumer Confidence Index
moved down
Methodology
The downwarding CCI was indicated to be correlated with enhancing
basic electricity rate by 18% on July 1
st2010 and rising some basic need
commodities that feared could increasing the living expenses so that
weakened consumer confidence on economic condition.
Compared to the same period on last year, consumer’s
confidence index on economic condition also grew weaker.
CCI on the
reporting period declined 9.7 points over previous year. Deteriorating
consumer expectation index by 17.0 points and current economic condition
index by 2.5 points were attributable to the downwarding CCI.
Current Economic Condition Index
Respondent’s perception on current economic condition went
down from optimistic area to pessimistic level against previous month.
Respondent’s pessimism on current economic condition was seen on Current
Economic Condition Index (CECI) which slipped off 5.4 points over previous
month and plummeted 2.5 points against previous year touching pessimistic
level of 96.1.
The survey revealed that all current economic condition indicators
moved down. The highest declined was at household income in July 2010
that could push consumers to hold their desire to consume durable goods.
Moreover, consumers also considered that there were lack on job availability
at current time over previous month.
Higher consumer’s expenditure on education related to new school
year and rising price on some basic need commodities in July 2010 was
attributable to declining consumer’s income that finally could hold consumers
desire to consume durable goods.
Compared to the same period in last year, consumer’s current income
and job availability were become lower.
Graph 2. Current Economic Condition Index (CECI)
0.0 20.0 40.0 60.0 80.0 100.0 120.0 140.0
1 2 3 4 5 6 7 8 9 10 11 12 1 2 3 4 5 6 7 8 9 10 11 12 1 2 3 4 5 6 7
2008 2009 2010
Index
Current economic condition
Consumer Expectation Index
This month survey confirmed that consumer’s expectation in
the next 6 months remained at optimistic area, although it was lower
than previous month and over the same period in last year.
Consumption for the next 6 months was predicted to accelerate since CEI
remained at the optimistic area of 115.3 down 6.0 points from the previous
month.
The declining index was attributable by reducing optimism on
economic condition (9.7 points), future income (4.8 points), and job prospects
(3.5 points) in the next 6 months. Together with the basic electricity rate hike
applied since July 1
st2010 by 18%, respondents considered that pressure on
economic condition is strengthening as the economic condition expectation
moved down. Eventually, it will lighten respondents’ optimism over income in
the next 6 months.
CEI in this period survey was 17.0 points lower than previous
year.
Consumer’s had negative view on the economic prospect edged down
by 26.3 points, followed by income expectation by 10.3 points and job
availability by 14.4 points.
Graph. 3
Consumer Expectation Index (CEI)
0.0
20.0
40.0
60.0
80.0
100.0
120.0
140.0
160.0
1
2
3
4
5
6
7
8
9 10 11 12 1
2
3
4
5
6
7
8
9 10 11 12 1
2
3
4
5
6
7
2008
2009
2010
Index
Consumer Expectation Index Incomes Expectation Economic Expectation Job Availability Expectation
Income Expectations
Respondent were less optimistic on their income in the next 6
months.
The deteriorating optimism was indicated by income expectation
index which down 4.8 points over previous month. Classified by respondents’
category, a downward on income expectation encountered in all categories
Respondent’s optimism on
economic expectation
jumped down
especially those who graduated from high school as the index dropped by 8.9
points.
Price Expectations
Respondents envisaged that pressure on prices over
goods/services in the next 3 months will be higher than in the next 6
months.
The survey revealed that there was soaring pressure on prices in the
next 3 and 6 months as the index moved up by 13.7 and 6.9 points.
Respondents acknowledged the highest leap at housing, electricity, gas and
fuels for the next 3 and 6 months expectation which rose by 13.8 and 8.5
points. Food stuff commodity was believed to be the main factor which could
push prices upward in the next 3 and 6 months ahead by 13.3 points and 6.8
points respectively. Rising basic electricity rate that applied on July 1
st2010 has
apparently given substantial effect on respondent’s expectations on those
commodity groups.
Graph 4.
Price Expectation Index for the next 3 and 6 months
‐
1.00
0.00
1.00
2.00
3.00
4.00
5.00
6.00
130.0
140.0
150.0
160.0
170.0
180.0
190.0
200.0
1 2 3 4 5 6 7 8 9 101112 1 2 3 4 5 6 7 8 9 101112 1 2 3 4 5 6 7 8 9 101112 1
2008
2009
2010
2011
Price
Expectation
Index
3
months
ahead
Price
Expectation
Index
6
months
ahead
Cummulative
inflations
in
3
months
(Index)
(
%
)
Notes
: Index = 100 indicates that consumer expect prices will still be stable, index > 100 indicates
consumer expect prices will increase, and index < 100 indicates consumer expect prices will decrease
Expectations of Savings and Interest Rates
Based on survey, expectation on prices pressure has apparently
not given any significant influenced yet to the interest rate
expectation.
Interest rate expectation index in the next 6 months was
predicted to be relatively unchanged, only moved up by 0.2 point over previous
month. Nevertheless, worsening respondent’s expectation on economic
condition in the next 6 months has impacted consumer’s expectation on saving
in the next 6 months as the index dropped 2.9 points over previous month.
Pressure on prices in the
future is strengthening
Graph. 5
Expectation Indexes on Interest Rates and Total Savings in the next 6 months
0
5
10
15
20
25
90
100
110
120
130
140
1 2 3 4 5 6 7 8 9 10 11 12 1 2 3 4 5 6 7 8 9 10 11 12 1 2 3 4 5 6 7 8 9 10 11 12 1
2008
2009
2010
2011
Savings
Growth
in
6
months
Interest
Rates
Expectation
Index
in
6
months
ahead
Savings
Expectation
Index
in
6
months
ahead
Index
(%)
Notes
: Index = 100 indicates that consumer expect saving deposit and interest rate will still be
stable, index > 100 indicates consumer expect saving deposit and interest rate will increase, and
index < 100 indicates consumer expect saving deposit and interest rate will decrease
Expectations on Economic Conditions
Respondent’s expectations on economic condition on the next 6
months continue to down. However, it was still on optimistic level
.
Weakening expectations was evidenced by declining index by 9.7 points over
previous month. Significant loose of economic expectations by those who
expenses more than Rp 5 million could be the main reason of worsening
economic condition in the next 6 months to the level of 112.6.
Respondents were
Table 1. Consumer Confidence, Price Expectations, Consumption Plans, and Economic Indicators (Index)
Jul Aug Sep Oct Nov Dec Jan Feb Mar Apr May Jun Jul
A Consumer Confidence Index (CCI) 115.44 114.33 110.84 110.01 111.00 108.66 110.5 105.3 107.4 110.7 109.9 111.4 105.7 Present Situation (CECI) 98.55 100.49 96.59 96.78 97.71 96.67 98.4 94.7 96.4 99.6 100.0 101.4 96.1 Expectations (CEI) 132.34 128.17 125.09 123.24 124.28 120.65 122.6 115.9 118.5 121.7 119.8 121.3 115.3 Appraisal of Present Situation
Current Incomes 129.46 127.52 123.97 124.93 124.11 123.13 125.5 118.6 121.7 126.1 124.4 126.2 120.6 Buying durable goods Conditions 83.66 87.64 81.28 82.21 84.90 81.12 85.2 87.3 85.3 87.5 89.6 91.4 86.8 Employment Conditions 82.53 86.31 84.53 83.20 84.13 85.76 84.5 78.0 82.1 85.3 85.9 86.7 80.9 (before Oct 2004: Unemployment Condition)
Expectations for 6 Months Hence of
Incomes 142.93 138.34 138.48 137.32 139.28 136.75 141.1 132.5 135.3 136.7 134.7 137.4 132.6 Economic Conditions 138.94 135.44 130.35 127.28 128.77 122.11 122.7 114.4 117.7 122.2 119.5 122.3 112.6 Employment Conditions 115.14 110.71 106.42 105.11 104.81 103.10 103.9 100.8 102.4 106.3 105.2 104.2 100.7 (before Oct 2004: Unemployment Expectation)
B Price Expectations for 3 Months Hence of
Prices 154.76 163.75 165.21 158.76 159.89 161.00 160.60 160.20 155.10 158.60 164.30 166.8 180.5 Foodstuff 158.24 168.18 167.00 160.80 160.64 162.97 163.50 163.40 156.00 159.60 164.20 167.8 181.2 Food, beverages, cigarettes and tobacco 151.28 160.99 161.00 154.94 155.77 157.15 156.40 155.00 149.90 153.50 156.50 160.1 170.4 Housing, electricity, gas and fuel 141.57 148.85 155.20 155.96 156.58 156.32 152.00 151.50 148.10 155.30 158.10 161.2 175.1 Clothing 142.47 152.65 150.16 138.56 139.34 137.95 135.50 136.40 131.20 133.70 142.10 148.8 155.9 Health 132.07 139.61 140.64 135.38 136.63 137.91 135.90 136.10 133.90 133.60 138.80 141.0 146.6 Transportations, communications and financial ser 136.71 145.62 146.85 142.60 142.25 141.35 137.50 137.90 134.30 136.40 142.00 149.6 157.4 Education, recreation, and sports 135.34 141.12 141.34 137.28 138.96 140.05 138.00 137.20 138.20 141.40 145.90 149.4 154.9 C Price Expectations for 6 Months Hence of
Prices 152.23 156.46 156.95 156.24 157.92 158.80 161.20 164.30 161.10 159.30 162.50 163.1 170.1 Foodstuff 154.18 160.01 158.23 158.42 158.39 160.51 162.10 166.00 161.70 160.50 163.00 164.1 171.0 Food, beverages, cigarettes and tobacco 149.88 155.05 153.36 154.25 154.44 154.89 156.90 158.90 156.70 154.50 158.00 157.9 163.5 Housing, electricity, gas and fuel 141.95 148.55 150.84 154.32 155.72 155.40 153.20 153.10 148.60 154.10 157.30 157.3 165.8 Clothing 138.97 144.01 141.71 137.41 140.52 139.90 140.10 144.40 143.10 140.30 145.20 147.1 148.4 Health 132.55 139.03 140.19 136.73 138.06 138.87 140.00 140.80 136.70 137.20 139.10 141.2 146.5 Transportations, communications and financial ser 136.95 143.20 143.37 143.86 142.59 143.90 142.80 145.50 143.60 144.90 147.30 148.3 153.0 Education, recreation, and sports 134.87 139.80 140.98 138.61 143.10 144.73 146.20 147.70 145.30 144.20 146.10 146.1 150.8 D Economic Indicator within 6 Months
Avaibility of Goods & Services 137.18 139.97 138.59 136.40 132.70 133.48 138.30 134.20 135.50 137.60 138.70 141.5 140.0 Interest Rate 115.76 117.71 115.20 113.34 115.44 116.31 117.90 114.90 117.00 116.20 117.10 117.8 117.9 Current savings 107.50 107.85 104.44 104.70 106.58 105.94 106.40 105.20 106.90 105.00 105.80 106.5 103.7 Savings for 6 months hence 129.87 127.63 124.99 125.93 128.21 126.75 129.80 125.60 126.20 127.00 125.00 127.3 124.3
2010
Descriptions 2009
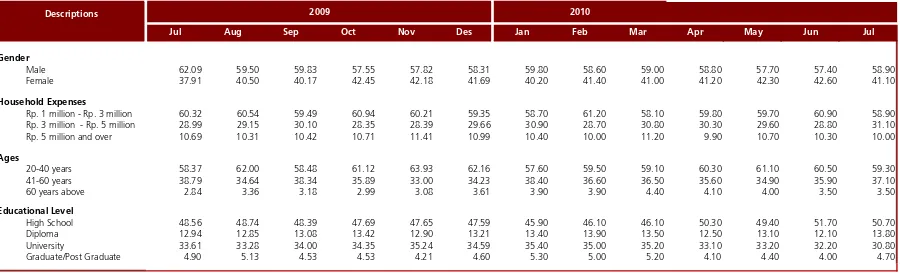
Table 2. Respondent Figures (percentages)
Jul Aug Sep Oct Nov Des Jan Feb Mar Apr May Jun Jul
Gender
Male 62.09 59.50 59.83 57.55 57.82 58.31 59.80 58.60 59.00 58.80 57.70 57.40 58.90
Female 37.91 40.50 40.17 42.45 42.18 41.69 40.20 41.40 41.00 41.20 42.30 42.60 41.10
Household Expenses
Rp. 1 million - Rp. 3 million 60.32 60.54 59.49 60.94 60.21 59.35 58.70 61.20 58.10 59.80 59.70 60.90 58.90 Rp. 3 million - Rp. 5 million 28.99 29.15 30.10 28.35 28.39 29.66 30.90 28.70 30.80 30.30 29.60 28.80 31.10 Rp. 5 million and over 10.69 10.31 10.42 10.71 11.41 10.99 10.40 10.00 11.20 9.90 10.70 10.30 10.00 Ages
20-40 years 58.37 62.00 58.48 61.12 63.93 62.16 57.60 59.50 59.10 60.30 61.10 60.50 59.30 41-60 years 38.79 34.64 38.34 35.89 33.00 34.23 38.40 36.60 36.50 35.60 34.90 35.90 37.10
60 years above 2.84 3.36 3.18 2.99 3.08 3.61 3.90 3.90 4.40 4.10 4.00 3.50 3.50
Educational Level
High School 48.56 48.74 48.39 47.69 47.65 47.59 45.90 46.10 46.10 50.30 49.40 51.70 50.70 Diploma 12.94 12.85 13.08 13.42 12.90 13.21 13.40 13.90 13.50 12.50 13.10 12.10 13.80 University 33.61 33.28 34.00 34.35 35.24 34.59 35.40 35.00 35.20 33.10 33.20 32.20 30.80 Graduate/Post Graduate 4.90 5.13 4.53 4.53 4.21 4.60 5.30 5.00 5.20 4.10 4.40 4.00 4.70
2010
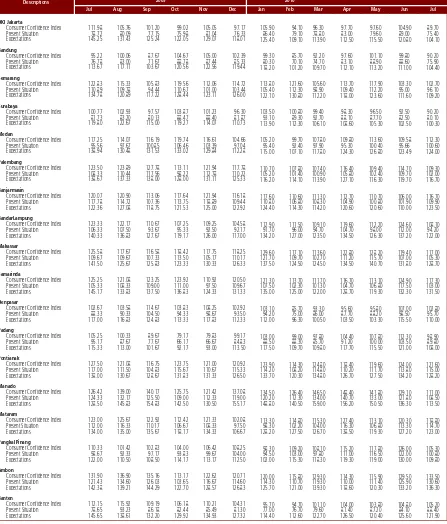
Table 3. Consumer Confidence by Region (Index)
Jul Aug Sep Oct Nov Dec Jan Feb Mar Apr May Jun Jul
DKI Jakarta
Consumer Confidence Index 111.98 105.76 101.20 99.02 105.05 97.17 105.90 94.10 96.30 97.70 97.60 104.90 89.70 Present Situation 78.72 80.09 77.15 75.98 81.04 76.33 86.40 79.10 78.80 83.00 79.60 89.00 75.40 Expectations 145.25 131.43 125.24 122.05 129.07 118.01 125.40 109.10 113.90 112.50 115.50 120.80 104.10 Bandung
Consumer Confidence Index 95.22 100.06 87.67 104.67 105.00 102.39 99.30 85.70 92.20 97.60 101.10 99.80 90.20 Present Situation 76.78 83.00 71.67 88.78 87.44 85.33 80.30 70.10 74.70 83.10 88.90 88.60 75.90 Expectations 113.67 117.11 103.67 120.56 122.56 119.44 118.20 101.20 109.70 112.10 113.20 111.00 104.40 Semarang
Consumer Confidence Index 122.83 115.33 105.83 119.56 112.06 114.72 113.80 121.60 105.60 113.70 117.90 103.30 102.70 Present Situation 110.89 109.78 94.44 110.67 101.00 103.44 105.40 112.30 98.90 109.40 112.20 95.00 96.10 Expectations 134.78 120.89 117.22 128.44 123.11 126.00 122.10 130.80 112.20 118.00 123.60 111.60 109.20 Surabaya
Consumer Confidence Index 100.77 102.93 97.57 103.87 101.23 96.30 103.50 100.80 99.40 98.30 96.50 92.50 90.20 Present Situation 81.73 83.20 80.13 88.47 88.40 81.87 93.10 89.30 92.70 88.10 87.70 82.50 80.10 Expectations 119.80 122.67 115.00 119.27 114.07 110.73 113.90 112.30 106.10 108.60 105.30 102.50 100.30 Medan
Consumer Confidence Index 117.25 114.07 116.19 119.74 116.61 104.66 105.20 99.70 107.80 109.80 113.60 109.58 112.30 Present Situation 95.56 97.67 100.85 106.46 103.39 97.04 95.40 92.40 97.90 95.30 100.40 95.66 100.60 Expectations 138.94 130.48 131.53 133.02 129.84 112.28 115.00 107.10 117.80 124.30 126.80 123.49 124.00 Palembang
Consumer Confidence Index 123.50 123.89 127.78 113.11 121.94 117.78 110.70 107.80 107.40 116.40 109.40 114.70 109.30 Present Situation 108.33 110.44 117.56 98.22 112.78 110.22 105.20 101.40 100.90 105.80 102.40 109.70 102.00 Expectations 138.67 137.33 138.00 128.00 131.11 125.33 116.20 114.10 113.90 127.10 116.30 119.70 116.70 Banjarmasin
Consumer Confidence Index 120.07 120.90 113.06 117.64 121.94 116.18 117.60 110.60 111.30 112.70 110.70 106.00 116.70 Present Situation 117.78 114.72 107.36 113.75 118.89 109.44 110.80 106.80 108.30 104.90 100.80 101.90 109.90 Expectations 122.36 127.08 118.75 121.53 125.00 122.92 124.40 114.30 114.20 120.60 120.60 110.00 123.50 BandarLampung
Consumer Confidence Index 123.33 122.17 110.67 107.25 109.25 104.58 112.90 111.50 109.10 119.60 112.20 124.60 108.10 Present Situation 106.33 107.50 93.67 95.33 92.50 92.17 91.70 96.00 94.70 104.70 98.00 112.00 94.20 Expectations 140.33 136.83 127.67 119.17 126.00 117.00 134.20 127.00 123.50 134.50 126.30 137.20 122.00 Makassar
Consumer Confidence Index 125.58 117.67 116.58 118.42 117.75 118.25 129.60 117.10 113.60 122.80 128.20 119.40 117.00 Present Situation 109.67 109.67 107.33 113.50 105.17 110.17 121.70 109.70 102.70 111.20 115.70 107.00 105.30 Expectations 141.50 125.67 125.83 123.33 130.33 126.33 137.50 124.50 124.50 134.50 140.70 131.80 128.70 Samarinda
Consumer Confidence Index 125.25 121.08 123.25 123.92 110.92 120.50 121.30 113.70 111.70 116.70 113.10 124.90 117.30 Present Situation 105.33 108.33 109.00 111.00 97.50 109.67 107.50 102.30 101.30 104.70 106.80 117.50 103.00 Expectations 145.17 133.83 137.50 136.83 124.33 131.33 135.00 125.00 122.00 128.70 119.30 132.30 131.50 Denpasar
Consumer Confidence Index 102.67 103.58 114.67 103.83 108.25 102.92 103.10 85.70 93.30 95.60 95.80 107.00 102.80 Present Situation 88.33 90.33 104.50 94.33 98.67 93.50 94.20 75.00 86.00 87.70 88.20 98.50 95.70 Expectations 117.00 116.83 124.83 113.33 117.83 112.33 112.00 96.30 100.50 103.50 103.30 115.50 110.00 Padang
Consumer Confidence Index 105.25 100.33 89.67 79.17 79.83 99.17 103.00 99.00 97.80 104.40 107.80 112.30 98.90 Present Situation 95.17 87.67 77.67 66.17 66.67 84.83 88.50 88.30 85.70 91.20 100.00 103.50 89.80 Expectations 115.33 113.00 101.67 92.17 93.00 113.50 117.50 109.70 109.80 117.70 115.50 121.00 108.00 Pontianak
Consumer Confidence Index 127.50 121.08 116.75 123.75 121.00 120.92 123.90 114.30 124.80 118.40 119.60 124.00 121.60 Present Situation 117.00 111.50 104.83 115.67 110.67 115.33 114.20 108.20 114.80 110.20 111.70 113.80 115.00 Expectations 138.00 130.67 128.67 131.83 131.33 126.50 133.70 120.30 134.80 126.70 127.50 134.20 128.20 Manado
Consumer Confidence Index 126.42 139.00 140.17 125.75 121.42 137.08 134.50 126.40 146.50 148.40 141.80 129.10 111.00 Present Situation 124.33 132.17 125.50 109.00 112.33 119.00 120.20 112.30 134.00 140.70 133.00 121.80 108.50 Expectations 128.50 145.83 154.83 142.50 130.50 155.17 148.80 140.50 159.00 156.20 150.50 136.30 113.50 Mataram
Consumer Confidence Index 123.00 125.67 122.92 112.42 121.33 102.08 113.30 114.80 115.30 127.40 113.10 120.30 118.80 Present Situation 112.00 116.33 110.17 106.67 108.33 97.50 98.30 102.20 104.00 116.30 106.80 113.30 114.70 Expectations 134.00 135.00 135.67 118.17 134.33 106.67 128.20 127.50 126.70 138.50 119.30 127.20 123.00 Pangkal Pinang
Consumer Confidence Index 110.33 101.42 102.83 104.00 106.42 108.25 98.30 109.20 108.10 115.20 117.80 126.00 105.30 Present Situation 98.67 92.33 97.17 93.83 99.67 104.00 94.50 103.00 97.80 111.00 116.50 122.00 100.80 Expectations 122.00 110.50 108.50 114.17 113.17 112.50 102.00 115.30 118.30 119.30 119.00 130.00 109.80 Ambon
Consumer Confidence Index 131.90 136.90 135.16 113.17 122.62 120.71 120.00 115.80 129.30 114.30 115.90 129.50 133.50 Present Situation 121.43 134.60 126.03 103.65 116.67 114.60 114.30 110.70 119.30 110.00 111.40 125.90 130.60 Expectations 142.38 139.21 144.29 122.70 128.57 126.83 125.70 121.00 139.30 118.60 120.30 133.20 136.30 Banten
Consumer Confidence Index 112.15 115.92 109.19 106.18 110.21 104.31 95.70 94.70 101.10 104.00 103.80 104.80 105.20 Present Situation 78.65 93.23 86.18 82.44 85.49 81.30 77.00 76.70 79.60 81.40 87.20 84.10 88.40 Expectations 145.65 138.61 132.20 129.92 134.93 127.32 114.40 112.60 122.70 126.50 120.40 125.60 121.90
2010