Electronic copy available at: https://ssrn.com/abstract=2985765
Locked-in:
The Effect of CEOs’ Capital Gains Tax
es on
Corporate Risk-Taking
Benjamin P. Yost MIT Sloan School of Management
Current draft: April 2017
Abstract
I study the effects of CEOs’ unrealized capital gains tax liabilities (tax burdens) on corporate risk-taking. Recent work suggests that high tax burdens discourage CEOs from selling stock. I hypothesize that this causes the executives to become overexposed to firm-specific risk thereby reducing their willingness to make risky corporate decisions. In a series of tests, I find that corporate risk-taking decreases as CEOs’ personal tax burdens increase. Further, firms with CEOs who are more locked-in to their stock positions (i.e., CEOs with higher tax burdens) experience larger increases in risk-taking following federal and state tax cuts. When I investigate the mechanism behind this relation, I find that tax cuts trigger stock sales by the locked-in executives, allowing for improved diversification. Overall, my findings indicate that the personal tax burdens of CEOs affect the firm by reducing executives’ preferences for risk at the corporate level.
Keywords: Capital Gains Taxes, Compensation, Corporate Risk-Taking, Natural Experiments JEL classification: G32, H24, J33, M52
_______________
Electronic copy available at: https://ssrn.com/abstract=2985765 1
I.INTRODUCTION
Taxes on capital gains discourage the sale of appreciated assets, leading to distortions in
asset prices and in investors’ portfolio allocation decisions (e.g., Feldstein, Slemrod, and Yitzhaki 1980; Dammon, Spatt, and Zhang 2004). This distortionary behavior is commonly referred to as
the “lock-in” effect. Existing research in this area tends to focus on the investment decisions of
external investors who lack direct control over the firms’ core operations. This focus in prior research overlooks the impact of taxes on another important class of investors – those internal to the firm. Specifically, I predict that investor-level tax effects on managers have potentially
important consequences for corporate policies because, unlike most external investors, managers
have direct influence on firms’ strategic and operational activities.
In this paper, I study the tax lock-in effect on CEOs and the implications of this effect for
corporate risk-taking. CEOs generally own stock in the firms that employ them, and recent work
suggests that anticipated tax liabilities discourage CEOs from selling shares (Jin and Kothari 2008;
Armstrong, Core, and Guay 2015). I hypothesize that over time, this tax friction may cause
executives to become overexposed to firm-specific risk, and to respond by reducing the firm’s risk in order to limit their personal risk. Specifically I predict that the unrealized tax liabilities on
CEOs’ stock holdings in their firms (hereafter, CEOs’ tax burdens) are negatively associated with
corporate risk-taking.
My primary independent variable is the CEO’s tax burden on her stock holdings in the firm. I construct this measure using an approach similar to that in Jin and Kothari (2008), with a
few modifications.1 Intuitively, the tax burden reflects the percentage of the CEO’s total equity portfolio that would be owed in tax if the CEO sold all vested stock. As such, the magnitude of the
2
tax burden depends on several factors: the tax rate facing the CEO, the unrealized gain on the
CEO’s stock holdings (i.e., the difference between the current price of the shares and the price at
which the shares were obtained), the number of shares owned by the CEO at each price, and the
total value of the CEO’s equity. For my dependent variable, I use three common proxies for
corporate risk-taking: stock return volatility, idiosyncratic volatility, and earnings volatility (e.g.,
Armstrong and Vashishtha 2012; Ljungqvist, Zhang, and Zuo 2017). My inferences are similar
when examining corporate policies that have traditionally been used to proxy for corporate
risk-taking, including R&D expenditures, leverage, and working capital levels (e.g., Coles, Daniel, and
Naveen 2006; Cassell, Huang, Sanchez, and Stuart 2012).
In panel analysis, I find a robust negative relation between CEOs’ tax burdens and
corporate risk-taking. Specifically, a CEO moving from the 25th to the 75th percentile with respect
to the tax burden is associated with a 2.0% relative decrease in annualized stock return volatility,
and a 2.4% relative decrease in idiosyncratic volatility. These results are robust to including firm
and year fixed effects, as well as control variables for CEO incentives, CEO cash compensation,
CEO tenure, CEO overconfidence, and a number of firm characteristics plausibly correlated with
corporate risk-taking (firm age, size, market-to-book ratio, leverage, cash surplus, presence of tax
loss carryforwards, growth, recent performance, and shareholder tax sensitivity).
A potential concern with the panel analysis is that an omitted correlated variable could
affect CEOs’ tax burdens as well as corporate risk-taking (as proxied by firm volatility). The
concern arises from the observation that the CEO of a firm that has performed well is more likely
to have a higher tax burden than the CEO of a firm that has performed poorly. Prior work suggests
that positive performance can lead mechanically to lower future volatility via the “leverage effect”,
in which firms become less leveraged as the market value of their debt falls relative to their equity
3
increasingly risk-averse behavior by CEOs. A related concern is that the level of the tax burden is
endogenous to CEOs’ portfolio choices. CEOs who hold more stock may do so because they
anticipate low volatility in the firm, whereas CEOs who frequently sell their holdings in the firm
expect greater volatility. I exploit two additional settings to mitigate these endogeneity concerns.
First, I examine two federal tax cuts that take place during my sample period.2 Reductions
in statutory capital gains tax rates induce variation in CEOs’ tax burdens that is unrelated to the
stock’s historical appreciation and executives’ portfolio choices, thus providing plausibly causal
evidence of the effect of CEOs’ tax burdens on corporate risk-taking. Although the federal tax cuts
affected all CEOs simultaneously, I argue that the impact on risk-taking is likely to be larger for
CEOs with higher tax burdens prior to the cuts (i.e., for CEOs who were more locked-in).
Consistent with this prediction, I find that firms with high-tax-burden CEOs prior to the 1997 tax
cut experienced significantly larger increases in total return volatility following the cut compared
to firms with relatively low-tax-burden CEOs (4.6% increase compared to a 2.4% increase).
Second, I examine the effects of reductions in individual capital gains tax rates at the state
level. For the state tests, I use a two-way fixed effects model with firm and year fixed effects, and
I further compare the impact of the tax cuts for high- and low-tax-burden CEOs in the same state.
This specification provides a within-state analysis for the same tax cut, allowing me to compare
the change in risk-taking for firms with high-tax-burden CEOs relative to the change for firms with
low-tax-burden CEOs. In addition, the specification allows me to compare both groups of affected
CEOs to firms with unaffected CEOs (those located in states without a tax cut).3 I find that a one
percent drop in the tax rate leads to a 1.3% average increase in total return volatility over the
following three years. However, I find that the increase is driven disproportionately by CEOs with
2 The first federal tax cut was contained in the Taxpayer Relief Act of 1997, which reduced the top individual long-term capital gains tax rate from 28% to 20%. The second federal tax cut was part of the Jobs and Growth Tax Relief Reconciliation Act of 2003, which further reduced the top capital gains tax rate from 20% to 15%.
4
high tax burdens prior to the tax cuts. Affected CEOs with tax burdens at the 25th percentile
experience a modest 0.5% increase in stock return volatility relative to unaffected firms, whereas
affected CEOs with tax burdens at the 75th percentile experience a 2.1% increase in stock return
volatility.
A potential concern is that the response to the tax cuts could in fact be driven by outside
shareholders of the firm, who face different tax incentives as a result of the tax changes. This is
plausible in the federal setting, and even in the state setting, given the existence of investor home
bias (Coval and Moskowitz 1999, 2001). Motivated by findings that within-state home bias is
weakest for large, highly visible firms such as those in the S&P 500 index (Ivkovic and Weisbenner
2005), I perform a robustness test in which I restrict the sample to S&P 500 firms only. The
magnitude of the tax cut response is actually somewhat larger for S&P 500 firms than for
non-S&P 500 firms, bolstering the case for a manager-driven effect.
Having established a robust link between CEOs’ tax burdens and their risk taking behavior, I investigate the mechanism behind this link by analyzing CEO stock selling activity following tax
cuts. Drops in the tax rate lower the tax cost to executives of selling appreciated shares, thus
alleviating the lock-in effect due to CEOs’ tax burdens. I find that tax cuts trigger increased stock sales by CEOs, and the impact is significantly stronger for CEOs with high tax burdens. For CEOs
at the 75th percentile of tax lock-in, a one percent tax cut triggers increased stock sales representing
approximately 2.5% of the value of their equity in the year the tax cut takes effect. Further, I use
the predicted stock sales as the first stage in a two-stage-least-squares specification to directly
connect CEO stock sales to increased corporate risk-taking.
5
cuts have a lower marginal benefit for better-diversified CEOs. Next, I find that locked-in CEOs
respond to the tax cuts by increasing R&D expenditures and leverage, while reducing working
capital levels, consistent with an increased willingness to make risky corporate decisions. Finally,
I examine the impact of capital gains tax increases on corporate risk-taking. I find that tax increases
are followed by reductions in corporate risk-taking, but the effect does not vary significantly
among affected CEOs conditional on their tax burdens prior to the increase. A likely explanation
for this finding is that high-tax-burden CEOs appear to anticipate tax rises and sell off appreciated
stock just before the increase takes effect, thereby reducing their exposure to firm risk.
My study contributes to the literature on investor-level taxes by shifting the focus from
external investors to internal investors, and demonstrating an important implication for the firm.
Prior work in the area has focused primarily on capital market distortions and portfolio allocation
effects arising from taxes. Although recent work has documented a positive association between
capital gains tax liabilities and CEO equity holdings, I build on this research by exploiting federal
and state tax cuts to provide more direct evidence of the tax lock-in effect with respect to
executives. In addition, I extend the literature by considering the corporate consequences of
managers’ tax lock-in. By discouraging CEOs’ stock sales, taxes may disrupt incentive alignment
between the executive and outside investors, potentially leading to sub-optimal risk-taking from
the perspective of diversified shareholders.
I also contribute to the literature on CEO incentive compensation and corporate risk-taking.
Greater stock-based compensation increases the sensitivity of CEO wealth to stock price, which
can affect risk-taking incentives in two ways. First, higher stock ownership more closely aligns
CEO incentives with those of shareholders, providing motivation to increase stock price through
optimal risk-taking. Second, higher ownership exposes CEOs to more risk and potentially causes
CEOs to be under-diversified with respect to their personal wealth, thereby reducing the
6
identify the relation between stock holdings and risk-taking, because of the endogenous nature of
the relationship (e.g., Coles et al. 2006). Recently. Edmans and Gabaix (2015) have called for more
studies using good instruments for or quasi-exogenous shocks to CEO incentives to better
understand their impact on the firm. My study responds to this call using a series of tax cuts as
shocks to CEO diversification and examining the ensuing effects on corporate risk-taking.
The rest of the paper proceeds as follows. Section 2 discusses prior research and develops
my central hypothesis. Section 3 discusses the data and provides descriptive statistics. Section 4
outlines my empirical strategy and presents results for the main panel analysis, whereas Section 5
examines the tests using federal and state tax cuts as shocks to CEOs’ tax burdens. Section 6 provides additional analyses, and Section 7 concludes.
II. PRIOR RESEARCH AND HYPOTHESIS DEVELOPMENT
Prior Research: Capital Gains Taxes and the Lock-in Effect
A large literature in economics, finance, and accounting has studied the impact of capital
gains taxes on investors’ trading behavior and asset prices (e.g., Stiglitz 1983; Constantinides
1983; Dammon, Spatt, and Zhang 2001). Researchers posit that capital gains taxes can affect asset
prices in two ways: by decreasing demand for an asset due to the anticipated future tax due upon
sale (the capitalization effect), and by decreasing supply of an asset by discouraging the sale of
appreciated shares that will trigger a taxable gain (the lock-in effect).
Focusing on the capitalization aspect, Lang and Shackelford (2000) and Dhaliwal, Krull,
and Li (2007) find that firms’ expected returns are increasing with capital gains taxes. Analyzing
the federal tax cuts contained in the 1997 and 2003 tax acts, respectively, they conclude that
investors facing higher taxes demand a higher return to compensate for the eventual tax liability.
In contrast, Sikes and Verrecchia (2012) show theoretically that under certain conditions, higher
capital gains taxes can actually reduce firms’ expected returns, by way of having the government
7
Wang (2016) provide empirical evidence consistent with capital gains taxes serving to lower firms’
expected returns when a firm’s systematic risk is high, the market risk premium is high, or the
risk-free rate is low.
Studies focused on the lock-in effect find that capital gains taxes act as a friction which
deters investors from selling shares, puts upward price pressure on assets, and prevents investors
from optimally rebalancing their portfolios (Feldstein et al. 1980; Landsman and Shackelford
1995; Dammon et al. 2004).4 Consequently, a meaningful decrease in capital gains tax rates can
serve as a pressure valve, reducing the lock-in effect and allowing investors to sell shares with
embedded gains at a lower tax cost. Examining the capital gains tax cut contained in the Taxpayer
Relief Act of 1997, Chyz and Li (2012) provide evidence that tax-sensitive institutional investors
reacted to the tax cut by selling shares with unrealized gains. In a clever study exploiting the 1997
tax act, Dai, Maydew, Shackelford, and Zhang (2008) reconcile the capitalization and lock-in
effects by showing that the equilibrium price impact of capital gains taxes is ambiguous and
depends on investors’ expectations. Although the theory and empirical evidence on how capital
gains taxes affect investors’ decisions is well developed, traditionally research has focused on the implications for asset prices (Hanlon and Heitzman 2010), or more generally on consequences
external to the firm.
Two recent studies examine the tax lock-in effect with respect to internal investors in the
firm. Jin and Kothari (2008) find that CEOs’ tax burdens are negatively associated with the sale of equity, suggesting that large tax burdens discourage CEOs from selling shares. Similarly,
8
Armstrong et al. (2015), studying the determinants of CEOs’ equity holdings, find a strong positive association between executives’ anticipated tax liability upon sale and the amount of unrestricted equity held. However, both studies rely solely on cross-sectional evidence that higher tax burdens
are associated with greater equity holdings. I aim to make a more causal statement by exploiting a
series of federal and state tax cuts that act as shocks to the cost of selling shares, and by providing
evidence that CEOs sell more shares following a reduction of the lock-in effect. Further, these
findings raise the possibility that capital gains taxes materially impact the firm by altering
managerial incentives and thereby affecting corporate decisions. In particular, I study the
implications of managers’ tax lock-in effect for corporate risk-taking. Prior Research: Stock Holdings and Risk
Researchers have long studied the relation between corporate risk-taking and equity
incentives in the form of stock and option holdings. Early theoretical work (Stulz 1984; Smith and
Stulz 1985) proposes that equity holdings create two opposing incentives among managers with
regard to risk-taking. The first incentive, which causes managers to increase risk, is due to the
convexity of the manager’s payoff structure. For example, options that are close to the exercise
price and stocks that are close to financial distress exhibit a convex payoff structure in which the
manager benefits substantially from an increase in firm value but faces relatively little downside
risk. On the other hand, options that are deep-in-the-money and stocks of firms that are not close
to financial distress exhibit a generally linear payoff structure that does little to encourage
risk-taking (Lambert, Larcker, and Verrecchia, 1991; Carpenter, 2000). The second incentive, which
deters risk-taking, is the exposure of managerial wealth to firm-specific risk. As noted in prior
literature, CEOs of U.S. firms tend to hold a significant portion of their personal wealth in firm
equity (Hall and Murphy 2002; Cai and Vijh 2005; Conyon, Core, and Guay 2011), causing the
9
have an incentive to reduce the volatility of their equity investments, as well as their human capital
investment, in the firm (Amihud and Lev 1981).
Empirically, it has proved difficult to isolate the causal links between equity incentives and
risk-taking. One issue is that managerial incentives and firm risk are likely jointly determined
(Coles et al. 2006), potentially confounding efforts to understand the direction of causality. A
recent paper by Shue and Townsend (2017b) attempts to overcome this challenge with regard to
the effect of option grants on risk-taking. Using variation in the timing of multi-year option grants,
the authors find that an increase in new options granted leads to increased equity volatility.
Prior work examining managerial stock holdings has similarly struggled to identify
causality. Two early studies find a negative association between managers’ stock ownership and risk-taking. Using a sample of 226 acquisitions, May (1995) finds that CEOs with more personal
wealth invested in firm equity tend to make diversifying acquisitions. He interprets his findings as
CEOs attempting to reduce their personal risk by diversifying the firm. Similarly, Tufano (1996)
finds that executives in the gold mining industry who own more stock display greater corporate
risk management. While important milestones in the literature, both studies suffer from having
small and narrowly defined samples, and do not attempt to establish causality.
I aim to overcome the endogeneity problem plaguing the literature by examining a series
of federal and state tax cuts that serve as shocks to CEOs’ stock holdings. Tax cuts represent shocks
to the cost of selling appreciated stock holdings, and thus I expect the tax cuts to trigger increased
stock sales and improved diversification for the affected CEOs (particularly those CEOs with
significant locked-in gains). Examining subsequent changes in corporate risk-taking can provide
plausibly causal evidence regarding the relation between CEOs’ stock holdings and risk.
Hypothesis Development
My central hypothesis stems from combining the literature on the capital gains tax lock-in
10
as a friction discouraging stock sales, I conjecture that over time, this tax lock-in causes the
executives to become overexposed to firm-specific risk. Thus, I predict that CEOs respond to their
own personal lack of diversification by becoming increasingly risk-averse with regard to corporate
operating and investment strategies, leading to lower overall volatility. A key component of my
identification strategy involves analyzing the effects of federal and state tax cuts that act as shocks
to CEOs’ tax burdens. I predict that tax cuts serve to reduce CEOs’ tax burdens thereby alleviating
the lock-in effect for affected executives, allowing them to achieve improved diversification and
leading to increased corporate risk-taking. Thus, my hypothesis is as follows:
H: CEOs’ tax burdens are negatively associated with corporate risk-taking.
There are several reasons to doubt the existence of a negative relation between CEOs’ tax burdens and corporate risk-taking. The first reason is related to the optimal incentive contracting
literature, as discussed above. For instance, if shareholders and boards recognize that the CEO is
becoming overweighted in the firm’s equity, they may award more risk-taking incentives such as
at-the-money options to counteract CEO risk aversion. There is considerable debate regarding
boards’ responsiveness to optimal contracting and incentive alignment concerns. Core and Guay
(1999), for example, suggest that firms grant new equity incentives in order to bring CEOs to
optimal equity incentive levels. A recent paper by Shue and Townsend (2017a), however,
demonstrates that the number of option grants during the 1990s and early 2000s was quite rigid,
indicating a lack of flexibility or responsiveness to individual CEO incentive alignment concerns.
If boards sufficiently adjust CEO compensation in response to frictions imposed by the executives’ tax burdens, this may preclude a negative relation between the tax burden and corporate
risk-taking.
A second consideration is that executives may be able to hedge their firm-specific risk by
holding derivative instruments designed to offset their insider ownership. Bettis, Bizjak, and
11
reduce their exposure to firm-specific risk, including collars, forwards, and exchange funds.
Among other findings, Bettis et al. (2015) note that executives residing in states with high income
tax rates are more likely to use exchange funds, which the authors attribute to the executives
seeking diversification while deferring the realization of taxes. If CEOs can sufficiently mitigate
firm-specific risk through holding derivative instruments, their tax burdens are unlikely to
influence their risk-taking decisions with respect to the firm.
A third reason that may prevent a negative relation between the CEO’s tax burden and corporate risk-taking is because the incentive effects of additional stock holdings are unclear.
CEOs with substantial equity holdings may desire to reduce the risk to their personal portfolio, but
they also do not wish to destroy shareholder wealth (and therefore, their own wealth) by choosing
sub-optimal projects. Thus it is not clear ex ante that the risk-aversion effect induced by exposure
to firm-specific risk will dominate CEOs’ incentives to maximize shareholder wealth.
III. SAMPLE AND DATA
Sample
My sample begins with all CEO-years in Standard & Poor’s ExecuComp database for years 1993 to 2014. I begin in 1993 because I require at least one year of prior compensation data to
compute the CEO’s tax burden on equity holdings, and the database coverage begins in 1992.
ExecuComp contains compensation information for the five most highly compensated executives
of firms in the S&P 500, S&P MidCap 400, and S&P SmallCap 600 indexes. I use CRSP data to
calculate the annual return and return volatility measures. Firm characteristics are drawn from the
merged CRSP-Compustat database. Consistent with prior literature regarding equity incentives
and corporate risk-taking, I exclude financial service firms and utilities (SIC codes 6000-6999 and
4900-4999, respectively). Requiring non-missing data for my risk measures and control variables
12 Variable Measurement
CEO Tax Burden
My central aim with the CEO tax burden measure is to reflect the role of taxes acting as a
friction preventing CEOs from diversifying their portfolios. Prior literature commonly assumes
executives display relative risk aversion (Hall and Murphy 2002; Cai and Vijh 2005; Conyon et
al. 2011), for whom lack of diversification drives risk-averse behavior. Based on this background,
the tax burden measure should capture the relative importance of the tax disincentive to sell as
well as the CEO’s ability to achieve diversification.
Given these objectives, one consideration is whether the tax burden should reflect the dollar
value of taxes owed, or instead a percentage of the CEO’s portfolio value (akin to a tax rate). I argue that a percentage-based measure better captures the relative importance of the tax.5 To best
reflect the executive’s ability to diversify, ideally I should scale the anticipated tax liability from
sale by the CEO’s total wealth. But since I cannot observe CEO outside wealth, I instead scale the
anticipated tax liability by the CEO’s total value of equity.6 Thus, a higher tax burden reflects a
larger share of the CEO’s total equity portfolio that will be owed in tax.
A second consideration derives from the fact that CEOs generally own batches of stock
acquired at different points in time and at different prices (and therefore the shares have different
tax basis). Investors are typically allowed to choose which specific shares they want to sell, which
raises the question of what to assume about which set of shares is sold (given that data limitations
preclude my knowing precisely the tax basis of any stock sale). My approach is to assume the CEO
5 As an illustration, suppose there are two CEOs, A and B, who face the same tax liability of $100 thousand upon sale of their respective portfolios. But CEO A owns a portfolio of $1 million (10% tax burden), whereas CEO B owns a portfolio of $5 million (2% tax burden). I would argue that the relative importance of the tax disincentive to sell is greater for CEO A, even though the dollar value of the tax liability is the same for both A and B. However, I find that the percentage tax burden measure is highly positively correlated with the dollar value measure (Pearson correlation 0.84) and my inferences are unchanged when using the dollar tax burden measure (see Table 9).
13
sold her entire stock portfolio, calculate the tax liability, and use that liability to calculate the
average tax rate for a sale.7 One argument in favor of this average tax rate approach is that it
follows a simple heuristic that may approximate the CEO’s decision-making process. In the corporate tax literature, recent evidence indicates that executives are more likely to make
incremental investment and financing decisions by considering the firm’s effective (average) tax
rate rather than the firm’s marginal tax rate, because it is easier to compute (Graham, Hanlon, Shevlin, and Shroff 2017). Executives might follow a similar strategy with respect to personal
investment decisions.
In light of these considerations, I construct the average CEO tax burden measure as the
total tax liability from the sale of all vested stock divided by the total value of the CEO’s stock and
option holdings (vested and unvested).8 The measure is similar to that constructed in Jin and
Kothari (2008), with three key differences. First, I modify the measure to include state taxes.
Second, Jin and Kothari (2008) examine the tax liability arising from all CEO equity holdings
(e.g., stock and options), whereas I focus on the component that arises from stock holdings alone.9
Third, Jin and Kothari (2008) scale the anticipated tax liability by the expected proceeds from the
sale (that is, the value of vested equity), but I instead scale the tax liability by the total value of
CEO equity (vested and unvested). Specifically, the measure is calculated as:
7 Another possibility is to make an assumption about which set of shares is sold (for example, assuming the CEO sells
the stock with the highest possible basis in order to minimize any potential tax liability), and calculate a “marginal”
tax rate based on that assumption. I find similar results throughout my tests when using a marginal tax burden measure computed based on the assumption that the CEO sells the 10% of her stock with the highest tax basis (see Table 9). 8 I focus specifically on the tax liability with respect to vested stock while excluding that on unvested stock. One reason for this is because CEOs do not have the ability to sell unvested stock, so there is no tax lock-in effect at work (that is, the barrier to selling is not due to the tax). In addition, the CEO has relatively little control over whether to incur the tax on unvested stock, as restricted stock is typically taxed upon vesting.
14
Year 1 represents the first year the CEO owns vested stock in the firm. � is the firm’s stock price at the end of year ; � is the price at the end of year (the year in which the CEO
obtained the stock); � represents the number of unrestricted shares held by the CEO in year that
were obtained in year ; �� is the total capital gains tax rate (federal plus state) faced by the CEO
in year upon selling the shares; and � �� � � �is the stock equivalent value from the CEO’s holdings of all stock and options at the end of year . Appendix B provides a detailed description
of how the tax burden is constructed.
Variation in the CEO’s tax burden is driven by several distinct features. The first is the
combined federal and state capital gains tax rate facing the CEO upon sale of the shares.10,11 The
second is the difference between the current stock price and the price at which the shares were
obtained (i.e., the taxable gain on the shares). The third factor determining the CEO tax burden is
the number of shares obtained in any given year relative to the total number of vested shares
owned by the CEO, which ensures that the shares obtained in any given year are weighted
appropriately when computing the tax burden. Finally, the CEO tax burden is influenced by the
total value of the CEO’s equity. All else equal, CEOs with more equity have lower tax burdens,
reflecting the relative importance of capital gains taxes in affecting their ability to diversify.
Tax Rate Changes
To help identify the relation between CEOs’ tax burdens and corporate risk-taking, I examine two federal tax cuts as well as a series of state tax cuts that took place during the sample
10 I assume all CEOs are subject to the maximum federal and state long-term gain tax rates. When determining the applicable state tax rate for each CEO, I assume the CEO resides in the state in which the firm is headquartered. To the extent this assumption is inaccurate, my tax burden proxy is measured with error.
11Compustat’s location data suffers from an error in that it reports the address of a firm’s current principal executive
15
period. The first federal tax cut was contained in the Taxpayer Relief Act of 1997, effective May
7, 1997, which reduced the top individual capital gains tax rate from 28% to 20%. The second
federal tax cut was part of the Jobs and Growth Tax Relief Reconciliation Act of 2003, which
reduced the top individual capital gains tax rate from 20% to 15%.
For the state tax changes analysis, I obtain data from the National Bureau of Economic
Research for the maximum marginal state tax rates on long-term capital gains. I classify decreases
in these rates as tax cuts, and increases in these rates as tax hikes. In order to ensure powerful tests,
I exclude any year-to-year changes smaller than 0.25% in magnitude.12 Additionally, I retain only
tax changes up through 2013 in order to leave sufficient time to observe a risk-taking response.
These criteria yield a sample of 73 tax cuts in 30 states, and 43 tax increases in 28 states from 1993
to 2013. The average tax cut reduces tax rates by 96 basis points and the average tax increase raises
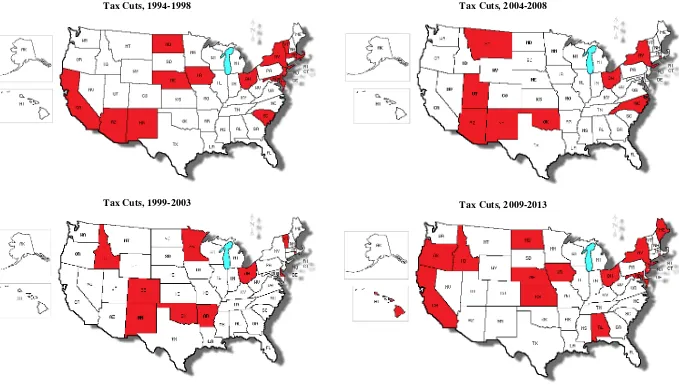
rates by 123 basis points.13 The list of state tax changes is given in Appendix C. Figure 1 maps tax
cut states over consecutive five-year periods to show the time-series and geographic distribution
of the tax shocks. Tax cuts are spread fairly evenly across the sample period, and display relatively
little geographic clustering.
Corporate Risk-Taking
I use three proxies for corporate risk-taking: total return volatility (Total Vol); idiosyncratic
volatility (Idio Vol); and earnings volatility (ROA Vol). Total return volatility is measured as the
standard deviation of daily stock returns. Idiosyncratic volatility is constructed as the standard
deviation of daily residual returns from the market model, using parameters estimated using the
12 Note that the results in the state tax change tests are not sensitive to this restriction. In untabulated analysis I perform the state tax change tests while retaining any changes greater than 0.10% in magnitude, and also while restricting any changes to be greater than 0.50% in magnitude. My inferences are the same in all cases.
16
prior 36 months of daily returns (Xu and Malkiel 2003). Earnings volatility is measured as the
standard deviation of seasonally adjusted quarterly returns on assets (ROA) over a three-year
period from t to t+2 (Ljungqvist et al. 2017). Appendix A contains details on variable construction.
Control Variables and Descriptive Statistics
Following prior research (Armstrong and Vashishtha 2012; Ljungqvist et al. 2017), I
include the following standard CEO and firm characteristics as control variables: CEO vega, CEO
delta, CEO cash compensation, CEO tenure, firm age, firm size, market-to-book ratio, leverage
ratio, cash surplus, loss carryforward, sales growth, and annual stock return. I also include a control
variable for CEO overconfidence (Malmendier and Tate 2005), as well as a control for the
proportion of the firm owned by individual shareholders in an attempt to control for the tax
sensitivity of the firm’s shareholder base. Although this proxy is imperfect because it does not
capture tax-sensitive institutional investors (Sikes 2014; Blouin, Bushee, and Sikes 2016), prior
literature has relied on the proportion of individual shareholders as a readily available proxy for
shareholder tax-sensitivity (Dhaliwal et al. 2007; Lin and Flannery 2013).14
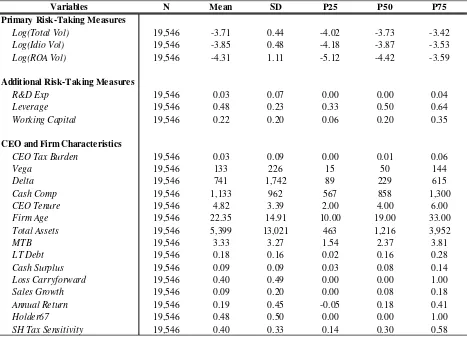
Table 1, Panel A presents summary statistics, which overall seem to be consistent with
prior research. The average CEO Tax Burden is 0.03, matching the mean of 0.03 in Armstrong et
al. (2015). Prior to taking logs, the average Total Vol is 2.7% and the average ROA Vol is 5.4%,
comparable to the respective figures (3.9% Total Vol and 5.1% ROA Vol) in Bova, Kolev, Thomas,
and Zhang (2015).
With respect to the descriptive statistics for the executive compensation variables, my
sample has a mean (median) vega of $133,000 ($50,000); delta of $741,000 ($229,000); and cash
compensation of $1,133,000 ($858,000), all comparable to the figures in Armstrong and
14 In untabulated analysis, I replace the proxy for shareholder tax-sensitivity with two other proxies for potentially influential tax-sensitive shareholders: the percentage ownership by the top five largest institutional investors, and an
indicator variable for whether the firm has an institutional investor owning greater than 10% of the firm’s outstanding
17
Vashishtha (2012). The distributions of firm characteristics in my sample appear similar overall to
those in Ljungqvist et al. (2017), with any differences likely attributable to differences in sample
composition. For example, the firms in my sample appear slightly older (mean of 22.4 years versus
19.6 years in Ljungqvist et al. 2017), somewhat larger (total assets of $5.40 billion versus $1.75
billion), and carry more cash (9.1% of assets versus 3.5% of assets). These differences likely arise
from the fact that my sample is drawn from firms included in the S&P 1500 index, whereas the
sample in Ljungqvist et al. (2017) includes all Compustat firms.
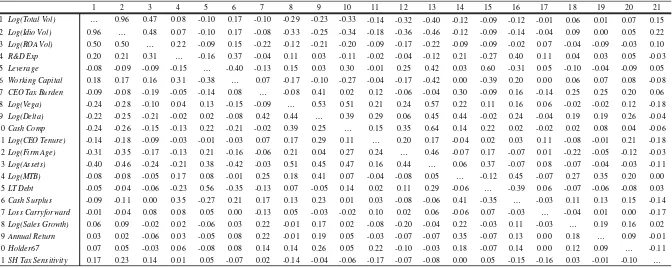
Table 1, Panel B reports the Pearson and Spearman correlations, which provide preliminary
evidence on the relation between CEOs’ tax burdens and corporate risk. Consistent with the conjecture that higher tax burdens reduce risk-taking, the Pearson and Spearman correlations
between CEO Tax Burden and the three primary measures of risk-taking are significantly negative.
Specifically, the Pearson (Spearman) correlations between CEO Tax Burden and Log(Total Vol),
Log(Idio Vol), and Log(ROA Vol) are -0.09, -0.08, and -0.19 (-0.11, -0.09, -0.22), respectively.
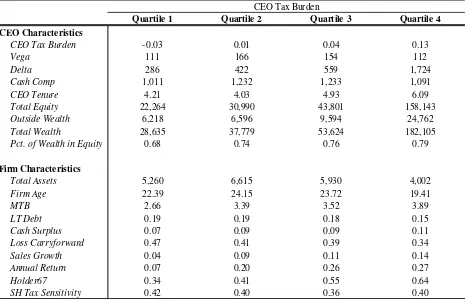
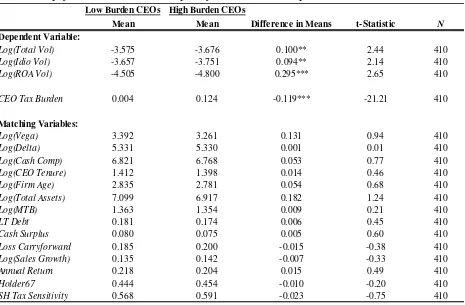
Panel C of Table 1 displays the mean values of key CEO and firm characteristics after
partitioning the sample on CEO Tax Burden into quartiles within each year. As CEO Tax Burden
increases, Delta and Total Wealth increase monotonically. At the same time, however, CEOs with
higher tax burdens appear to be significantly less diversified than CEOs with low tax burdens (Pct.
of Wealth in Equity is 0.79 for CEOs in the top quartile of tax burdens and 0.68 for CEOs in the
bottom quartile). This descriptive evidence provides preliminary support for the claim that CEOs
with higher tax burdens are those most in need of improved diversification.
IV. PANEL ANALYSIS
Panel Analysis: Research Design
To investigate whether CEOs’ tax burdens are associated with reduced risk, I test for the potential relation between risk measures (Firm Riski,t) and CEO tax burden for the previous year
18
Firm Riski,t= αi+αt + β1CEO Tax Burdeni,t-1 + ɤ′Xi,t-1+ ϵi,t. (2) In the equation above, i and t index firms and years, respectively; �� and �� are firm and
year fixed effects. The dependent variable, Firm Risk, represents the three measures of corporate
risk. CEO Tax Burden represents the CEO’s tax burden on her stock holdings in the firm, and the remaining control variables are drawn from prior research on compensation and corporate risk,
and are described in detail in Appendix A. To control for firm-specific factors and general
macroeconomic time trends, I include both firm and year fixed effects.15,16 I estimate the model
using ordinary least squares with standard errors clustered by executive and year. The variable of
interest in Equation 2 is CEO Tax Burden and my prediction is that the coefficient on this variable,
β1, will be negative, indicating that an increase in CEO Tax Burden in year t-1 is associated with
reduced risk-taking in year t.17
Panel Analysis: Results
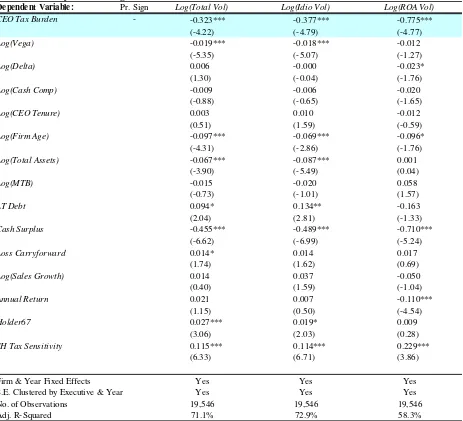
Table 2 presents the results from estimating Equation 2. The first column of Panel A shows
that the coefficient on CEO Tax Burden is negative and statistically significant (coef.=-0.323;
t-stat.=-4.22). This result indicates that increases in CEOs’ tax burdens in year t-1 lead to lower stock return volatility in year t, consistent with my central hypothesis. Similarly, columns 2 and 3
show negative associations between CEOs’ tax burdens and idiosyncratic volatility, as well as
earnings volatility. In economic terms, moving from the 25th to the 75th percentile of CEO Tax
Burden is associated with a 2.0% relative decrease in Log(Total Vol).
19
Turning to the control variables, I find that the coefficients on Log(Vega) are either
negative or insignificantly different from zero. Although early work in the area found a positive
relation between the convexity of the manager’s wealth-performance relation and risk-taking (e.g., Guay 1999; Coles et al. 2006), some studies examining more recent periods show an insignificant
or negative relation between vega and volatility (e.g., Hayes, Lemmon, and Qiu 2012; Anderson
and Core 2015). The coefficient on Log(Delta) is insignificantly positive in column 1, whereas the
coefficient on Log(Cash Comp) is insignificantly negative, generally consistent with Armstrong
and Vashishtha (2012). The coefficient on Log(CEO Tenure) is insignificant in column 1,
consistent with the result in Hayes et al. (2012). The coefficients on firm characteristics appear
overall consistent with results in Bova et al. (2015) and Ljungqvist et al. (2017). These results
include negative coefficients on variables for firm age, size, and cash surplus, and positive
coefficients on the presence of loss carryforwards, sales growth, and recent stock returns. Bova et
al. (2015) find a positive coefficient on the book-to-market ratio, corresponding to the negative
coefficient I find on the market-to-book ratio. And Ljungqvist et al. (2017) find a negative relation
between long-term debt and earnings volatility, similar to my finding for long-term debt in column
3. In addition, I control for managerial overconfidence with Holder67, which displays a
significantly positive coefficient in column 1, consistent with overconfident CEOs making riskier
corporate decisions. Further, I control for the portion of firm shares held by taxable individual
investors with SH Tax Sensitivity, which also displays a positive and significant coefficient.
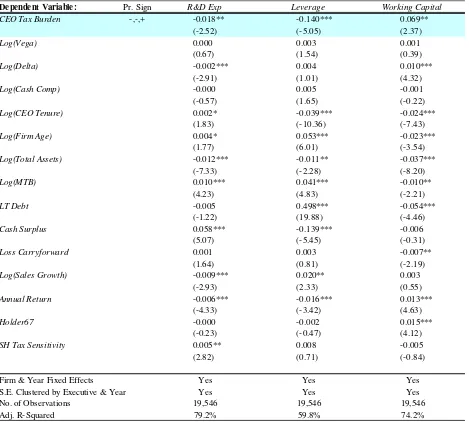
In Panel B of Table 2 I re-estimate Equation 2 after replacing Firm Risk with corporate
policies frequently used to proxy for risk-taking, including the levels of R&D expenditures,
leverage, and working capital. Economically, I find that moving from the 25th to the 75th percentile
of CEO Tax Burden leads to 3.7% lower R&D expenditures, 1.8% lower leverage, and 2.1% higher
working capital, all consistent with a greater aversion to risk. Overall, the results in Table 2 provide
20 Panel Analysis: Potential Confounding Factors
The panel analysis above, while informative, does not rule out the possibility of other
factors confounding my inferences. One potential concern is that some unobserved feature besides
executives’ tax burdens is driving CEOs’ equity holdings. An example is target ownership plans,
which commonly require CEOs to hold significant equity in the firm. While I acknowledge that
target ownership plans may affect CEOs’ equity holdings, I note that the inclusion of firm fixed
effects in my estimation model helps to mitigate any confounding influence of firm-specific
contract features. In addition, the evidence in Armstrong et al. (2015) regarding explicit ownership
guidelines indicates that the amount of equity required to be held by CEOs is relatively low (an
average of $1.2 million in their sample), further alleviating the concern that target ownership plans
have a substantial impact on my inferences.
A more significant challenge to my inferences from the panel analysis derives from the
construction of the tax burden measure. As noted previously, the CEO’s tax burden is determined
by several factors: the capital gains tax rate (federal plus state) facing the CEO, the stock’s historical price appreciation during the executive’s holding period, the number of shares held that were obtained during each year, and the value of the CEO’s equity holdings in the firm. These features raise potential endogeneity concerns with respect to interpreting the effect of the tax
burden on risk-taking. One concern is that the negative relation documented in the panel analysis
may be due largely to the firm’s past performance, rather than by the tax rate. Christie (1982) suggests that firms which have performed well in the past are likely to experience lower volatility,
as the market value of debt relative to equity declines. Known as the “leverage effect” (Aït-Sahalia,
Fan, and Li 2016), this mechanical relation between firm performance and volatility may confound
my inferences, as firms with positive past performance are likely to have CEOs with substantial
21
To address these endogeneity concerns, I perform a series of tests exploiting federal and state tax
cuts to isolate the influence of changes in the tax rate on corporate risk-taking.
V. FEDERAL AND STATE TAX CUTS ANALYSIS
Federal Tax Cuts: Research Design
First I examine the federal tax cut contained in the Taxpayer Relief Act of 1997 (TRA97)
which reduced the top individual capital gains tax rate on long-term investments from 28% to 20%,
effective May 7, 1997. This tax act has several features which make it a desirable research setting.
First, the change in the tax rate is economically significant – nearly a 30% relative drop in the maximum rate compared to the previous tax regime. Second, the capital gains tax reduction was
the most noteworthy feature of the TRA97, which contained few other provisions.18 Third, the tax
reduction was largely unexpected. On April 30, 1997, the Congressional Budget Office made a
surprise announcement that it had reduced its estimate of the 1997 deficit by $45 billion. Two days
later, on May 2, President Clinton and Congressional leaders announced an agreement to balance
the budget by 2002 and reduce the capital gains tax rate. The following week, on May 7, Senate
and House leaders announced that the effective date for any capital gains tax cut would be May 7,
1997 (Lang and Shackelford 2000). Given the unexpected and swift nature of the enactment of
TRA97, it is unlikely that CEOs anticipated the tax cut and adjusted their behavior preemptively.
Although the legislative change affected all CEOs simultaneously, I hypothesize that it had
a stronger effect on CEOs with high tax burdens just prior to the tax cut. My prediction rests on
two main arguments. First, CEOs with high tax burdens are more likely to be under-diversified as
a result of the tax lock-in effect, and thus the most eager to take advantage of a reduction in the
tax cost of selling. Second, CEOs with high tax burdens are likely to experience the greatest benefit
from the tax cut, as they are limited in their other options for reducing their tax bills upon a sale of
22
stock (for example, they are less likely than low-tax-burden CEOs to have some stock in a loss
position that they can use to offset a taxable gain). Since high-tax-burden CEOs are likely to benefit
the most from incremental diversification and stand to gain the most from a reduction in tax rates,
I predict a larger increase in risk-taking among these executives following the tax cut.
I construct a six-year window of observations surrounding the tax cut and require all
CEO-firm pairs to have at least four consecutive years of data to be included in the sample. I compute
each CEO’s tax burden at the end of 1996 (just prior to the tax cut), and estimate the following
regression:
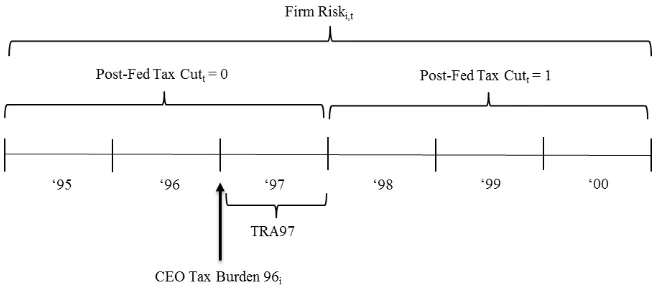
Firm Riski,t= αi+ β1Post-Fed Tax Cutt + β2Post-Fed Tax Cutt × Pre-Tax Cut Burdeni + ɤ′Xi,t-1 + ϵi,t.
(3)
Year t runs from 1995 through 2000. Thus Firm Riski,t includes firm i’s risk-taking in two years before, the year of, and three years following the tax cut in order to allow sufficient time for
any change in risk-taking to manifest.19Post-Fed Tax Cut
t is an indicator variable equal to one for years 1998 onwards, and equal to zero in the earlier years. Pre-Tax Cut Burden is equal to the
CEO’s tax burden measured as of the end of 1996, just prior to the tax cut. Firm Risk is defined as
previously, X represents the same control variables as in Equation 2, and αi represents firm fixed effects.20 I predict a positive β
2 indicating that CEOs with higher tax burdens prior to the tax cut will have a larger subsequent increase in risk-taking relative to low-tax-burden CEOs.
Next I perform a similar analysis for the period surrounding the capital gains tax cut
contained in the Jobs and Growth Tax Relief Reconciliation Act of 2003 (JGTRRA), which
reduced the top individual capital gains tax rate from 20% to 15%. Compared with the tax cut in
TRA97, JGTRRA is a relatively noisy setting in that the act contained other significant tax
19 Refer to Figure 2 for a graphical representation of the time periods over which the variables are measured and tests are conducted.
20 Note that the main effect Pre-Tax Cut Burden
i is excluded from Equation 3 because it reflects CEO tax burden
23
legislation that could confound my inferences. For example, JGTRRA reduced the top dividends
tax rate from 39.6% to 15%, the top ordinary income tax rate from 38% to 35%, and contained
bonus depreciation incentives designed to boost corporate investment (Blouin, Raedy, and
Shackelford 2011). While the impact of JGTRRA on corporate activity has been debated (e.g.,
Chetty and Saez, 2005; Campbell, Chyz, Dhaliwal, and Schwartz 2013; Yagan, 2015), the range
of major tax changes in the act makes it difficult to draw clean inferences about the capital gains
tax cut using this setting.
A potential concern related to using the difference-in-differences methodology for the
federal tax cut tests is whether firms with high-tax-burden CEOs are comparable to firms with
low-tax-burden CEOs. I attempt to mitigate these concerns by partitioning each sample at the
median into high and low tax burden CEOs just prior to each tax cut (using the end-of-year values
for 1996 and 2002 for the 1997 and 2003 tax cuts, respectively), and using propensity score
matching to more closely match the characteristics of the two groups of firms.21 Panels A and C
of Table 3 show the results of the matching procedure for the samples used in the 1997 and 2003
federal tax cut tests, respectively. In both cases, the matched treatment and control groups display
no significant differences in any of the matching variables.
Federal Tax Cuts: Results
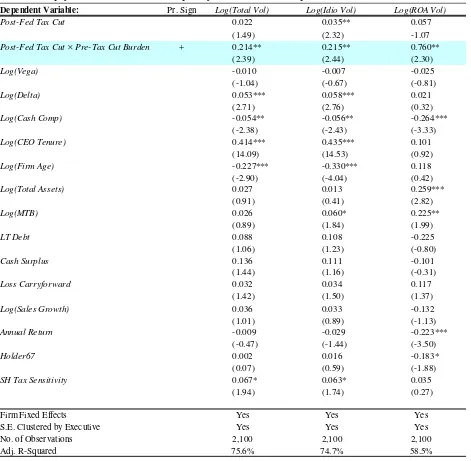
Panels B and D of Table 3 present the results from estimating Equation 3 for the two federal
tax cuts. Examining the main effect on Post-Fed Tax Cut in column 1 of Panel B, there is a positive
but insignificant increase in total return volatility for CEOs with a tax burden of zero in the three
years following the 1997 tax cut, (coef.=0.022; t-stat.=1.49). However, the coefficient on the
interaction term Post-Fed Tax Cut × Pre-Tax Cut Burden shows that high-tax-burden CEOs
24
experienced a substantially larger increase in corporate risk-taking following the tax cut
(coef.=0.214; t-stat.=2.39). Economically, I find that a CEO at the 25th percentile of CEO Tax
Burden in 1996 experiences a 2.4% increase in total return volatility, whereas a CEO at the 75th
percentile of CEO Tax Burden experiences a 4.6% increase.22 The results in columns 2 and 3
examining idiosyncratic volatility and earnings volatility yield similar inferences.23
Panel D displays the results for the analysis of the tax cut contained in JGTRRA of 2003.
Although the negative coefficients on Post-Fed Tax Cut indicate that for CEOs with no tax burden
prior to the tax cut, risk-taking decreased in the three years following the tax cut, the coefficient
on the interaction term Post-Fed Tax Cut × Pre-Tax Cut Burden is consistent with Panel B.
Specifically, the results indicate that firms with high-tax-burden CEOs prior to the tax cut
experience increased volatility following the tax cut, relative to firms with low-tax-burden CEOs.
As noted previously, JGTRRA contained other major tax legislation besides the reduction in the
capital gains tax rate, and accordingly these results should be interpreted with caution.
The evidence in Table 3 suggests that the federal capital gains tax cuts in 1997 and 2003
disproportionately affected CEOs with higher tax burdens prior to the cuts. I interpret the results
as indicating that the tax cuts reduced the tax cost to selling shares for locked-in CEOs, allowing
them to dispose of firm stock at a lower cost, diversify their personal wealth, and take on more
corporate risk. Overall, the findings in Table 3 provide evidence consistent with my central
prediction that higher CEO tax burdens discourage corporate risk-taking.
State Tax Cuts: Research Design
Next I exploit state-level changes in individual capital gains tax rates. Although smaller in
magnitude than the federal tax cuts, state tax rate changes provide several advantages in that they
22 Note that the 25th and 75th percentiles of CEO Tax Burden in 1996 were 0.010 and 0.113. Thus the economic magnitude of the effects can be computed by adding the main effect to the respective interaction effect. For the 25th percentile: 0.022 + 0.010 × 0.214 = 0.024; for the 75th percentile: 0.022 + 0.113 × 0.214 = 0.046.
25
change frequently, they are staggered over time, and each tax rate change only affects a subset of
CEOs, leaving a plausible counterfactual of unaffected CEOs. Similar to the tests examining
federal tax cuts, I predict that state tax cuts differentially affect CEOs with high tax burdens relative
to CEOs with low tax burdens. I test my prediction by estimating the following model:
Firm Riski,s,t= αi+ αt + β1|State Tax Rate Cuts,t| + β2Pre-Tax Cut Burdeni + β3|State Tax Rate Cuts,t| × Pre-Tax Cut Burdeni + ɤ′Xi,t-1 + ϵi,s,t.
(4)
Equation 4 is a two-way fixed effects model, containing firm and year fixed effects (αi and
αt, respectively), with subscript s representing the state in which the firm is headquartered. |State
Tax Rate Cuts,t| equals the magnitude of any reduction in the state’s top capital gains tax rate. For each tax cut, |State Tax Rate Cuts,t| is set equal to this value for a three-year period following the
tax cut to allow time for any changes in firm risk-taking to manifest (see Figure 2 for a graphical
illustration of the time period over which the variables are measured). If no tax cut has taken place
in state s within the previous three years, then |State Tax Rate Cuts,t| is set equal to zero. Pre-Tax
Cut Burdeni represents the tax burden of firm i’s CEO in the year prior to the tax cut. Firm Riski,s,t represents the three risk proxies measured in year t. I predict a positive β3 indicating that CEOs with higher tax burdens prior to each state tax cut will experience a larger subsequent increase in
risk-taking than low-tax-burden CEOs.24
State Tax Cuts: Main Results
Table 4 presents the results of estimating Equation 4. Consistent with the results from the
panel tests in Table 2, the coefficients on Pre-Tax Cut Burden are significantly negative indicating
that CEOs with higher tax burdens tend to have lower risk. The coefficient on |State Tax Rate Cut|
can be interpreted as the effect of a state tax cut on corporate risk-taking when the firm’s CEO has
24 It is important to note that although state tax changes are likely not exogenous with respect to macro or local economic conditions, they are still useful in identifying the effect of CEO tax burdens on corporate risk-taking for two reasons. First, the tax cuts allow me to isolate the effect driven by the tax rate component of the CEO’s tax burden,
thereby distinguishing it from the effect due to the stock’s historical price appreciation and the CEO’s past portfolio
26
a tax burden equal to zero. Although the main coefficients on |State Tax Rate Cut| are insignificant,
the coefficients on the interaction term |State Tax Rate Cut| × Pre-Tax Cut Burden are significantly
positive across all three measures of risk-taking. The results suggest that tax cuts have the largest
effects on CEOs with substantial embedded gains in their equity holdings (i.e., locked-in CEOs),
consistent with my central hypothesis.25
Economically, a one percent drop in the long-term gains tax rate leads to a modest 0.5%
increase in total return volatility for CEOs at the 25th percentile of CEO Tax Burden, relative to
CEOs in unaffected states. But the same tax cut leads to a statistically significant 2.1% volatility
increase for CEOs at the 75th percentile of CEO Tax Burden. The inferences from the estimations
using idiosyncratic volatility and earnings volatility in columns 2 and 3 are similar. For the sake
of comparison, Ljungqvist et al. (2017) find that a one percent increase in state corporate tax rates
reduces earnings volatility by between 2.4% and 3.2% over the subsequent three years.26,27
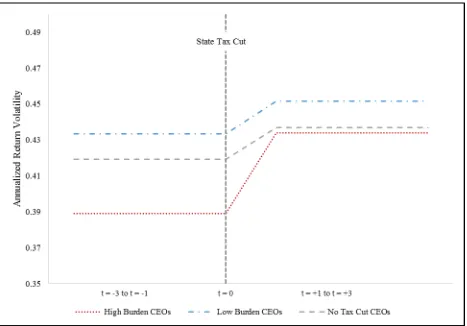
Figure 3 provides a visual depiction of the Table 4 results in a univariate
difference-in-differences style analysis. The three lines in the figure represent three groups of firms. The first
(second) group of firms consists of firms with high (low) tax burdens headquartered in states that
experienced tax cuts in year t=0, whereas the third group consists of firms headquartered in states
with no tax cut. The figure shows that high-tax-burden CEOs had lower volatility prior to the tax
cuts, but experience a substantially greater increase in volatility than unaffected CEOs and affected
low-tax-burden CEOs following the tax cuts.
25 I verify that the results in Table 4 are robust to interacting all control variables with |State Tax Rate Cut|.
26 To explore whether my results are driven primarily by the larger tax cuts in the sample, I partition the tax cuts into through groups: small (from 0.25% to 0.50%), medium (from 0.50% to 1.25%), and large (above 1.25%). Replacing |State Tax Rate Cut| with indicators for each group of tax cuts, I find that the largest tax cuts spur the largest increases in risk-taking, followed by medium-size tax cuts which generate marginally significant increases in risk, and finally small tax cuts which generate positive but statistically insignificant increases in risk-taking.
27 State Tax Cuts: S&P 500 Firms
One potential concern with the analysis so far is that the increases in volatility following
federal and state tax cuts may be driven by the tax incentives of outside shareholders rather than
those of inside managers. For example, prior research focusing primarily on outside shareholders
in the firm has shown that equity volatility increases following federal capital gains tax cuts (Dai
et al. 2013). Thus to the extent that the tax cuts affect outside shareholders in the firm as well as
the CEO, they have the potential to cloud my inferences.
Although the potential for outside shareholders to drive changes in firm risk in response to
tax cuts is certainly a concern in the federal tax cut setting, it is somewhat less of a concern in the
state tax changes setting because investors are taxed based on where they reside, not where the
firm is headquartered. For outside shareholders to drive the effects documented in Panel A of Table
4, there would have to exist a very strong within-state home bias among investors. Prior work
documents the existence of a local (e.g., within-state) home bias in investor portfolios, but the
effect is driven primarily by smaller firms with less publicly available information (Coval and
Moskowitz 1999, 2001; Ivkovic and Weisbenner 2005; Hong, Kubik, and Stein 2008). The
rationale is that investors have more familiarity with and access to private, value-relevant
information for local firms. However, the local information advantage is largely absent with regard
to S&P 500 companies that are followed by many stock analysts, covered closely by the financial
press, and researched and owned by numerous institutional investors, and thus the investor home
bias is weaker for these larger, more visible firms.28
Motivated by the relative lack of investor home bias for S&P 500 firms, I re-estimate
Equation 4 after restricting the sample to only the firms included in this index. If the increased
volatility following tax cuts shown in Panel A of Table 4 is driven by outside shareholders who
28 Specifically, Ivkovic and Weisbenner (2005) find that individual investors place 18% of their actual portfolios into
local S&P 500 stocks (where local is defined as firms headquartered within 250 miles of the investor’s household),
28
are residents of the state affected by the tax cuts, then this effect is likely to be weaker for firms
less susceptible to home bias (e.g., S&P 500 firms). However, the results for this estimation in
Panel B of Table 4 show that in fact the magnitude of the increase in volatility following the tax
cuts is somewhat larger for S&P 500 firms than it is for the whole sample of firms. This finding
helps to mitigate (but does not rule out entirely) concerns that the equity volatility response to the
state tax cuts is driven by outside shareholders who are also residents of the state.29
State Tax Cuts: Neighboring States Falsification Test
In this section I construct a falsification test for the results using the state tax cut setting.
Specifically, I re-estimate Equation 4 using the original sample of firms, but I assign “pseudo-tax
cuts” to the states that neighbor the “true” tax cut states. For example, in 2010 New Jersey reduced
its top long-term gain tax rate from 10.75% to 8.97%. In this test, I assign the tax cut to CEOs of
firms headquartered in states that share a border with New Jersey (i.e., New York, Pennsylvania,
and Delaware).
This falsification test helps to address two potential concerns. The first is that states may
change capital gains tax rates in response to changes in local business conditions. That is, a general
economic trend in the region could lead simultaneously to state-level tax cuts and increased
corporate risk-taking. While this potential confounding factor is less likely to explain the disparity
in the effects of the tax cut on CEOs with high versus low tax burdens, it could explain the general
relation between tax cuts and corporate risk-taking. Since presumably economic conditions carry
across state borders (Heider and Ljungqvist, 2015), failing to find any significant response by firms
in neighboring states helps to mitigate concerns that my results are driven by local economic
trends.
29
The second concern is that high- and low-tax-burden CEOs are not comparable, and thus
risk-taking could diverge for these groups of firms regardless of whether or not a tax cut takes
place. By testing for a similar response in states where no tax cut actually took effect, I can estimate
the counterfactual paths the two groups of firms may have followed. Failure to find diverging
trends in the absence of a tax cut should help build confidence that the previous results are in fact
driven by the effects of the tax cuts.
The results from the falsification test are presented in Panel C of Table 4. The coefficients
on the interaction term |State Tax Rate Cut| × Pre-Tax Cut Burden are statistically and
economically insignificant for all measures of corporate risk-taking. Given these results, an
alternative explanation would not only have to explain why risk-taking increases significantly for
high tax burden CEOs in states affected by tax cuts, but would also have to explain why there is
no corresponding difference among CEOs of firms located in neighboring states. This result helps
reduce concerns related to local economic conditions as well as whether CEOs with different tax
burdens follow comparable trends.
Tax Cuts Analysis: Potential Confounding Factors
Although the tests analyzing the effects of federal and state tax cuts help to mitigate
concerns regarding the potential confounding influences of the historical firm performance and
CEO portfolio choices, it is impossible to rule out all potential alternative explanations. As
discussed above, one potential concern is that increased volatility following tax cuts is driven by
outside shareholders who are also affected by the tax cuts, rather than by changes in managerial
incentives. I have attempted to address this concern by controlling for the tax-sensitivity of firm
shareholders, by demonstrating strong tax cut responses among S&P 500 firms which should be
the least affected by within-state home bias, and in subsequent tests by directly tying CEO stock
sales to increased risk-taking (Table 5) and by demonstrating similar findings with respect to
30
A second potential concern involves concurrent events, such as changes in corporate
income and ordinary income tax rates taking effect at the same time in the same place. To address
the concern about corporate tax changes, which have been shown to affect risk-taking
(Langenmayr and Lester, 2015; Ljungqvist et al. 2017), I re-estimate Equation 4 (in untabulated
results) after excluding all of the long-term gain tax cuts in my sample that occur within three years
of a corporate tax cut in the same state. Out of the 73 tax cuts in my sample, I find that 14 of them
occur within three years of a corporate tax cut in the same state.30 My inferences are unchanged
when excluding the capital gains tax cuts that overlap with corporate tax cuts.
Ordinary income tax rates pose a potential issue because unlike with federal taxes, many
states use the same tax rates for both ordinary income and long-term gains. Thus for many states,
when capital gains tax rates change, ordinary income tax rates change as well. One setting in which
there is a clear drop in capital gains tax rates without a corresponding drop in ordinary tax rates is
the federal tax cut contained in TRA97. Panel B of Table 3 shows results consistent with the
findings in the other tax cut tests, even in the absence of any substantial change in the ordinary
income tax rate. Furthermore, subsequent tests in Table 5 display increased stock sales for
locked-in CEOs followlocked-ing tax cuts. Slocked-ince galocked-ins from selllocked-ing stock are taxed at capital galocked-ins tax rates and
not ordinary income tax rates, this evidence suggests CEOs are responding to changes in the
taxation of capital gains income.
Finally, another potential concern is whether individuals and firms adjust compensation
practices in response to the changes in tax incentives. In untabulated analysis, I explore this
possibility by testing for changes in newly issued delta, vega, cash compensation (salaries plus
bonuses), and total compensation. In the years following the tax cuts, I do find statistically
significant increases in new delta and vega incentives awarded as well as an increase in total