A synthesis report - indiA
Case studies
Volume ii
Urbanisation
Poverty
-Climate Change
© November 2013
This synthesis report forms deliverable of Asian Cities Climate Change Resilience Network (ACCCRN, www.acccrn.org) India Phase III.
Published by:
TARU Leading Edge Pvt Ltd.
424, Qutab Plaza, DLF City phase I, Gurgaon 122002, Haryana State INDIA
Tel: +91 124 2560424 Fax: +91 124 2560421 Email: [email protected] Web: www.taru.co.in
The views expressed in this technical report do not necessarily represent those of the GEAG, TERI, TARU, Rockefeller Foundation or ACCCRN partners.
Text from this report can be quoted provided the source is acknowledged and TARU informed.
Suported by
Prepared by
November, 2013
A synthesis report - indiA
Case studies
Volume ii
Urbanisation
Poverty
CONTENTS
GorakhPur City
resilieNCe strateGy 2
1.1 Introduction 3
1.2 The City 3
1.3 The Context 4
1.4 Elements Of Resilience Strategy Formulation 4
1.5 The Method 4
1.6 Resilience Strategy 6
1.7 The Approach 6
1
Climate ProofiNG Guwahati, assam 82.1 Introduction 9
2.2 About Guwahati and Assam 9 2.3 Methodology and Approach 9 2.4 Key Findings 10
2.5 Climate projections 10
2.6 Outputs of TERI’s Study 11
2.7 Summary of Recommendations 11
2
iNdore City resilieNCe strateGy for ChaNGiNG ClimatiC sCeNarios 143.1 History and Background 15
3.2 Urbanisation Issues 15
3.3 Climate and Hydro-Meteorological Risks 16
3.4 Expected Impacts from Climate Change 16
3.5 Issues and Impacts Summary 18
3.6 City Resilience Strategy Highlights 20
3
surat City resilieNCe strateGy 264.1 Background of the City 27
4.2 Urbanisation Issues 27
4.3 Poverty 27
4.4 Climate and Hydro-Meteorological Risks 28
4.5 City Future Scenarios 28
4.6 Climate Change Impacts 29
4.7 Issues/Impact Matrix 31
4.8 City Resilience Strategy Highlights 32
CASE STUDY: GORAKHPUR ACCCRN India: Synthesis Report – Volume II
1.1 iNtroduCtioN
End of twentieth and beginning of twenty irst centuries witnessed to two unprecedented changes happening across the globe. First was unrolling of economic reforms that continue to shape economic growth of large number of developing countries. Akin with pace of economic growth is rapid growth of urban centers all over but more particularly in South-East Asian countries1. Before it came to be realized such is the
pace of economic change that almost 50% of world population has suddenly come to live in cities. India is no different and has observed 53.7% growth in number of towns in last decade2. According to recent World
Bank report3, India accounts for one-third of world
poor4. It is implicit therefore that contrary to prevailing
perceptions of poverty being endemic to villages in India, urban areas too are now home to millions of poor people. From where and why do poor people come to settle in urban areas, very often in most appalling subhuman living conditions is key question that needs serious thinking.
Parallel to global economic reforms but not necessarily consequence of it is growing concern of climate change. Climate being over arching phenomenon affecting every other function on earth, any signiicant change in climate has potential of affecting social, economic and political milieu of nations. Relation between economic growth and climate health is perhaps better understood in recent times than it was thought ever before. Government policies and development initiatives are more interested and inclined in favor of supporting sustainable models of economic growth and development. Climate impacts viz. loods, cyclone, draught and temperature whilst are increasingly becoming more devastating and frequent, beckons serious relooking and mainstreaming of into planning considerations of development projects.
Quest for sustainable development and to button down problems of urbanization, economic growth and climate change is extensively pursued at various levels. All said and done, what is visible more and more is shift in livelihoods of people from farm to non-farm based employment sectors. Development policies need to recognize and address current occupational shifts and make suitable corrections and adjustments, thereof.
1 Asian Cities Climate Change Resilience Network – Aug 2012 2 Ministry of Urban Development, GoI, January 2012 3 World Bank Report 2013
4 Less than 1.25 US$ (about Rs 65) per day
City Resilience Strategy (CRS) is premised to address climate impact challenges faced by city systems and services offered to people. Strategy document has been conceived, designed and developed to test notion of resilience of a city made vulnerable to climate change impacts. Strategy document is enriched by irst-hand experience of local people who have withstood many disasters by being at the center of it. Lessons drawn from other countries and important policy analyses go into making of present strategy document for its application by city managers. CR attempts to capture complexities of urban systems and suggests short to long-terms interventions to build city resilience. Strategy chooses to empower local people and their institutions who it believes hold keys to process of building resilience of city.
1.2 the City
Gorakhpur is situated on banks of two major river systems, namely Rapti and Rohin. It is spread over 147 sq. km. area and located at height of 75-85 meters above mean sea level. Gorakhpur is unique to have large number of water bodies; biggest among all is Ramgarh Tal in south-east part of city. Proximity of city to Himalayan mountain range and location in tarai region, Gorakhpur has moderate climate with annual average temperature 25.68ºC. Summer and winter temperatures however peaks to 31.95ºC and 19.57ºC respectively. City receives 119.2 cm of annual rainfall with maximum precipitation recorded in months of July to September.
Gorakhpur is one of the fastest growing cities of mid-Gangetic region. City is administered by 70 municipal wards having a total population5 of 692519 spread
unevenly in city. Old wards of city have very high density of population. Population of Gorakhpur has increased rapidly with record growth of 64.1% during 1981-1991 due to expansion of city by incorporating 47 peripheral villages into municipal area6. Large number of slums
constitute roughly 33% of total population of city resides in 110 different locations with or without tenure rights.
5 Census 2011
6 Master Plan 2021 of Gorakhpur
1
Gorakhpur City Resilience Strategy
SUMMARY
Prepared by: Gorakhpur Environmental Action Group (GEAG)
Full Version of the Gorakhpur City Resilience Strategy can be downloaded from:
CASE STUDY: GORAKHPUR ACCCRN India: Synthesis Report – Volume II
1.3 the CoNtext
In last couple of decades, Gorakhpur has been
experiencing unprecedented problems of water logging in large areas of city causing loss of employment and physical damages to property. Health issues are grave concerns for the city and have been increasing in exponential terms with large number of deaths reported every year due to water and vector-borne diseases. Population growth and vehicular pollution have reached to levels which were never experienced before. There is fast depletion of open areas in city due to large scale unplanned construction all over. Civic services are at the nadir, non-existent or at best exist in unhygienic and unusable state. City becomes virtual hell and unlivable during rains. Gorakhpur is fast turning to become a place where rains are NOT welcomed any more by large number of households.
In backdrop of humungous problem faced by city, crucial determinant for success for city resilience was to develop a method and approach that people and administration equally share and also willing to support. Method need to assess and establish climate risks to city and determine consequent vulnerability of communities. It meant designing participatory tools using which hydrogeology of city, climate variability and allied risks and vulnerability of people is put into perspective of development planning for overcoming challenges faced by people. In following sections, general outline of method and strategy formulation is explained.
1.4 elemeNts of resilieNCe strateGy
formulatioN
Strategy has looked into following essentials into making of resilient city:
1.4.1 understand historic climate trends and futuristic projection
Over hundred years of precipitation and temperature data is analyzed to understand historic climate events and trends. Similarly, temperature and precipitation projections of Gorakhpur city for years 2046 to 2065 is analyzed by running CGCM3, CNRM, MIUB and CSIRO climate models. Such analysis show maximum and minimum temperatures of Gorakhpur will increase and decrease respectively for maximum and minimum
temperatures compared to past hundred years of climate. Projection data shows increasing trend of maximum temperature for all four seasons. There is not enough model agreement over precipitation data. It might decrease in period from December to February and increase from March to May and later during September and October. Historic climate data however show that Gorakhpur is experiencing same amount of rainfall in less number of days, meaning thereby heavy to very heavy rainfall in shorter spells.
1.4.2 understand fragility of systems and service
It is important to understand people’s access to system and service, what are the systems most impacted by climate change, why do systems and services become fragile, are these designed to withstand climate impacts and able to render services even when stressed, have systems been designed after taking climate projections into consideration, what are roles and responsibilities of people who manage/use systems and how is one system linked and dependent on other systems and implications of failure of one over other systems.
1.4.3 understand vulnerability and resilience options
How do people cope and manage when denied access or deprived of accessing system and its services, who are most vulnerable and why are they so, what could be done to build resilience of people, systems and thus of city on whole
Inputs from above three steps have been extensively used in designing of city resilience strategy.
1.5 the method
Knowing well that climate impacts are harsh on vulnerable communities not properly protected or having safe access to infrastructures and services, it was challenge to design method7 that well and truly
represents entire city of Gorakhpur. Through rapid assessments and consultations with large population samples, preliminary survey inputs were collected. The city was divided into 7 police zones. Survey inding were shared and discussed with representatives of 7 zones. Representatives were facilitated to identify and
7 City Resilience Strategy Gorakhpur
also prioritize severity of climate risks, its impacts and vulnerabilities of communities in their respective areas. Perception mapping done with people were cross-validated with municipal data of services in respective wards. Using Google imagery and GIS techniques, 30% households were identiied by stratiied sample method for detailed household surveys were carried to
CASE STUDY: GORAKHPUR ACCCRN India: Synthesis Report – Volume II
1.6 resilieNCe strateGy
Having identiied and prioritized climate risks to systems and services and related vulnerability of communities, it was important to diagnose causes behind systemic failures and/or malfunctions when put under climate stressed conditions. It was more important to ascertain and establish systemic behavior under projected climate conditions for Gorakhpur city in order for strategy to recommend and inluence short and long term investments decisions of Municipal Corporation for infrastructure development.
Climate change impacts in Gorakhpur have been broadly classiied and put under three major causes. These are:
1. Natural causes
2. Behavioral causes of people who manage and use systems
3. Policy and political causes
1.7 the aPProaCh
Approach towards city resilience is based on prudence of improving system eficiency through behavior change and performance improvement of people who manage systems and those who use. It works on principle of minimum demand for energy and investments together with high returns through public education and accountability measures. Resilience strategy of
city is aligned with approach and to inherent principles therein. It addresses sphere of inluence that works more at behavior to inluence areas of concerns e.g. natural and infrastructure systems. In regions of high rural-urban ratio, it makes sense to work more at level of sphere of inluence than sphere of concern.
In Gorakhpur water logging, drainage, solid waste, drinking water and sanitation services are hampered badly by climate change impacts. It is visualized that resilience could be build by addressing fragility of systems to climate change impacts by rendering improved access of communities to services and by quality implementation of rules and policies.
Major problems faced by residents of Gorakhpur due to climate change impacts have been put under seven groups each representing a sector.
sector Climate change, impacts and vulnerability
Basic services Sanitation, hygiene, drainage and safe drinking water
Housing Inundation, low cost house design for water logged situation
Industry Industrial waste and pollution, safety at work place, housing for workers
Health Seasonal outbreak of epidemic, preventive health, health surveillance
Energy/Electricity Power failure and breakdowns, production/livelihoods, alternate energy
Transport Eficient transport mechanism, vehicular emission,
Ecosystem Conservation of public and open areas, water bodies
City resilience building is an evolving and continuous process. Therefore, CRS would need periodic reviews by stakeholders for needed adjustments. Proposed resilience strategy is unique in sense that it attempts to build synergy at three different levels i.e. system, users and providers and governing rules and policies. In Gorakhpur, out of seven interlinked sectors, four sectors have been identiied for pilot interventions. Sectors like water, sanitation, drainage, housing, health and natural ecosystems are badly hampered under
CASE STUDY: GUWAHATI ACCCRN India: Synthesis Report – Volume II
2.1 iNtroduCtioN
As part of the Asian Cities Climate Change Resilience Network (ACCCRN), TERI has made an assessment of the risk and vulnerability of the city of Guwahati and has prepared a detailed resilience strategy. The focus of TERI’s assessment is to facilitate adaptation initiatives and mainstream them into the city development paradigm to make Guwahati city more resilient and prepared towards the risks. This risk assessment largely extracted local information in the form of secondary data along with consultations with the government departments and relevant stakeholders. Besides this a climate scenario assessment was also carried out by TERI to understand the future implications of climate change on the city. Review of existing policies and governance framework of the city was an integral part of the assessment to identify channels for integrating adaptation and disaster risk reduction measures in planning and development.
2.2 about Guwahati aNd assam
The population of Assam according to the 2011 census stands at about 31 million, making it the 14th most populated state in India. The state is spread over an area of about 78000 sq. km. making it the 16th largest state in the country in terms of area. The density of population per sq. km. is about 397 against the national average of 382. It comprises of 27 districts, 219 development blocks and 26,395 villages1.
Guwahati is the capital city of Assam and the largest city in the North East Region. The total population of Guwahati UA/Metropolitan Region is 968,549. Guwahati is located towards the south-eastern side of Kamrup district, surrounded by Nalbari district in the North, Darrang and Marigaon districts in the East, Meghalaya State in the south and Goalpara and Barpeta districts in the West. Located on the banks of the Brahmaputra River, it is the largest commercial, industrial and educational centre of the N-E Region. The city also surrounds one of the Ramsar Notiied wetlands, the Deepor Beel which is under threat due to the encroachment and unplanned urban development of the city. The city is prone to loods and landslides and is located on the earthquake prone belt. The preparedness to deal with disasters and combat
1 http://www.agriassam.in/agriHorti_proile/Proile_ofAgri-HortiSector_ofAs-sam-June2012.pdf
its impacts is low which has made the city and its residents quite vulnerable.
2.3 methodoloGy aNd aPProaCh
A detailed step by step description of the methodology adopted for risk and vulnerability assessment in Guwahati is given below:
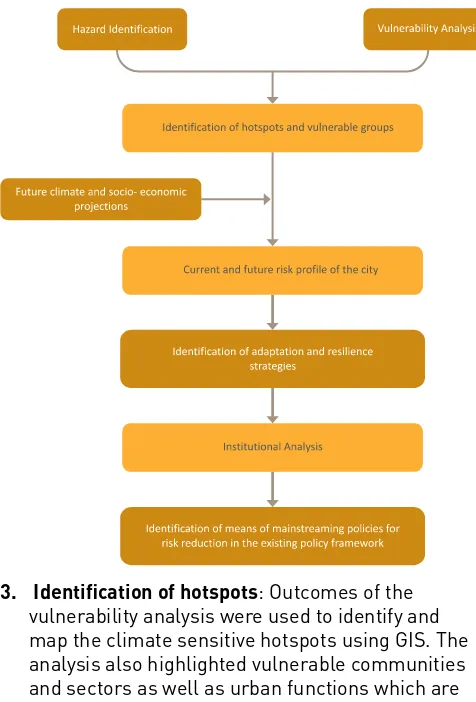
1. hazard identiication: The initial step in risk assessment was the identiication of natural, human-made and human induced hazards and stressors (climatic and non-climatic) which have been affecting the city of Guwahati. This was done on the basis of literature review, city level stakeholder consultation, and an analysis of the relevant secondary data.
2. Vulnerability analysis: An analysis of the characteristics of the city was conducted to determine the level of exposure to the identiied hazards and stressors. Variables such as
topography, population dynamics, socio-economic condition and land use pattern were studied to understand the sensitivity of the city to the hazards. The quantitative assessment was supported by an analysis of the spatial information retrieved from satellite imageries and inputs from the stakeholder consultations.
2
Climate Proofing Guwahati,
Assam
City Resilience Strategy and Mainstreaming Plan
SUMMARY
Prepared by: The Energy and Resources Institute (TERI)
Full Version of the “Climate Proofing Guwahati, Assam. City resilience strategy and Mainstreaming Plan” can be downloaded from:
CASE STUDY: GUWAHATI ACCCRN India: Synthesis Report – Volume II
figure 1: study framework
3. identiication of hotspots: Outcomes of the vulnerability analysis were used to identify and map the climate sensitive hotspots using GIS. The analysis also highlighted vulnerable communities and sectors as well as urban functions which are more vulnerable to risks and hazards.
4. Climate projections: Climate projections for 2030s at a resolution of 25 km X 25 km were conducted for the region to understand the change in
temperature (mean, min and max) and precipitation from the baseline. For this purpose, daily outputs from PRECIS model were used at 25 km x 25 km resolution. Projections for A1B scenario for the time slice 1961-1990 referred to as ‘baseline’, and 2021-2050 referred to as ‘2030s’ were utilized.
5. Current and future risk proile of the city: The information generated on vulnerable hotspots, communities and urban functions was used to generate the current risk proile of the city.
6. identiication of adaptation and resilience options to address the risks: In the next step, adaptation and resilience options to address these risks were identiied. The strategy aimed at having a holistic set
of sector speciic adaptation options to address their vulnerability and building climate resilience in the city.
7. review of existing policies and legislations to identify gaps in addressing to risks: A review of existing policies, legislations and by-laws was conducted to prepare a mainstreaming action plan.
2.4 key fiNdiNGs
Change in land use pattern of Guwahati city due to uncontrolled development activities is said to have done a lot of harm to the ecology and environment of the city. A trend analysis of the change in land use land cover shows an increase in the built up area. It is also evident that there has been more sprawl and inill development in certain pockets in the past 5 years. The city consultations and literature review about the city revealed three major components to hazards in the city:
1. Unplanned, unregulated urbanization and its consequences
2. Past climate variability and associated impacts
3. Disasters including loods, earthquakes and land slides
The individual consultations revealed that water supply is greatly hampered in the city during the lood events. Besides this, the overall lack of drainage, absence of solid waste management system and pollution of surface water bodies and ground water sources has created a vicious cycle that leads to looding and water logging in the city every year. Cutting of hills for encroachment, constructing buildings and large scale deforestation in the city has led to blockage of drainage channels, destruction of top soil and high rate of soils erosion on the exposed hill slopes.
2.5 Climate ProjeCtioNs
2.5.1 temperature trends
Data for both maximum and minimum temperature shows an increasing trend over the city of Guwahati. For minimum temperatures barring 1997 and 2011, all the years show a clear increasing trend in the
values. Similarly, except for 2003-2005, values for the maximum temperature also show an increasing trend.
2.5.2 rainfall trends
The daily rainfall data from Indian Meteorological Department Regional Meteorological Ofice (RMC), Guwahati from 1982-2011 was averaged to get monthly values. A decreasing trend of seasonal as well as annual rainfall over the city was observed. It was also observed that there has been an increase in extreme rainfall events resulting in more rainfall in short duration. This can be one of the attributing factors for urban looding.
2.6 outPuts of teri’s study
2.6.1 City resilience strategy
As an output of this study, a city resilience strategy document was prepared which captured the key indings of the various assessment stages (climate projections, vulnerability, hazard and risk assessment exercise) and comprised of a set of sector speciic adaptation options to address the vulnerability of the city. The following sectors were identiied as the key sectors to address the present and future vulnerability of the city in the context of climate change impacts:
• Housing and urban planning
• Urban infrastructure and services (water supply; sewerage; natural and storm water drainage; solid waste management; electricity; health)
• Informal settlements and slums
• Ecosystems and land-use
• Emergency response capacity
2.6.2 mainstreaming strategy
In order to ensure implementation of the recommended resilience measures, a mainstreaming strategy was also prepared with the aim of understanding the current institutional mechanisms to address the risks and disasters faced by the city. An integral step for this stage was review of existing policies, legislations and by-laws which helped in identifying the gaps in
the existing policy regime to address the current and future risks. The strategy aims to communicate the means of integrating and mainstreaming policies for risk reduction in the existing policy and institutional framework of the city.
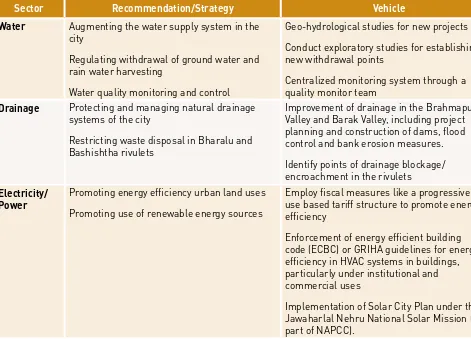
2.7 summary of reCommeNdatioNs
CASE STUDY: GUWAHATI ACCCRN India: Synthesis Report – Volume II
sector recommendation/strategy Vehicle
housing Guidelines for construction of buildings on slope
Structural stability of buildings in hills and for the entire GMA
Soil erosion and sedimentation control for construction in non-hill GMA areas
Precautions and technical details for use of Septic tanks and Soak-pits
Rain water harvesting for storage
Section 61 on ‘Special regulations for
construction in hilly areas’ in the Building Bye laws for Guwahati Metropolitan Area need to integrate these points.
Intensive micro-zonation studies to be conducted to identify vulnerable areas as per the sub soil conditions of GMA.
Norms to be introduced in the Building Bye Laws of GMA 2006
Enforcement of Section 56 of ‘Building laws for GMA 1998’ and ‘Revised Building Bye-laws-2006 for GMC’ which states the necessary provisions and precautions to be followed for septic tank/seepage pits/dispersion trenches
Section 65 (i)(b) in the New Revised Building Byelaws for GMC- 2006 provides for terrace water collection and connected to a recharge point in all group housing schemes/apartment and commercial complexes/institutional buildings. This provision should be mandated for such buildings
urban planning
Demarcate eco-sensitive areas in the city as low/no built up areas
Planning of 3 new satellite towns to be on the principles of sustainability
Change in land use zoning and development regulations
Use of Urban Development and Plan
formulation Guidelines (UDP FI) for norms for optimum densities, land use zoning in hilly areas while Master Plan formulation
Use of National Habitat Standards as proposed under the National Mission on Sustainable habitat-One of the 8 Missions of The Prime Minister’s National Mission On Climate Change.
urban ecosystem management and
conservation
Conservation of green areas/wetlands/beels- Inside the jurisdiction of GMDA
Preparation of Conservation and management plan for wetlands
Preparation of inventory and demarcation of natural water bodies and green areas
sector recommendation/strategy Vehicle
water Augmenting the water supply system in the city
Regulating withdrawal of ground water and rain water harvesting
Water quality monitoring and control
Geo-hydrological studies for new projects
Conduct exploratory studies for establishing new withdrawal points
Centralized monitoring system through a quality monitor team
drainage Protecting and managing natural drainage systems of the city
Restricting waste disposal in Bharalu and Bashishtha rivulets
Improvement of drainage in the Brahmaputra Valley and Barak Valley, including project planning and construction of dams, lood control and bank erosion measures.
Identify points of drainage blockage/ encroachment in the rivulets
electricity/ Power
Promoting energy eficiency urban land uses
Promoting use of renewable energy sources
Employ iscal measures like a progressive and use based tariff structure to promote energy eficiency
Enforcement of energy eficient building code (ECBC) or GRIHA guidelines for energy eficiency in HVAC systems in buildings, particularly under institutional and commercial uses
Implementation of Solar City Plan under the Jawaharlal Nehru National Solar Mission (as part of NAPCC).
CASE STUDY: INDORE ACCCRN India: Synthesis Report – Volume II
Indore City Resilience Strategy for
Changing Climatic Scenarios
SUMMARY
Prepared by: TARU Leading Edge
Full Version of the “Indore City Resilience Strategy for Changing Climatic Scenarios” can be downloaded from:
http://indiaurbanportal.in/BestPracticesResult.aspx?type=3&SearchID=182 http://indiaurbanportal.in/Publications/Publications182/Publications182760.PDF (Hindi) http://indiaurbanportal.in/Publications/Publications182/Publications182756.PDF (English)
3.1 history aNd baCkGrouNd
Indore is the most prominent city and commercial capital of Madhya Pradesh. It is also the headquarters’ of Indore district. Indore agglomeration’s population increased from 1.51 million persons in 2001 to 2.17 million persons in 2011(decadal growth rate of 42%). It was 17th largest city in India during 2001 and is now to 15th largest city.
Situated on the western part of the Malwa (Deccan Plateau) at an altitude of 550 m above mean sea level (MSL), it links Central India with the coast. The city lies in black cotton soil region in a relatively lat plateau having a gentle slope towards the north. The Khan River and its tributaries traverse through the densely populated areas of the city. The city of Indore had its irst municipality in 1870. In the year 1956, it was declared as a Municipal Corporation and is currently governed by the Madhya Pradesh Municipal Corporation Act, 1956. The Indore Municipal Corporation is divided into 14 Zones administered by two functional bodies namely Political Wing (deliberative) and Executive Wing. The city has a municipal area of 134 sq.km and the total planning area (including IMC and Indore Development Authority area) is 524 sq.km.
3.2 urbaNisatioN issues
Indore is one of the fastest growing cities and is called Mumbai of Madhya Pradesh. It is also the largest industrial hub of Madhya Pradesh. The decadal population growth of 42% during the last decade indicates that it is growing faster than many other cities across India.
Since the city is located in plateau environment, there are no land constraints. Indore is the largest city in the neighborhood and is likely to be the destination of push migrants from rural hinterlands. The city scenario exercise conducted with the city stakeholders indicated that migration as well as infrastructure and service quality would be most important critical uncertainties that would determine the future growth.
3.2.1 migration Pattern
The city is located in the semi-arid zone, by complex, diverse risk-prone agricultural region lying in rain-shadow zone of Western Ghats. In the hilly parts
neighboring the city, land quality is poor and per capita cultivable land is low and agricultural yields are low and uncertain due to rain-fed agriculture. It is inhabited by a mix of tribal and caste population who are predominantly poor. Any climate change can further increase the risk to subsistence agriculture and rural population is forced to migrate to the nearby cities, with economically stronger Indore becoming the preferred destination for the migrants. These rural migrants are skill poor and the city economy may be affected by the push migration. In such a case, the proportion of low skilled workers will increase and they need to be supported by subsidized lifeline services. If Indore continues to attract secondary and tertiary sectors of economy, Indore may become preferred destination for skilled workers. Its current potential to attract educational and medical institutions will be an added advantage. Such pull migration is likely to result in demand for better services and ability to pay for better services. Therefore, the migration pattern will be most important critical uncertainty for the future
figure 3.2: indore urban future scenarios (risk to resilience workshop, indore 2010, aCCCrN)
CASE STUDY: INDORE ACCCRN India: Synthesis Report – Volume II
dry days with few very heavy showers. This has led to increased water logging as well as occasional loods. Water logging has reportedly increased the incidence of vector-borne diseases. Impervious soils, increasing proportion of paved areas, blockage of drainage by construction of roads as well as blockage of drainage by solid wastes are believed to be increasing the incidences and duration of waterlogging.
The indirect impacts of climate change include increased incidence of water and vector-borne diseases, exacerbated by the water scarcity routinely experienced by the citizens. The major growth in peak demand for electricity can be expected to occur due to higher summer temperatures as well as affordability of air conditioners among majority of the households as well as ofices/ commercial/industrial work spaces. With the continued high temperatures lasting through evening and early part of the night, the energy demand for space cooling is likely to stress the electricity network. Occasional droughts can reduce the hydel power generation as is being experienced by the state this year. Grid failures can increase the vulnerability of the energy was well as water supply sector signiicantly.
For analysis on Rainfall, temperatre, future rainfall and temperature analysis (2021-2100), extreme event analysis, refer to the city resilience strategy document.
3.4 exPeCted imPaCts from Climate
ChaNGe
The water will remain the critical resource that can cause large scale impacts on Indore. Models indicate that in this century there is a possibility of only a marginal increase (+200 mm) in annual rainfall. The climate projections indicate dominance of extreme events that would mean either long dry spells or few very heavy rainfall events dominating the monsoon. In case of droughts, the city’s reliance on Narmada would increase, which may be accompanied by unreliable power supplies. With heavy rainfall events dominating the monsoon, rainwater storages of higher capacity would be needed at various levels starting from individual buildings to city level. The city should have suficient sewerage as well as solid waste management system, which would prevent mixing of rainwater with the contaminants from sewage. The Indore water security study has indicated about 5%
3.2.2 City level resource/infrastructure management
Since the Indore city depends on distant water resource of Narmada River to meet its growing water demands, the cost recovery will be critical for managing water infrastructure of the city. Also, with the increasing energy costs can add additional burden on the IMC. The maintenance as well as capital investments required will depend on the city’s ability to recover the costs. Considering the huge gap in municipal inances, the ability to charge the consumers and to maintain the infrastructure will be another major critical uncertainty.
The quality of services would improve only if there is expressed demand for services. So far, the citizens have not been proactively demanding for better services even though water supply is provided only once in two days. Only in case of non-supply, the people protest, but even they are unorganized.
The city stakeholders built four scenarios based on the two critical uncertainties. These scenarios are presented in the previous igure. While “City of Opportunities” scenario is most desired, it would require several enabling conditions to be met and the living environment needs to be kept above the minimum threshold much above the current status. Political will, continued investments and willingness of community to demand and pay for the services would be essential preconditions for this scenario to emerge. For each one of the scenarios, early signs were identiied, so that realignment of the goals of the ULB to provide basic services.
3.3 Climate aNd hydro-meteoroloGiCal
risks
In the past, Indore was known for pleasant evenings even during peak summers, known as Shabe’ Malwa. Indore is already facing increased temperatures in summers. Combined effect of regional climate change as well as urban heat island effects have reportedly led to continued temperature lag well in to the nights during the summers. The peak temperatures reach upper 40’s and also dust storms from western desert region often reach the city. Indore was also known for gentle rains throughout the season, while now it faces
further by combined effect of climate change and urban heat island effects. The urban heat island effects may further increase the temperature in the inner city area by about 3-4ºC.
The current per capita consumption of 250 kwh/year is very low, and is expected to increase by about 10% over next decade while the consumption may increase by about 61% under BAU calculations of the Utility(with 50% decadal population growth). The additional
increase due to climate change would depend on the affordability of the households. The practice of using individual owned space cooling systems is likely to concentrate heat in semi-closed spaces in multi-storied buildings.
The extreme heat days can create peak loads and black outs similar to ones faced during last summer. Cascading effects of power supply breakdowns can impact distant source based water supply system and impacts of water supply can only be prevented with continued conservation of local surface and ground water resources, managed by the communities. Recycling of water, recharge and conservation of ground water and conservation of local sources like lakes are important to deal with such cascading impacts.
3.4.3 land
Land is not a major constraint in Indore, except for the core area of the city. Two main growth axes are seen in the development pattern of the city. They include South-west (towards Mhow) north (towards Ujjain). The population growth across wards indicates that the core area is getting depopulated and converted in to commercial areas, while there is high growth in outer core and periphery. Except for the core and lower income group colonies, Indore has signiicant open areas. The population growth is likely to put pressure on these open areas.
While there is growing trend of building multi-story buildings as well as increasing use of glass cladding in the city, the urban heat island effect and increased energy use density(for space cooling) can worsen with haphazard taller buildings blocking free low of winds. A signiicant number of low height buildings (up to 3 story) currently seen in the outer core may change to high rise buildings, especially along the main roads. increase in evapo-transpiration, which will offset much
of the increase in precipitation, if the water is stored in surface reservoirs.
Ground water recharging offers an option, but it would require decentralized efforts at household and colony levels. Strengthening of ward committees as well as Rehwasi Sangh (Residents welfare associations) would be critical in ensuring these along with active cooperation from sewerage and solid-waste management utilities.
With high costs of water imported distant source and increased water scarcity, it is important to conserve and recycle water. Current paradigm of centralized sewage treatment outside the city may not be suitable for recycling water. Decentralized options can create opportunities to reuse water from irrigation of gardens and ground water recharge. Such paradigm shift can reduce costs of sewerage network as well as integrate water supply systems with recycling and reuse at colony levels. It would necessitate policy and legal interventions like rainwater harvesting bill enacted few years back.
3.4.1 storm water drainage and loods
Increase in intensity of precipitation can result in increased frequency as well as intensity of loods. Since the city has black cotton soils, in the events of loods very low coverage of storm water drainage and limited sewerage will prolong the duration of water logging/ looding. Without integrated storm water drainage and lood control plan, the city may be subjected to more frequent and intense loods under climate change scenarios. Haphazard growth and blockage of natural drainage may further worsen these issues.
3.4.2 energy
The energy dependency for water pumping will increase with population growth and the impacts of climate change. The PRECIS model indicates reduction of rainfall in the upper catchment of Narmada, while increase in the middle and lower reaches.
CASE STUDY: INDORE ACCCRN India: Synthesis Report – Volume II
3.4.4 health
Vector borne disease outbreaks have become more common over last decade due to combined effects of urban development without suficient drainage and poldering effects of road construction resulting in prolonged water logging of some of the areas. Integrated drainage development has not been done so far. Only about 20% of roads have drainage. Poor solid waste management has further blocked the natural drainage. Along with water logging, increase in humidity, increase in minimum temperatures are likely to extend the disease vector viability periods and may worsen the disease incidences.
3.4.5 infrastructure impacts
With Suficient storage along the upstream stretch of the river basin, water resource at Narmada River is not a major issue in the coming decades, but this source needs signiicant energy for pumping. The combined effect of increasing electricity demand without concurrent increase in generation capacity and competing uses can impact the Narmada water supply system, which is dependent totally on electricity. The city water supply can be impacted severely if the electrical system is over loaded, especially during summers when the local sources dry up.
To overcome the road maintenance problems in black cotton soil terrain, the IMC has been laying concrete roads in important stretches as well as in slum areas prone to water logging. Unless large funds are available, these measures are unlikely to cover most of the road network. The existing roads may be affected by rains and increased temperatures, causing increased expenditures. Increasing intensity of rains without suficient storm water drainage and sewerage network is likely to contribute to the deterioration of road infrastructure in expanding black cotton soils as well as increase waterlogging.
3.4.6 differential impacts on poor
Signiicant proportions of slums in Indore are located along the streams and are prone to lash loods. Slums are also most vulnerable to waterlogging and vector-borne diseases due to their location. Under various donor funded programmes, improvement of drainage and road network are being attempted. But the outcomes of such measures often do not last beyond the project periods. The recent donor funded
programme, MPUSP, has overcome many of these issues, but the issue of solid waste management still needs attention to provide sustainable solutions. Sustainability of community based organizations created by the project would necessitate continued engagement by the ULB.
The temperature increase is also likely to cause differentially higher impacts on poor due to overcrowded settlements, low ventilation and poor vegetation cover. Since most poor cannot afford space cooling devices beyond fans, nor the increasing costs of electricity, they are likely to be impacted differentially. During the monsoons, high humidity conditions, combined with increased monsoon temperatures can increase discomfort in under-ventilated houses.
3.5 issues aNd imPaCts summary
Indore already faces major issues of water scarcity, sewerage and solid waste management. While
resource scarcity exists in case of water, low expressed demand from users and poor management is largely responsible for the current status. The city population is expected to double if the current trends continue. That would mean building to ill the gap in infrastructure and services and additional investment equivalent to cumulative investments done so far in housing, water supply, sewerage, solid waste management. Considering current challenges, Transport and urban health management would be other two major areas of concern. The main issues and impacts that Indore city has to address over coming decades is presented in the following table.
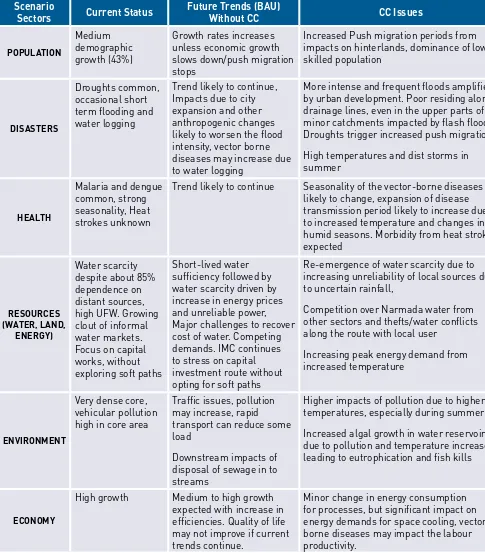
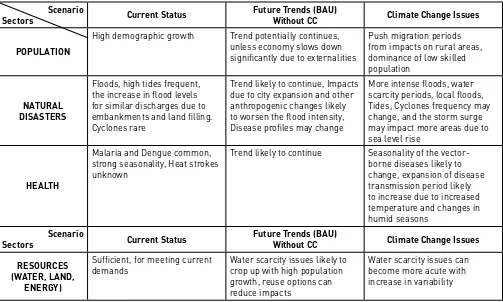
table 1: issues matrix
scenario
sectors Current status
future trends (bau)
without CC CC issues
PoPulatioN
Medium demographic growth (43%)
Growth rates increases unless economic growth slows down/push migration stops
Increased Push migration periods from impacts on hinterlands, dominance of low skilled population
disasters
Droughts common, occasional short term looding and water logging
Trend likely to continue, Impacts due to city expansion and other anthropogenic changes likely to worsen the lood intensity, vector borne diseases may increase due to water logging
More intense and frequent loods ampliied by urban development. Poor residing along drainage lines, even in the upper parts of minor catchments impacted by lash loods. Droughts trigger increased push migration.
High temperatures and dist storms in summer
health
Malaria and dengue common, strong seasonality, Heat strokes unknown
Trend likely to continue Seasonality of the vector-borne diseases likely to change, expansion of disease transmission period likely to increase due to increased temperature and changes in humid seasons. Morbidity from heat strokes expected
resourCes (water, laNd,
eNerGy)
Water scarcity despite about 85% dependence on distant sources, high UFW. Growing clout of informal water markets. Focus on capital works, without exploring soft paths
Short-lived water suficiency followed by water scarcity driven by increase in energy prices and unreliable power, Major challenges to recover cost of water. Competing demands. IMC continues to stress on capital investment route without opting for soft paths
Re-emergence of water scarcity due to increasing unreliability of local sources due to uncertain rainfall,
Competition over Narmada water from other sectors and thefts/water conlicts along the route with local user
Increasing peak energy demand from increased temperature
eNViroNmeNt
Very dense core, vehicular pollution high in core area
Trafic issues, pollution may increase, rapid transport can reduce some load
Downstream impacts of disposal of sewage in to streams
Higher impacts of pollution due to higher temperatures, especially during summer
Increased algal growth in water reservoirs due to pollution and temperature increase leading to eutrophication and ish kills
eCoNomy
High growth Medium to high growth expected with increase in eficiencies. Quality of life may not improve if current trends continue.
CASE STUDY: INDORE ACCCRN India: Synthesis Report – Volume II
and lack of consensus. The following approach has been used to build leadership about resilience building by the local and state stakeholders:
• Building on addressing current risks and vulnerabilities with CC context
• Create awareness about climate risks and generate demand: Bottom up approach
• Demonstrate resilience projects to generate interest among the ULBs and other decision makers
• Generate Multi-Sectoral Information & Shelf of Project Proposals
• Building synergy with state and national institutions
It has to be noted that the local stakeholders linked the climate change with water scarcity, changing precipitation pattern as well as increasing temperatures during summer evenings. Series of “Risk to Resilience” and scenario building workshops helped in their raising awareness about a variety of issues like migration, possible resource scarcities and urban health. These workshops built consensus over the linkages between urban growth, poverty and climate change. These exercises traced the recent history of Indore and changes being felt by the citizens and possible impacts of such changes continuing along with rapid urbanisation and migration.
These workshops led to identiication of interventions to address the issues raised from analysis of secondary data ranging from climatic, demographic and economic model outputs, local knowledge of stakeholders and facilitation by us. The main sets of interventions across the sectors are presented in the following tables.
scenario
sectors Current status
future trends (bau)
without CC CC issues
teChNoloGy
Fast up gradation to overcome labour scarcity
Shift to more eficient water and energy technologies, especially by those who can afford.
Water reuse technologies can alleviate scarcity. Eficient lighting, mass rapid transport can reduce energy use and pollution impacts Service access to poor, sustainability issues exist
Gated communities and slums coexist. Poverty may increase due to push migration from large underdeveloped drought prone hinterlands with skill poor population
Push migration can lead to conlicts and distress
With near doubling of population, impacts of urbanisation would be much higher than climate change impacts in case of Indore. Extreme precipitation patterns are likely to catalyse large scale push migration from complex diverse risk prone environments with large pool of skill poor labour in to Indore and neighboring cities, which have high costs of water and other basic needs. Poverty is likely to grow, unless conscious efforts are done in skill building of the push migrants and providing opportunities to for them to be absorbed in to the formal economy.
3.6 City resilieNCe strateGy
hiGhliGhts
Being located in the underdeveloped state, Indore faces resource and policy constraints from the state level. The city also faces challenges in terms of lack of demands for better services, capacity of the city administration to address rapid urbanisation, amidst of inance and natural resource base constraints.
On the positive side, Indore has been the focus of donor attention over last two decades and has implemented several donor funded projects aimed at improving the access to urban services to poor. Valuable lessons have been learnt from these projects which has informed this resilience strategy. Indore is expected to continue to attract donor funds for pro-poor inclusive urban development and also expected to guide the inclusive development programmes and debate at state and national levels.
Indore city ULB faces challenges of administrative, municipal inancial autonomy and health, political will
Signiicant changes are expected in economic, urban governance and social situations over this period and more information would be available from emerging higher resolution climate models, economy and demographic trends. It is suggested that a reassessment of these proposed interventions is done by 2015 and suitable modiications may be done in the strategies and interventions.
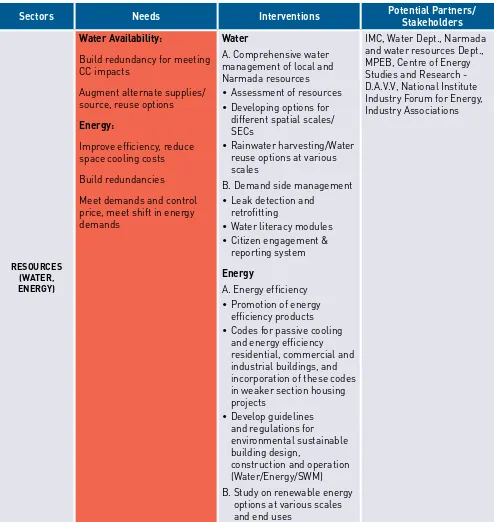
table 2: suggested short term interventions
sectors Needs interventions Potential Partners/ stakeholders
resourCes (water, eNerGy)
water availability:
Build redundancy for meeting CC impacts
Augment alternate supplies/ source, reuse options
energy:
Improve eficiency, reduce space cooling costs
Build redundancies
Meet demands and control price, meet shift in energy demands
water
A. Comprehensive water management of local and Narmada resources
• Assessment of resources
• Developing options for different spatial scales/ SECs
• Rainwater harvesting/Water reuse options at various scales
B. Demand side management
• Leak detection and retroitting
• Water literacy modules
• Citizen engagement & and energy eficiency residential, commercial and industrial buildings, and incorporation of these codes in weaker section housing projects
• Develop guidelines and regulations for environmental sustainable building design,
construction and operation (Water/Energy/SWM)
B. Study on renewable energy options at various scales and end uses
CASE STUDY: INDORE ACCCRN India: Synthesis Report – Volume II
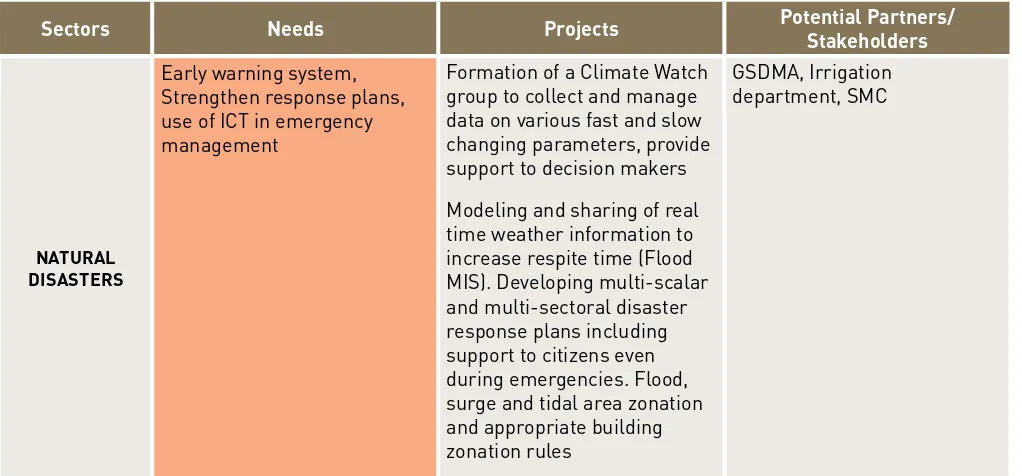
sectors Needs interventions Potential Partners/ stakeholders
Natural disasters/ health issues
Reduce risk exposure, especially for poor
Warning and forecasting products for severe weather events strengthen city disaster management plan
Vector borne disease surveillance and health monitoring system
A. Flood plain zoning and advance warning system
B. City level storm water drainage master plan including rainwater harvesting options
C. Improving disaster response plans including evacuation of citizens from high lood risk zones
D. Disease monitoring system with epidemiological research support & health GIS
IMC, Public Health Deptt. Emergency oficials, Hospitals, Irrigation Deptt. NGOs
urbaN serViCes
Meet global standards, high rating in service level benchmarks
Access to affordable, appropriate and health services and information
A. Benchmarking vulnerability of critical lifelines and infrastructure to CVCC risks
B. Develop framework for online/continuous monitoring of gaps/ deiciencies in urban services
IMC, Service Deptts, IDA, NGOs, Community Volunteers
PoPulatioN
Income Vulnerability reduction through Informal education, skill upgradation
A. Increasing livelihood options through informal skill building courses on technologies, improved services and management with close linkages with industry
B. Industry approved certiication process
C. Climate leadership training programmes introduced
Educational institutions, Vocational Training Institutes, NGOs, Chamber of Commerce and Industry
sectors Needs interventions Potential Partners/ stakeholders
eNViroNmeNt
Reducing vehicle pollution, trafic issues, park cool island (PCI) effect, better environmental services
A. Plan for increasing share of public transport, IT enabled Transport system
B. Increase in green cover, especially along road network
C. City’s environment management plan (monitoring of key parameters, maintain within speciied standards)
D. City level group for
monitoring and advisory to the ULB
IMC, IDA, Educational & Research Institutions, Industry/Automobile Associations, MP Pollution Control Board, Civil society
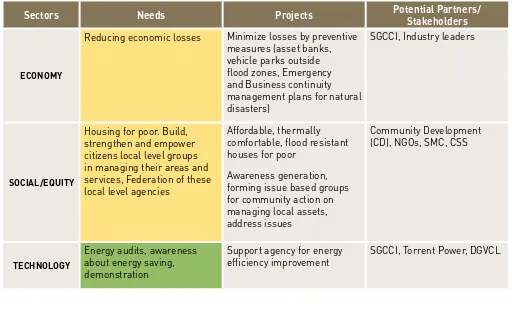
eCoNomy
Reducing economic losses A. Establishment level disaster management plans,
B. Water/energy eficiency improvement conservation plans
Industry associations, Industry Leaders
teChNoloGy
Use of state of art water and energy saving technologies.
City level water, energy, transport management system
Energy audits, awareness about energy saving
A. Technology plan for water and energy sector
B. Support agency for energy eficiency improvement
C. Demonstrate effectives of technology in select units (residential/ commercial/ industrial)
IMC, IDA, MPEB, Industry Associations, Educational and Research Institutions
soCial equity
Build, strengthen and empower citizen’s local groups in managing their local areas
Empowering and devolving resource /service
management to ward levels
A. Ward level planning
program focusing it’s on the ground level issues
B. Form and facilitate issue based groups for community action and managing of local assets
C. Empowering poor communities
CASE STUDY: INDORE ACCCRN India: Synthesis Report – Volume II
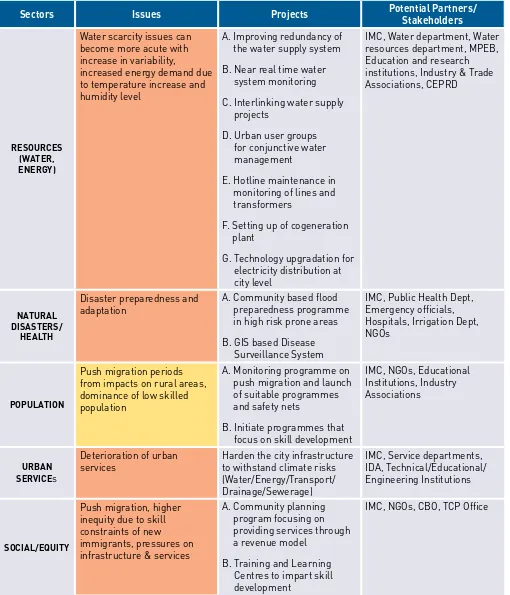
table 3: medium term interventions incorporating CC risks
sectors issues Projects Potential Partners/ stakeholders
resourCes (water, eNerGy)
Water scarcity issues can become more acute with increase in variability,
increased energy demand due to temperature increase and humidity level
A. Improving redundancy of the water supply system
B. Near real time water system monitoring
C. Interlinking water supply projects
D. Urban user groups for conjunctive water management
E. Hotline maintenance in monitoring of lines and transformers
F. Setting up of cogeneration plant
G. Technology upgradation for electricity distribution at city level
IMC, Water department, Water resources department, MPEB, Education and research institutions, Industry & Trade Associations, CEPRD
Natural disasters/
health
Disaster preparedness and adaptation
A. Community based lood preparedness programme in high risk prone areas
B. GIS based Disease Surveillance System
IMC, Public Health Dept, Emergency oficials, Hospitals, Irrigation Dept, NGOs
PoPulatioN
Push migration periods from impacts on rural areas, dominance of low skilled population
A. Monitoring programme on push migration and launch of suitable programmes and safety nets
B. Initiate programmes that focus on skill development
IMC, NGOs, Educational Institutions, Industry Associations
urbaN serViCes
Deterioration of urban services
Harden the city infrastructure to withstand climate risks (Water/Energy/Transport/ Drainage/Sewerage)
IMC, Service departments, IDA, Technical/Educational/ Engineering Institutions
soCial/equity
Push migration, higher inequity due to skill constraints of new immigrants, pressures on infrastructure & services
A. Community planning program focusing on providing services through a revenue model
B. Training and Learning Centres to impart skill development
IMC, NGOs, CBO, TCP Ofice
sectors issues Projects Potential Partners/ stakeholders
eNViroNmeNt
Higher impacts of pollution due to higher temperatures, severe loss of green cover, poor quality of urban environment
A. Comprehensive Transport Master Plan based on forecasting latest technologies
B. Revive old water tanks across the city and increase green cover
C. Development of integrated municipal waste processing facility
D. Implementation of environmental building guidelines/energy code in the construction of new buildings and retroit of existing buildings
IMC, Horticulture Department, Transport Department, Educational and Research Institutions, Industry/ Automobile Associations, NGOs, Environmental consultancy irms
eCoNomy
City loses opportunity due to CC impacts and risks
A. Reassess economic growth and global demand pattern to bring in greater eficiency in services and business
B. Develop and implement forward looking policies action plans that proves best for business and residents (infrastructure landscape, health, safety and security, liveability)
C. Create environment (branding, marketing) for encouraging pull migration of high quality human resources
IMC, IDA, Planning Institutions, Industry & trade Associations, Resident Associations, Transport Department, Police and Emergency Services
teChNoloGy
Indore becoming a centre for CC technologies, resilience approaches
A. Expansion focused on clean and sunrise industry/ service sector
B. Establishment of Theme Park to create public awareness and provide solutions
CASE STUDY: SURAT ACCCRN India: Synthesis Report – Volume II
Surat City Resilience Strategy
SUMMARY
Prepared by: TARU Leading Edge
Full Version of the “Surat City Resilience Strategy” can be downloaded from:
http://indiaurbanportal.in/frmDocAlbum.aspx?Srno=181&Type=3 http://indiaurbanportal.in/Publications/Publications181/Publications181755.PDF (English)
4.1 baCkGrouNd of the City
The city of Surat, located on the western part of India in the state of Gujarat on the River Tapti, is an important historical trade centre and trade link between India and Gulf countries. Surat was a gateway to the Deccan plateau and was an important port and trading centre during the Mughal period. The city has one of the highest proposed investments and almost zero percent unemployment. It is one of the fastest growing cities in India.
Surat has a Tropical Monsoon Climate. Summer temperatures in Surat range from 37 to 44ºC with winter temperatures dropping to 22ºC. Monsoon begins in June and last till end of September, with the average temperature being around 28ºC during those months. Average annual rainfall is approximately 1,143 mm. The city faces the risks of both sea level rise and looding. The Ukai multipurpose dam built upstream, 94 km from Surat, was meant for lood control management and for irrigation, power generation. During the last two decades the city of Surat and the surrounding metropolitan region has witnessed major loods.
Surat city has seen an unprecedented growth in last four decades recording one of the highest city population growth rates in the country. The City now ranks as the 9th largest city in the country. Coupled with this, the spillover of population into periphery has also been observed. From time to time jurisdictional limits of SMC have also been extended to include the outgrowth.
4.2 urbaNisatioN issues
Surat is 70th largest City in the world and is expected to become 41st largest city in the World by 2020 (City Mayors.com Website 2010). It is also ranked as the fourth fastest growing city in the world with population of more than 1 million. It is ranked as the 131st richest cities of the world with a GDP of 22 billion USD in 2006, which is expected to rise to 119th rank by 2020 with a GDP of about 57 Billion USD and a growth rate of 6.5 percent annually.
The city population is expected to grow to nearly 7.53 million by 2025, without considering the city area expansion (UN population data 2010) with average decadal population growth rate of about 50% percent
over the 2011-25 period as against all India decadal urban growth rates of 27% only. This would mean that the city has to provide housing and lifeline services for another 3 million people or nearly 67% additional capacity in lifeline services. The expansion of basic urban services for the additional population would need investments of at least Rs.1,436 Crore for water supply, sewerage, storm water drainage, solid waste disposal, roads and streetlights as per Planning commissions’ per capita investment estimates at 2004-2005 prices. This is over and above the costs towards hardening the existing infrastructure.
The Surat city, being located on the lood plain of Tapi River, is already facing high tide inundation issues during rainy seasons. It is likely to face challenges of increasing vulnerability to loods and sea level rise. Also, further expansion of Hazira industrial area in the lower lood plain, is expected to worsen the lood risks.
One of the major characters of the Surat city is the strong social fabric. The future scenarios developed by the city stakeholders have raised the issue of community cohesion arising out of the growing immigrant population.
Considering the current industrial, infrastructure and investment growth (both in Surat and Hazira) as well as the demand for the labour for Surat’s textile and diamond industries combined with push migration from rural/agricultural hinterlands can give rise to 50% + population growth during the next decade. The UN population projections estimate 48% decadal growth in population during 2010-2020 period. (UN 2010)
4.3 PoVerty
Similar to other rapidly growing cities in India, Surat has its own share of slums. The slums have mostly migrant population who are unable to afford formal housing. As per 2001 Census, about 20% of the Surat’s population (0.49 million) lived in 307 slums. With the recent expansion of the city in 2006, this number has increased to 420 slums. Many of these slums are located along the tidal creeks, between the river embankments and other drainage lines. These slums face higher risk of looding (pluvial, luvial and tidal). In addition to slums, the low income settlements exist throughout the city. Some of them are upgraded slums. The slum and low income population of the city is
CASE STUDY: SURAT ACCCRN India: Synthesis Report – Volume II
estimated to be about 34% of the total population (TARU 2010).
The Urban community development department (SMC) is active and monitors delivery of essential services in slums. In comparison other Indian cities, slums in Surat have better access to water supply, drainage and sewerage facilities. But, very high in-migration of semi-skilled workers from across the country is challenging the efforts of SMC. Having recognized the lood risks, efforts to relocate the slums were initiated by the government under various schemes (mainly during the last decade under various national projects including JNNURM) and more than 30,000 permanent houses at safer location were provided to the slum dweller.
4.4 Climate aNd hydro-meteoroloGiCal
risks
Surat is lies in the lood plain of Tapti river near it’s conluence with Arabian Sea. Tapti basin is about 587 km long from east to West and about 201 km wide (N to S) and is elongated in shape passing through Madhya Pradesh and Maharashtra. Tapi is one of the large perennial rivers in Western India. It is 724 km long originating from Multai in Betul district of Madhya Pradesh and cutting across the Western Ghats and joining Arabian Sea near Surat. Total catchment area of the Tapti river basin is 65,145 km2 including about 79%, 15%, and 6% in Maharashtra, MP, and Gujarat respectively. Its upper catchment lies in semi-arid region with high coeficient of variability in rainfall.
In the catchment area of Tapti River, the monsoon generally starts during the third week of June and there are occasional heavy rainstorms from the beginning of August to the end of September. The mean annual rainfall in the basin is estimated to be about 758 mm. and the average monsoon rainfall from 1988 to 1998 was 897 mm. The maximum annual rainfall (1,168 mm) and the minimum of (257 mm) were recorded in 1944 and 1899. Most of the loods in Tapti occurred during August.
4.4.1 flood history
Throughout the history of more than seven centuries, the city of Surat has experienced loods, ires and plague epidemics. The city earlier had a lood
protection ring wall built with bricks and several gates,
which were closed during loods. Westerly moving depressions arising out of Bay of Bengal moving from upper Tapi catchment to the Arabian Sea cause heavy rainy spells lasting 3-5 days. The runoff often gets concentrated due to this process, causing heavy river discharges by the time the lood water reaches Surat. During the period 1876 to 2009, the Tapti crossed the danger level at Hope Bridge in Surat 27 times, i.e., on an average every ive years.
For current and past climate data analysis, Rainfall, Future Precipitation Analysis: 2021 – 2100. Extreme Event Analysis, Temperature, Future Temperature Analysis: 2011-2100, refer to the Surat City Resilience Strategy document.
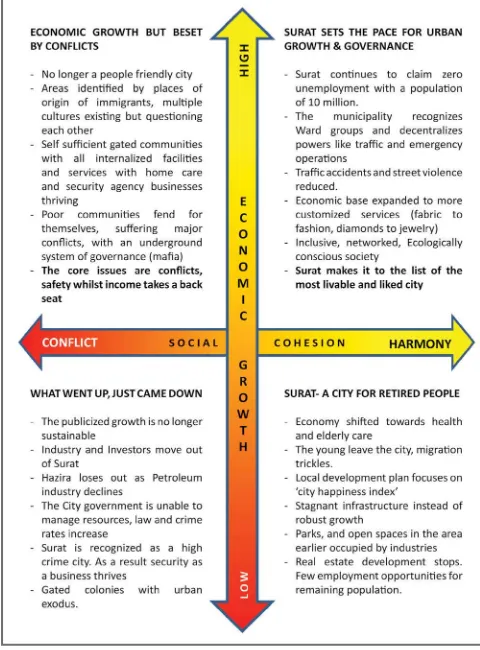
4.5 City future sCeNarios
Based on two critical uncertainties identiied by the City Advisory Committee, four future socio-economic scenarios were developed. These provide a combination of improvement or decay of Social cohesion (X axis) and economy (Y axis). These scenarios relect 2030-2040 periods and are based on the set of certainties and uncertainties identiied by CAC. The diagram highlighting the four scenarios is presented in the Figure 4.5: Surat Urban future Scenarios.
Considering the major global and national level economic changes, Surat may face any one of the above scenarios. The population projections may not represent the reality if the economic growth slows down or the social cohesion breaks down, thereby reducing the resilience of the society.
The climate change is likely to roll out impacting various sectors and sections of population differentially over coming decades. Issues of extreme temperatures, loods and water scarcity may impact the city, even though currently the city only faces the lood risk. With the increasing competition over water resources from Ukai dam, the conlicts over water across sectors can be expected in the coming decades, especially from growing industry and energy sector.
4.6 Climate ChaNGe imPaCts
4.6.1 severe rainfall events
The rainfall increase in the Tapi catchment and Surat city is a matter of concern. This situation may be further aggravated with the possibility of high variation in the distribution of rainfall (longer dry spells and increased intensity of and frequency of severe events). Even though the lood event lasts for two to three days, the city and its economy takes several months to recover. The loods are also expected to impact the Hazira industrial area, despite land illing and other protective measures taken by the Hazira industrial area.
The Maharashtra state (neighboring state) is planning to build dams upstream, which may buffer peak discharges to certain extent. However, the maximum storage that can be added is small given the forest and
hilly areas upstream. Conversely, with the increase of siltation in Ukai dam, the carrying capacity and the lood control capacity is likely to be reduced. The situation of looding due to peak discharges in to Ukai dam is highly likely. This calls for an Flood early warning system for Surat.
The lood damages also should be explored from the perspective of the changing economy and social cohesion. While the city may be able to recover within months in case the city’s economy is strong, conversely during economic downturns, the city may take much longer time to recover. Surat’s economy is still largely labour dependent and any disasters would lead to mass exodus, which would take many months to reverse as evidenced during the 1994 plague and 2006 loods. In such cases, the city may not be able to recover for long periods. Considering mobility of labour and growing alternate centres of opportunities for workers, the city has no option except reducing the lood risks with improved lood forecasting systems and more effective management of Ukai reservoir.
4.6.2 sea level rise
Surat has been experiencing some of the highest tides on record during past few years and SMC had to evacuate huts located at the edge of the creeks in 2008 and 2009. Since the high tide level is increasing, some of the already built up areas near the tidal creeks may also face the impacts of submergence as well as weakening foundations of multi-storied buildings due to ingress of corrosive sea water. Sea level rise is also likely to cause further erosion of the coastal area near Dumas included in the city area in 2006.
The coast is potentially high value property due to beach access, which may be developed as the city grows. There are already demands by various interest groups to build coastal erosion control structures, which if implemented can catalyse further real estate development in these high sea level rise risk areas.
4.6.3 temperature increase
Surat lies in high humidity coastal environment and summer maximum temperatures crosses 40ºC and night temperatures cross 25ºC. The traditional buildings were designed with suficient ventilation to reduce thermal discomfort. Along with high humidity, these ranges cause discomfort for people. The increase in thermal discomfort due to urban heat island effect