A synthesis report - indiA
Volume i
Prof Usha Raghupathi, National Institute of Urban Affairs Dr Umamaheshwaran Rajasekar, TARU Leading Edge Anup Karanth, TARU Leading Edge
Published by:
TARU Leading Edge Pvt. Ltd.
424, Qutab Plaza, DLF City phase I, Gurgaon - 122002, Haryana State INDIA
Tel: +91 124 2560424 Fax: +91 124 2560421 Email: [email protected] Web: www.taru.co.in
The views expressed in this technical report do not necessarily represent those of the NIUA, TARU, Rockefeller Foundation or ACCCRN partners.
November, 2013 Suported by
Prepared by
Prof Usha Raghupathi G K Bhat
Dr Umamaheshwaran Rajasekar
Anup Karanth
A synthesis report - indiA
1.1 Background 2
1.2 Audience 3
1.3 Report Presentation 3
1.4 Use of Terms 4
of Indian cities 7
2.2.2 Urban Sprawls 10
2.3 Urban Poverty 11
2.4 Current Challenges of
Urban India 13
2.4.1 Housing 13
2.4.2 Lack of Infrastructure 14 2.4.3 Water Supply Services 15 2.4.4 Sewerage and Sanitation
Services 17
2.4.5 Electricity 18
2.5 Urban Governance 18
2.5.1 Urban Governance in India 18 2.5.2 Challenges for Urban
Governance in Context
of Access to services 20 2.6 Legacy-Current context-
Future Options 22
2.7 Urban Growth and Increasing
Risk Proile 26
2.8 Urban Climate Change Risk 26
4
Urban Projection 32
3.1.3 HPEC Report 2011-
Urban Infrastructure 33
3.2 Future Resource Challenges 35
3.3 Infrastructure Challenges 37
3.4 Governance Issues 38
CLIMATE CHANGE
CHALLENGES
39
4.1 Historic Data of Temperature
Changes 40 4.1.1 Downscaled Climate variability and
change analysis 40
4.2 Extreme Event Analysis 41
4.3 Uncertainties 42
4.4 Climate Change Prognosis
for India 42
4.5 Urbanisation and Climate Change Impacts 42 4.5.1 Floods and Coastal Inundation
Issues 43 4.5.2 Temperature increase, urban heat
island effects and energy use 43 4.5.3 Urban Growth and Climate Change
Scenarios for master planning 43
Figure 2.5: Drinking water and sanitation arrangements:
Urban India 2011 15
Figure 2.6: Per capita water availability in 63 Indian
cities after deducting UFW 16
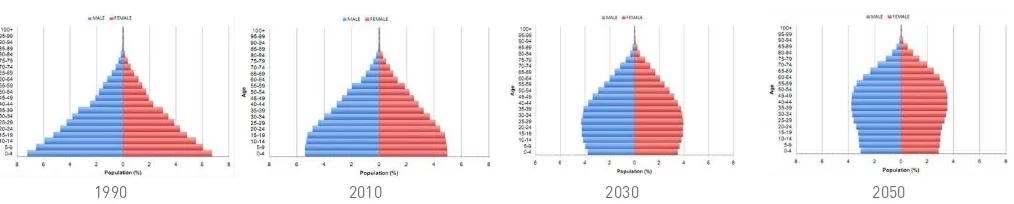
Figure 3.1: Age structure in the Indian Demography
(1990 to 2050) 30
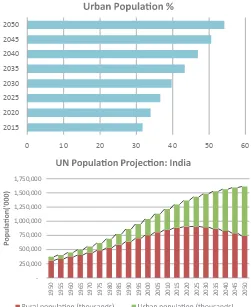
Figure 3.2: UN Population highlights 31
Figure 3.3: Annual rainfall across million plus cities 32
Figure 3.4: Change in Share of employment and GDP
by sector over 1972-2004 33
Figure 3.5: Urban infrastructure investment requirement estimates (2012-2030) HPEC 34
Figure 3.6: Water Requirements for Various Sectors in
2025 and 2050 36
Figure 3.7: Components of O&M costs 36
Figure 3.8: Distance from sources 37
List of Tables
Table 2.1: Percentage distribution of slums by location of slums (All India) 12
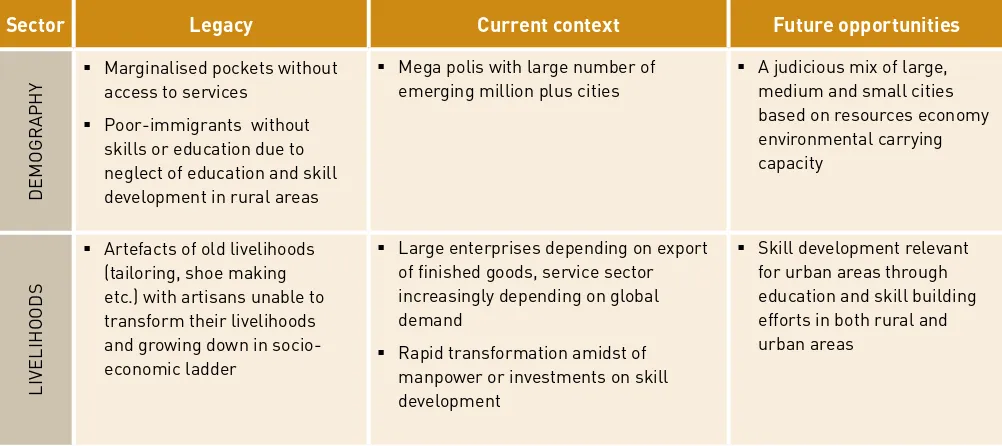
Table 2.2: Legacy-Current Context and future options
across sectors 22
Table 3.1: Access to Drinking water from various
sources in urban areas 36
Table 4.1: Name of Research Institute, Model
ABoUt
this
1.1 BACKGROUND
The cities across the developing world are facing the challenges of rapid urbanization, growing poverty and climate change related risks. Most of the cities are already facing hydro-meteorological risks-both high intensity disasters like loods and cyclones as well as perpetual challenges like water scarcity and health. The developing countries have are still facing rapid population growth, resulting in reducing per capita natural resource availability (land, isheries, forests etc.). Rapid urbanization is creating point-sources of demands in already resource scarce areas (e.g. semi-arid regions). Also, the cities already facing resource and service inadequacy cannot take additional stress, without rising conlicts over services. High land prices have marginalized slum dwellers to high risk areas with inadequate and often unsafe lifeline services resulting in higher disaster and environmental health risks. Expansion of cities have resulted in ever increasing demands for land, water, food energy and other basic needs like housing and industrial goods to support the growing population. With limited investments available with the local bodies, most cities are unable to provide services to meet the existing and growing demands, where a signiicant section of the urban society lives in poor living conditions. Slums and low income settlements with limited or no access to lifeline services have increased the vulnerability of the poor arising out of any changes in the environment. The push migration from the rural hinterlands due to narrowing of livelihood base, ampliied by recurrent droughts and loods, further stresses the city’s lifeline infrastructure. The climate change is expected to exacerbate the risks in the infrastructure/resource deicit urban environments across the country.
Indian urban challenge can be analysed through framework of Legacy-Current context-Future issues. Legacy of very dense pockets of enclave villages and irregular settlements lacking basic infrastructure (e.g. roads, water supply, and sewerage), essential services, control over resources like water, land use and development control regulations are faced by almost every Indian city. Conlicting demands for sustaining population growth and need for industrial growth to sustain the economy are pressing current issues that need to be addressed in the context of emerging demands on sustaining the cities. These
past and current issues are resulting in vulnerability of signiicant proportion of urban population. Shrinkage of livelihood options in rural areas combined with low skill levels of people creates additional challenges of migration to the cities and urbanisation of poverty. While future technologies and emerging models of e-governance systems can be opportunities for change, the legacy and current context constrain realisation of these opportunities. Unbundling and understanding the interface between these three issues would be essential to explore options based on paradigms shift from the past legacies of unmet demands and institutions. Radical changes in the technologies, planning and governance paradigms would be essential to ensure universal and adequate access of services, reduction of vulnerability and improving resilience of Indian urban systems.
Increasing risk and growing exposure of poor can increase vulnerability of urban population, especially the poor. Climate change is likely to further amplify the hydro-meteorological risks, where increasing number of urban people in developing world are expected to be exposed to additional risks. These risks and impacts are likely to be differential, with some sections of population able to afford mitigative, coping and resilience measures, while the rest are exposed to higher risks with little or no protective measures. Considering growing size of vulnerable population and lag in infrastructure & services as well as erosion of formal protective mechanisms, the cities of developing world need to develop resilience at a much faster pace than the developed world. While proportion of poor is decreasing, the actual numbers are growing. The poor are already subjected to repeated daily stresses from limited access to lifeline infrastructure and services, thus requiring building on local knowledge based coping mechanisms that can be formalized and strengthened. Since the technical and inancial capacities of the cities are limited, the resilience building in these cities would require contextualized solutions.
applied across the cities-especially urban areas across the developing world. The ACCCRN network partners focus on developing city level climate resilience, while sharing and advocating the success stories and lessons to country, regional and global levels. This network aims to expand and deepen the base of urban climate change resilience practice that can be contextualised to other cities in the developing world.
In India, the ACCCRN Phase I (2008) identiied and shortlisted a set of three core cities for developing resilience strategies and demonstrate them. Surat, Indore and Gorakhpur were selected based on criteria of rapid urbanization, poverty and vulnerability to climate change impacts and interest to engage with ACCCRN. During the Phase II (2009-2010), the team worked with city level stakeholders to deepen the understanding of current city level risk and vulnerability, potential climate change impacts and possible impacts over different sectors. The city
stakeholders undertook several sector studies and pilot projects, which facilitated learning and capacity building of city stakeholders. This process led to development of city resilience strategies and action plans. The Phase III (2011-2014) focuses on implementation of urban resilience strategies through active participation of local partners in implementing demonstration projects and to disseminate the lessons and success stories with national and international partners. In addition a large number of cities are part of the replication efforts (of Bashirhat, Bhubaneswar, Gorakhpur, Indore, Jorhat, Leh, Mysore, Panaji, Saharsa, Shillong, Shimla, Surat and Guwahati).
1.2 AUDIENCE
This synthesis report forms deliverable of Asian Cities Climate Change Resilience Network (ACCCRN, www. acccrn.org) India Phase III. This is the irst synthesis report produced under ACCCRN India programme. It is intended mainly for urban local bodies, policy makers, business, community based organizations, individuals and researchers engaged in the subject of urban development and management, climate change and urban resilience.
1.3 REPORT PRESENTATION
ACCCRN works at the nexus of climate change, vulnerable and poor communities, and urbanization. ACCCRN programme through its collective knowledge and evidence pooling had built an emerging practice area of urban climate change resilience (UCCR). This synthesis report considers the effort undertaken in India during the last ive years and also showcases the evidence from cities involved in developing the City Resilience Strategy and practical interventions adopted to create urban resilience. Synthesis Report on ACCCRN India is brought out in two volumes. Volume 1 contains ive chapters. This chapter lays out a brief overview of the current urban situation and outline of the report. Continuing with the analysis of Urbanization - Poverty- Climate change challenges, the second chapter explains the urbanization trends in the country and prognosis. It explores the trends in terms of size and distribution of Indian cities and their expected expansion over coming decades. It explores the trends in terms of size and distribution of Indian cities and their expected expansion over coming decades. It also analyses the main challenges of urbanization including resources, governance, infrastructure and services situation and emerging challenges that cities will face in the future. The third chapter discusses the Future scenarios of urban growth and challenges. The Fourth chapter discusses on the vulnerability of Indian cities towards climate change. It gives an overview to the factor which increases the vulnerability of the cities for example poverty, gender, age composition and illiteracy. Beside this the chapter also discusses other factors like the soft nature of the state and behaviour aspects of the population which impact the vulnerability of the cities.
Volume 2 of the Synthesis Report is a collection of City Resilience Strategy (CRS) from core ACCCRN Cities (Gorakhpur, Indore, Surat) and one Replication City (Guwahati). The information to Volume 2 is provided by key ACCCRN partners engaged with the local government and city institutions in the development of CRS. The subsequent version of the synthesis report will bring in information from cities of Bashirhat, Bhubaneswar, Jorhat, Leh, Mysore, Panaji, Saharsa, Shillong and Shimla.
1.4 USE OF TERMS
Climate change resilience is the capacity of an individual, community, or institution to dynamically and effectively respond to shifting climate impact circumstances while continuing to function at an acceptable level. Simply, it is the ability to survive, recover from, and even thrive in changing climatic conditions. ACCCRN Website, www.acccrn.org
Resilience is the ability of a social or ecological system to absorb disturbances while retaining the same basic structure and ways of functioning, the capacity for self-organisation, and the capacity to adapt to stress and change. IPCC, Fourth Assessment Report, 2007. Urban Climate Change Resilience (UCCR) is relatively new and constantly evolving. UCCR brings together researches, policy makers, practitioners and community leaders from multiple disciplines and backgrounds including climate science,
development agencies, organizations working in hazard mitigation, disaster risk reduction and emergency relief, global donors, and institutions focusing on globalization, urbanization and sustainability. One of the distinguishing features of UCCR is its focus on systems. Cities depend on both natural ecosystems and engineered services, draw on distant resources as well as utilizing local resources to meet basic needs, and function through complex social and governance systems which can result in the marginalization and increased vulnerability of groups within the community. Cities form a complex web of inter-dependencies, whereby the functioning of the whole system relies on the effective functioning of its constituent parts. ACCCRN Website, www.acccrn.org
UrBAnisAtion
And risK
proFiLe
2.1 CITIES, RESOURCE BASE AND RISKS
Most of the Indian cites have evolved from small towns formed along river banks, trade centers, administrative centers and army cantonments. At the time of their formation, they were reliant on local sources of water, since pumping and long distance water conveyance technologies did not exist. Therefore, access to year round water sources was one of the main considerations for the formation and survival of these towns. The rise and fall of cities were often linked with water resources ever since Indus valley civilization. A majority of those towns are river bank or coastal towns. Indian cities present diversity in hydrological situations ranging from river banks (e.g. Delhi, Kanpur, Kolkata, Cuttack) to upper catchments/small river basins in semi-arid regions (e.g. Bangalore, Hyderabad, Indore). Water resource base of the large riparian cities has been exploited upstream, especially over last two centuries of intense development of irrigation infrastructure. This has led to saline water intrusion in to the local sources in many coastal cities especially Calicut, Mangalore and Surat. With agricultural
development upstream and the city growth, competition and conlict over traditional sources of water, large cities like Delhi, Agra and Bangalore have been impacted.
The cities across India are already facing insuficient access to lifeline services and infrastructure to cater the existing population. Both urban population growth (31% over 2001-2011) as well as change in lifestyles has led to increase in total water demands. The decadal gross water demand growth can be more than 50%, considering both the factors. For large cities, additional demand implies tapping distant water sources, which need large investments or unsustainable levels of ground water withdrawal as the case of Indore and Bangalore.
India has renewable resource availability of only about 1,550 cubic meters (cum)/capita/year with 30.5% accounted by resources lowing from outside the country. India is already a water deicit country with the total renewable water resources of about 1,907 cu.km. per year, as against a minimum need of about 4,000 cum/capita/year of water required for all uses1. (FAO,
2010). With the expansion of cities and water demands, new water infrastructure depending on distant sources 1 It includes water required for agriculture and industrial production, drinking water and environmental services to support a person.
are necessary to enable cities to expand to sizes beyond their local resource base as discussed previously. The quality of life has suffered in the urban centres due to the cities’ inability to meet growing demands of lifeline services as well as overcrowding.
Although small towns are numerous, the 400 odd cities harbouring about two-third of India’s urban population(offering diverse employment opportunities and means of livelihood) are the main centres of attraction for migration, despite the fact that physical infrastructure in terms of housing, drinking water supply, drainage are inadequate and unreliable. Therefore, quality of life has suffered in these urban centres not only due to migration, but more so due to expanding gap between the demand and supply of necessary services and other infrastructure facilities. Unchecked land prices and unaffordable housing forced the poor to search for informal solutions resulting in mushrooming of slums and squatter settlements (Mundu & Bhagat 2008). Slums usually develop to meet these unmet demands on peripheral and marginal lands on the outskirts of city, on hill slopes and low lying areas, drainage lines, and also on the land where the owners have either no control or ownership is uncertain and not contested.
Growing trafic and congestion is another major challenge arising out of high density and preference of private vehicles for commuting. As reported earlier, neglect of public transport over decades has given rise to this situation along with formal and informal Para-transit system trying to ill the gap. The cities have resorted to knee jerk actions of building lyovers, ring roads and bypasses, without paradigm shift towards better public transport systems. Only recently, some of the cities have chosen to opt for metro railway systems or Bus Rapid transport systems. With already congested narrow-road dominant central business districts, it would be a challenge to extend these public transport systems to bring about a radical shift to public transport.
the cities have expanded from one bank to both banks of rivers, thereby constricting the lood plains. As the city expands, the demand for high value land within and periphery leads to blockage of natural drainage, encroachment of lood buffers (reservoirs and tanks) by landills, narrowing of river channels and lood plains. These encroachments increase the lood risks of the cities. The haphazard peripheral growth led by the private sector and individual houses by multiple land owners further add to the complexity of the challenge. As the cities expand by multitude of land developers, natural drainage is often blocked and increase in impervious areas as well as illing of lakes have increased the pluvial lood risks.
Growing gap between master plan projections and actual expansion of the cities can lead to increased risks of loods, water logging as well as water scarcities in many cities over coming decades even without any signiicant change in precipitation pattern. The recurrent loods and water scarcities in cities like Delhi, Ahmedabad, Vadodara, Pune, Surat, Cuttack, and Kolkata highlight this challenge. While urban planners are expected to incorporate these issues in developing expansion plans and master plans, in practice the hydrological issues are not incorporated in master plans.
2.2 DEMOGRAPHIC PROFILE
For the irst time since 1921, increase in India’s urban population was more than the rural population during 2001-2011. At 833.1 million, India’s rural population today is 90.6 million more than 2001, while the urban population is 91 million higher. The national decadal population growth rate was 18%, with the urban growth rate of 32% and rural growth rate was 12%. The Urban Rural Growth Differential2 (URGD) is a rough and ready
index of the extent of rural-urban migrations, which is 19.8% for 2011 Census, which is the highest in 30 years. Decreasing per capita agricultural land as well as agrarian crisis are some of the factors driving push migration.
The birth rate in India was 20.97 births/1,000 persons, whereas in urban areas it is 18.5 (Census 2011). The population, however, continues to grow, as the decline in the birth rate is not as rapid as the decline in the 2 Urban Rural Growth Differential is the difference between the rates at which rural and urban populations expanded in each decade
death rate. Beside the natural growth of the city, other factors like migration, net reclassiication and expansion of the city boundaries also affect the overall population growth.
Natural growth, migration, expansion of the boundaries and net reclassiication has contributed to the urban population growth. In 2011, almost one fourth of the urban population growth was accounted by net rural-urban migration to the cities. With the expansion of boundaries from peripheral rural to urban areas is also taken in to account, the proportion of growth increased to 40% of the total urban growth (2001-2011). With decreasing per capita land and lack of alternate livelihood opportunities, rural to city migration is likely to increase over coming decades.
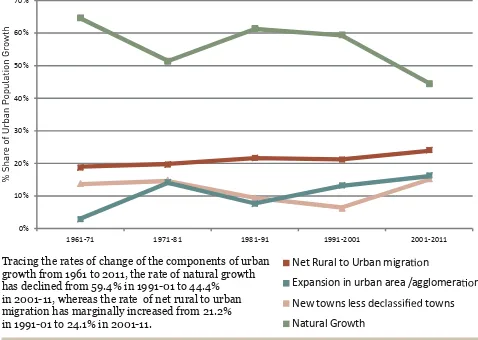
Figure 2.1: Source of increase in urban population (in %)
Source: IIHS Analysis based on Census of India, 2011; NSS 64th Round; Sivaramakrishnan, Kundu and Singh (2005) SRS, Vol.45 No.1, 2011
0%
1961-71 1971-81 1981-91 1991-2001 2001-2011
Net Rural to Urban migra n
Expansion in urban area / agglomera n
New towns less de towns
Natural Growth
Tracing the rates of change of the components of urban growth from 1961 to 2011, the rate of natural growth has declined from 59.4% in 1991-01 to 44.4% in 2001-11, whereas the rate of net rural to urban migration has marginally increased from 21.2% in 1991-01 to 24.1% in 2001-11.
Source: IIHS 2011
2.2.1 Current growth scenario of Indian cities
India shows a lag in urbanization compared to other developing countries, especially across Asia. Total population of India has increased from 238.4 million in 1901 to 1.210 billion in 2011 (5 times), while the urban population has increased from 25.8 million to 377 million (14 times). The urban agglomerations (UA)/ towns have increased from 5,161 in 2001 to 7,935 in 2011–a rough rate of ive new towns per week for 10 years running. The total includes 4,041 statutory towns and 3894 Census towns3. The following Figure 2.2
presents the distribution of urban population across different size classes of cities.
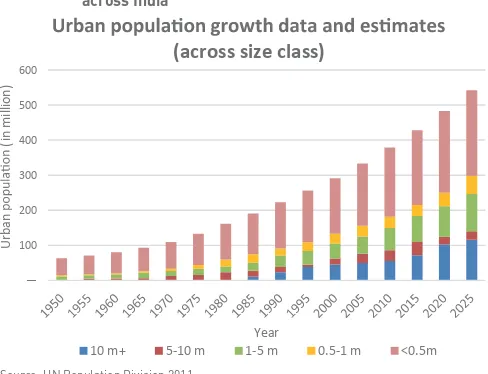
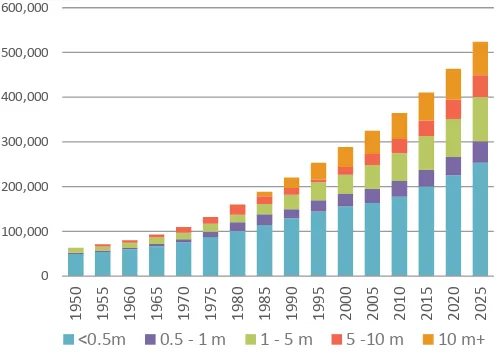
Figure 2.2: Population growth trend and projection by size class across India
(across size class)
10 m+ 5-10 m 1-5 m 0.5-1 m <0.5m
Source: UN Population Division 2011
In 2011, there were 468 Class I cities (population >0.1 million). These cities are expected to drive the urbanization process in the coming decades. Out of these, about 160.7 million persons (or 42.6% of the urban population) live in 53 Million plus UAs/Cities. 18 new UAs/Towns have been added to million plus city list over last decade.
There are three mega cities, Greater Mumbai UA (18.4 million), Delhi UA (16.3 million) and Kolkata UA (14.1 million), accounting more than 12 % of urban population as per Census 2011 or 16% as per UN projections (UN 2012). These trends show growing importance of larger cities in driving the urbanization. These trends also imply that the large cities will demand very high amounts of water and food, which cannot be met by local resources, especially in
semiarid and dry regions of the country. With the gross population densities of more than 10,000 persons per sq.km. (most cities of >5 million population) the annual demand for domestic water alone can be as high as 0.5 million cum/sq.km. or 500 mm equivalent of rainfall. In 2011, the top 10 cities of India accounted for almost 8% of India’s total population and produced 15% of total economic output but occupied only 0.1% of the total land area. Similarly, the 53 million plus cities account for 13% of the population produce about a third of total economic output and occupies only 0.2% of the land. The top 100 cities, account for 16% of the population,
produce 43% of India’s total output and occupy 0.26% of the land (IIHS 2011).
Figure 2.3: Top 10 cities of the word with highest density (per sq.km.)
Source: City mayors statistics (2007)
India has 3 out of 10 highest density cities of the world with two Indian mega cities Mumbai (29,650) and Kolkata (23,900) occupying irst two ranks. Chennai is ranked as eighth city with highest population density of 14,350 people per sq.km. In India, Delhi (11,050) is the fourth most densely populated city, followed by Bangalore (10,100) and Hyderabad (9,100). With low FSI limits (mostly less than 2) in most cities, this means a combination of very low allocation of land for public use (roads, parks etc.) and low per capita residential loor areas and dominance of low rise buildings. With nearly 93 million people (MHUPA 2011b) living in slums (with mostly overcrowded single or two storied informal buildings) and an equal amount of persons living in low income semi-formal settlements, the urban population densities are no doubt very high, despite having low FSI limits.
Even though urban planning has changed relatively little in most countries since its emergence about 100 years ago, a number of countries have adopted measures like strategic spatial planning, use of spatial planning to integrate public-sector functions, new land regularization and management approaches, participatory processes and partnerships at the neighbourhood level, and planning for new and more sustainable spatial forms such as compact cities and new urbanism. However, in many developing countries, older forms of master planning have persisted. Here, the most obvious problem with this approach is that it has failed to accommodate the ways of life of the majority of inhabitants in rapidly growing and largely poor and informal cities, and has oten directly contributed to social and spatial marginalization.
including roads (including trafic planning, and street congestion), electricity, water supply and sewerage. Universal access as well as reliability of lifeline services like energy and water would be critical for transformation to a compact city. With densities of more than 10,000 persons per sq.km., installing and maintenance of new higher capacity networks and resources would be challenging in overcrowded, dense built environments. In an energy and water hungry country, with little control over population growth and densities, compact cities can result in increasing risks of lifeline services failures as evidenced by routine power cuts, water supply disruptions and trafic jams even in low rise high density environments.
In developing countries, where there is an enormous range of people, cultures and economies, the size of the problem (explosive urbanisation) is immense and growing fast. Nevertheless, there are a number of points of comparison. Compactness appears to be an aspiration and a hoped-for solution to the problems of the explosive growth of urban areas, and it has some meaning when applied to the intensiication of many sub-centres within a metropolitan region. Mixed use does not feature as an issue, as the vitality exists in abundance and problems are more likely to arise from there being too much rather than too little of it.
Good public transport exists, and in some cases is better than that found in developed countries, although this is the exception rather than the rule. Even so, public transport use is generally much higher in developing countries, but this is more usually the result of low per capita incomes rather than any explicit sustainability policy. he ease with which traic becomes saturated is a function of dense urban forms, and these in turn become highly polluted. Pollution is a problem even in rich cities like Hong Kong, and while ‘clean technology’ may help its reduction, it would give no alleviation to congestion. Concerning the other characteristics, neither environmental controls nor urban management measure up to those found in developed countries. In all but a few countries, local government controls are weak.
- Jenks ( 2000)
In India, one of the major issues has been the soft state and weak governance with limited control of ULBs over the urban growth. The existing rules are often anachronistic to the emerging needs and major shifts in paradigms and policies (e.g. from LRHD to Compact city) would be time consuming and require cooperation
Low Rise High Density Paradigm: During the 1970’s and 1980’s “preventing congestion” was the conceptual basis of urban planning that shaped most Indian cities. The problems of high private vehicle ownership due
to longer commuting distances or trafic jams were
still unknown. The urban development debate in India evolved from low-rise high density (LRHD) built-form and single use zoning of 1980s to compact form
with high density, mixed land use and eficient public
transport planning of the proposed future.
Compact city paradigm: The National Mission on Sustainable Habitat has recently initiated compact city debate in the context of urban transport. Unfortunately, with fragmented and overlapping roles of different stakeholders in the urban development sector, implementation of compact city paradigm may take many years to be implemented. Examples of New York and Hong Kong are often used to drive the compact city argument for better public transport with high density use. Unfortunately these debates have ignored the fact that the Indian cities are some of the densest cities in the world, even with low FSIs and low loor area per persons no more increase is possible without severe congestion of streets and increasing the vulnerability of population to vagaries of unreliable lifeline service delivery.
The City master plans did not integrate landuse with spaces for transportation, power and communication networks. This has resulted in major challenges to introduce public transport with dedicated corridors. Considerable retroitting as well as land acquisition etc. is necessary to commission Bus Raid transport systems in the cities recently. Their success would depend on actual availability of free road spaces for public transport.
The major challenges to shift towards compact cities would include universal coverage of lifeline services and round the clock availability of energy and water services and shift to public transport on a large scale. With low per capita built spaces and overcrowding on one hand and old and decrepit lifeline infrastructure networks(especially underground water supply and sewerage networks), further increasing the FSI would subject these services to additional loads and possible increase in frequency of breakdowns. This would make larger proportion of the population vulnerable.
between different departments within the ULBs with fragmented and overlapping roles.
Major changes in land use or decongestion in Indian cities are often unpopular causing “unresolvable conlicts,” especially in core areas, where land prices and stakes are too high. Elected bodies are constrained by public opinion to introduce such measures. Major disasters provide window of opportunities as indicated by partial decongestion of Surat after plague of 1994. Most of the cities miss such rare opportunities as indicated by inaction followed by earthquakes, recurrent loods in some of the major cities across the country. Unless suficient land areas are allocated for lifeline networks and public spaces, simply increasing FSI is only going to complicate issues of street
congestion, trafic jams and power cuts in high energy dependant built spaces.
The debate on urban development is likely to lead to a shift towards high FSI led growth over low public space/ narrow road environments without suficient dedicated spaces allocated for public transport or other common facilities. Even though compact city paradigm has come to the forefront, concrete action is yet to take root under the prevailing political and policy context. More intense planning efforts are necessary to understand available options for transforming our cities from low-rise, high-density- low public space areas (roads, parks etc.) to more energy, land and water eficient urban systems.
2.2.2 Urban sprawls
Beside large population and high urban density, urban outgrowth/urban sprawl is another characteristic of Indian cities today. Recently, the urban sprawls have given way to isolated multi-storied gated communities due to high land prices. Cities has the tendency to grow outwards of their traditional boundaries due to congestion and high land prices. The total number of urban Agglomerations/Towns is 6,166 in the country (Census 2011). During 2001-2011, number of urban agglomerations has increased from 385 to 468 comprising of more than 900 peri-urban outgrowths with limited or negligible access to lifeline urban services of the main city. The number of towns has increased by 2,774 during 2001-11 period.
Most of the highways have emerged as Desakota regions; some of those regions are likely to form new
urban areas over coming decades. This process is also catalysed by new highway/ freight and industrial corridors being planned across the country.
LAND REGULATIONS AND URBAN SPRAWL
“Combined efect of multiple layers of poorly conceived central, state and municipal regulations contribute to an artiicial urban land shortage. As a result urban land prices are abnormally high in relation to India’s household income, and households consume less loor space than they could aford if the regulatory environment were reformed. In addition, some regulations have a negative impact on the spatial structure of cities. By unreasonably reducing the amount of loor space that can be built in centrally located areas, and by making land recycling diicult, some regulations tend to “push” urban development toward the periphery. As a result, commuting trips become longer, public transport become diicult to operate and urban infrastructure has to be extended further than what would have been the case if land supply had been unconstrained”
- Bertaud, 2002
Since Independence, several urban development authorities (UDA) were set up by the state governments for overseeing and sanctioning construction and infrastructure development (roads, water supply, sewerage, storm water drainage, street lights etc.) and build townships in the suburbs of the respective cities. The UDAs are responsible for land use change from agricultural/other uses to urban uses and they derive most of their incomes from sale of developed lands and buildings. In most cases, rural settlements engulfed by the cities (enclave villages) are left to densify themselves within the larger developed area leading to a mix of chaotic pockets amidst of planned development. Unfortunately, many of these UDAs act as real estate developers and hand over the partially developed areas with inadequate services to the ULBs. The ULBs are then saddled with the additional responsibilities of rebuilding infrastructure and augmentation of services. Urban sprawls and spatial mismatch are result of intensive development in the periphery, especially newly areas developed by the service sector industries.
Another reason for the increasing urban sprawl is blurred rural buffers and formation of Desakota
of corridors, the nearby villages and hamlets are getting connected to the cities and are becoming part of the growing city as people move daily for work from these areas. Also, changing livelihood patterns (from primary activities to secondary and tertiary activities) in large villages lead to formation of towns in situ, and emergence of new unplanned development in these new towns driven by market forces.
Urban sprawls are expensive to live in due to high capital costs of basic infrastructure as well a high recurrent costs of service delivery and transport due to long distance from the core city. They also tend to form exclusive gated cities predominantly owned by upper socio-economic classes. They consume large tracts of land, often very good quality agricultural lands and loodplains causing additional risks of looding. Also they become high fossil fuel consumers due to distances from the main business districts and proliferation of private vehicle ownership. Also, with poor infrastructure and services, these areas mostly depend on ground water and lack of sewerage, storm water drainage and solid waste disposal results in contamination of surface water bodies and aquifers. Since the real estate developers have no long term stakes, the buyers of the developed and land and buildings or the ULBs end up retroitting infrastructure and services as the city limits expand.
2.3 URBAN POVERTy
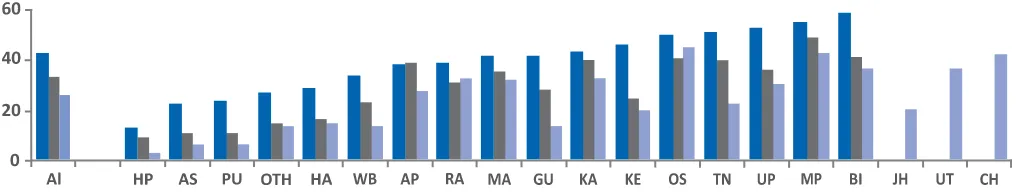
The poverty estimates are some of the most
contentious issues in India. Earlier, India used to deine the poverty line based on a method deined by a task
force in 1979. It was based on expenditure for buying food worth 2,400 calories in rural areas and 2,100 calories in urban areas. The World Bank’s deinition of the poverty line for under developed countries is US$ 1/day/person (Rs. 60 at current exchange rate) or about Rs. 21,900/yr).As per this deinition, more than 75% of all Indians are probably, below the poverty line (Wakeupcall website).
In 2011, the Suresh Tendulkar Committee deined the poverty line on the basis of monthly spending on food, education, health, electricity and transport. According to this estimate, a person who spends Rs. 27.2 in rural areas and Rs. 33.3 in urban areas a day are deined as living below the poverty line. The provisional results of NSSO 68th round livelihood surveys indicate that the bottom 10% of the urban households have daily per capita expenditure of less than Rs. 23.40 only. This is less than 0.5 USD/capita/day (Moneylife website). Other indicators like accessibility of lifeline services are equally relevant for delineating poor in urban context, since lack of access of these services severely handicaps the households to pursue their livelihoods. The poverty status across states and years is presented in Figure 2.4 (World Bank, 2011). In addition to slum dwellers with lack of access to basic services, at least an equal number of low income socio-economic class exists in most of the urban areas. These communities have poor access to most urban services due to marginalization by the rest of the socio-economic groups and neglect by the service providers. As they are unlikely to have access to lifelines services like water supply, they are unable to get beneit to subsidies on these services and forced to purchase water and other services at market prices or more.
In most cities of India, urban poor and slum dwellers who constitute about 25% of the city population occupy not more than 3-5% of city land space (MoHUPA, 2011b). Out of a total of 78.9 million urban households, 13.7 million were slum dwellers (17%) in 2011 (Census 2011). About 38% of the slum households were reported 46 Million plus Cities (Census 2011). Oficial poverty rates in large cities (with population of one million or more) are dramatically lower than that in small and medium towns.
In 2009, there were a total of 48,994 slums reported from across the country (NSSO 2009). Out of them 50.6% were notiied slums and rest were categorized as non-notiied slums. The 2011 Census categorised slums into Notiied (37,072 numbers), Recognised (30846) and Identiied (40,309) categories.
Informal sector
Seasonal labour demand (especially in single crop areas) and low wages in rural areas creates push factors while year round labour demand and better wages in cities creates pull factors leading to excess supplies of labour in the urban areas. With few relevant skills or education, a large section of rural to urban migrants have no option except to work in informal sector. In the face of a high natural growth of population, rural-urban migration aggravates the situation of excess supplies of labour in the urban areas. Within the urban informal sector push migration tends to reduce the level of earnings and get manifested in a high incidence of urban poverty. Thus in the process rural poverty gets transformed into urban poverty – the phenomenon is also described as ‘urbanisation of poverty (Mitra & Murayama, 2008). Construction and services (Transport driver, plumbers, domestic help, small stores etc.) in India is mostly informal. India has a large informal economy, with about half of its GDP estimated to be informal, and 84% of non-agricultural workers work informally (Credit Suisse 2013).
The income instability in informal sector increases the vulnerability of the poor to disasters. Also, poor accessibility to lifeline services add additional burden of lost time and money to access water, electricity and other basic services.
Location and differential exposure: Since the poor cannot afford to buy land or houses due to high costs, they settle mostly in uncontested areas like river
and gully banks, adjacent to railway lines and other unoccupied government/public lands. These are generally higher risk areas and often unsuitable for permanent housing.
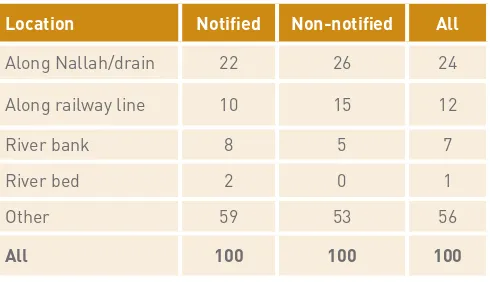
More than 40% the slums are located along Nallahs/ drains, along railway lines, on river banks, river beds, and other areas. An estimated 24% of all slums were located along Nallahs and drains and 12% along railway lines. About 22% of slums were located on the fringe or border area of towns and 78% in other areas (NSSO 2009b).
Table 2.1: Percentage distribution of slums by location of slums (All India)
Location Notiied Non-notiied All
Along Nallah/drain 22 26 24
Along railway line 10 15 12
River bank 8 5 7
River bed 2 0 1
Other 59 53 56
All 100 100 100
Source: NSSO 2010b
Being located in high risk areas, the slums are naturally more exposed to water logging and looding. About 48% of the slums were usually affected by waterlogging during monsoon with following variations in waterlogging:
32% of slums reporting waterlogging inside of slum as well as approach road,
7% reporting only slum getting waterlogged and not the approach road,
9% of slums where only the approach road was waterlogged in the monsoon.
2.4 CURRENT CHALLENGES OF URBAN
INDIA
2.4.1 Housing
As per Census of India, 2001, 52.4 million people lived in slums in 1,743 towns which constitute 23.5% of the population of these towns. The Technical Group on the Estimation of Housing Shortage projected the total shortage of dwelling units in urban areas in 2007 to be 24.71 million units and the shortage during the plan period (2007-12) including the backlog is estimated to be 26.53 million of which 99% pertains to the EWS & LIG segments of the urban population (MoUD, 2010). It indicates unmet demand for poor housing, which is largely due to inadequate/ inappropriate land use and building regulatory regime and lack of inclusion of economically and socially weaker sections in urban planning. On the other hand, there are signiicant number of middle income and high income residential units lying vacant or unsold in most cities. This in turn creates distorted land markets and very high cost of housing due to high land costs. Uncontrolled land prices and unaffordable housing in cities are some of the most pressing issues that have deied solution so far. With housing costs unaffordable, poor are forced to search for informal solutions resulting in mushrooming of slums and squatter settlements.
Gross densities in Mumbai (29,650 persons/sq. km.) and Kolkata (23,900 persons/sq.km.) with medium rise buildings dominating these cities indicate very low per capita loor area for the residents. The average per capita loor area in urban India during 2008-09 was 9.8 sq.m, while the lowest MPCE quintile having only 4.5 sq.m. About 8 percent of the total households live in Semi-Pucca or Kuchha houses. Only about 24% of the urban households lived in lats, while 58% lived in individual houses, rest in other types of houses (NSSO, 2010).
The FSI limits prevented raising the number of loors under the LRHD paradigm and now the city planners are increasingly debating about compact cities and multi-modal urban regions. As per the debate for compact cities, they are preferred due to lower costs of infrastructure and services (public transport, water supply and sewerage electricity, communication etc.). Poor public transport has resulted people opting for private transport, which has led to overcrowding of road network. High cost of extending infrastructure and
services, transport congestion and land scarcity are some of the reasons for compact city debate as of now (Jenks& Dempsey 2005), (Chattopadhyay, 2007).
CHALLENGES AND BENEFITS AND OF HIGHER FSI IN CENTRAL BUSINESS DISTRICTS
“A higher FSI would require a better performing infrastructure. However, coupling impact fees with an increased FSI could generate the revenues needed to upgrade existing city services. his increased in FSI will result in higher land prices in the CBD but it will lower the price to property ratio. It will also tend to slightly lower the sale price of loor space in the area. Land prices in peripheral areas will tend to become lower. he economic gain to the city, in the long run will be extremely large. In addition, raising the FSI from 1 to 4 in the CBD alone will also reduce trip length, improve the eiciency of public transport and decrease air pollution.”
- Bertraud (1996)
However, with already high population densities, low per capita loor areas, uncertainties in quality of lifeline services, high rise building based townships are unlikely to be feasible or attractive unless major improvements are done in quality of infrastructure and services. The following Box presents the
uncertainties in power and water supply in Mumbai and Chandigarh as well as grid failure affecting nearly 600 million people. These issues can cripple high energy demanding compact cities for days together.
Fire at substation causes outage October 16, 2011
Express News Service: Mumbai, Mon Oct 17 2011, 03:11 hrs: South Mumbai sufered its worst power outage in a decade ater a ire at the BEST undertaking’s Backbay substation caused disruption in supply to areas including Colaba, Cufe Parade, Marine Drive and Navy Nagar for most of Sunday (16th Oct 2011). While supply to some areas resumed ater a few hours, parts of Colaba and Cufe Parade went without power for over 16 hour
Major buildings such as Maker Towers, Jalkiran, Sealord, Palm Spring and Cufe Castle had no power all day on Sunday, Padmakar, who lives in Jalkiran, added. “We pay the highest taxes, but we are still not getting electricity. I spoke to Mayor Shraddha Jadhav and requested her to start the supply as soon as possible.” (City population Website 2011)
Express News Service: Mumbai, Tue Oct 18 2011, 00:01 hrs: Parts of Cufe Parade and Navy Nagar had to go without electricity for the second day on Monday as the Brihanmumbai Electric Supply & Transport (BEST) undertaking could not completely ix the technical snag that had caused a major power outage in parts of south Mumbai on Sunday.
Express news services, 2011
Power & water cuts worsen winter woes
“Tue Dec 27 2011, 01:58 hrs: UT (Union Territory) facing 20-30% electricity shortage; power department may ix time of rotational cuts for industry; water crisis to continue for some days.
City residents are facing a tough winter this time. he electricity and water supply cuts that are being faced in Chandigarh during the winter season are likely to continue in the coming days. he rotational cuts in electricity supply are being faced as due to outage of central generation plants, the entitlement of power to the city has decreased. While rotational power cuts are faced in summers, the winter months used to be generally free from these”
Express News Service- Chandigarh
Peak power scarcity and two grid failures- July 2012
“To leave one in 20 people on the globe’s surface without electricity, that lifeblood of modern society, in the hairdryer heat of an Indian summer is unfortunate. To do it again to one in 12 of the world’s population a day later is an unpardonable carelessness” .
“Tuesday, 19 states and more than 600 million people spent hours without electricity in the world’s biggest blackout. he power outages are reportedly the result of northern states likes UP, Punjab and Haryana drawing more than their allotted share from supply grids (the states have denied the charge)”.
“he Northern power grid has been strained this summer as a weak monsoon meant farmers used pumps extensively to water their ields. But the dual blackouts this week also highlight the growing gap between the demand and supply of power. More than half of India’s power is generated using coal. Many plants are not able to deliver the sort of power they’re capable of generating because of a shortage of coal”
NDTV 2012
“It (Grid failure) occurred twice over period of two days and took more than 6 hours and afected railways, hospitals, water supply and other essential services across whole of North and East India. he urban areas are prone to such blackouts that can cripple life on a mass scale and would take several days to recover, if there are insuicient backup systems.”
he Guardian 2012
Multi-storeyed buildings dependent on electricity for lits, water supply and other services can face major problems for aged and physically challenged persons. he compact growth paradigm should be seen in the light of such vulnerabilities in lifeline services in energy and water hungry/deicit environments with uncertain quality of services.
2.4.2 Lack of infrastructure
The eficiency of any urban system depends on the availability of infrastructure and services to support its population. But almost all the Indian cities today are facing serious deiciencies in infrastructure and lifeline services today. None of the cities have been able provide universal access to lifeline services.
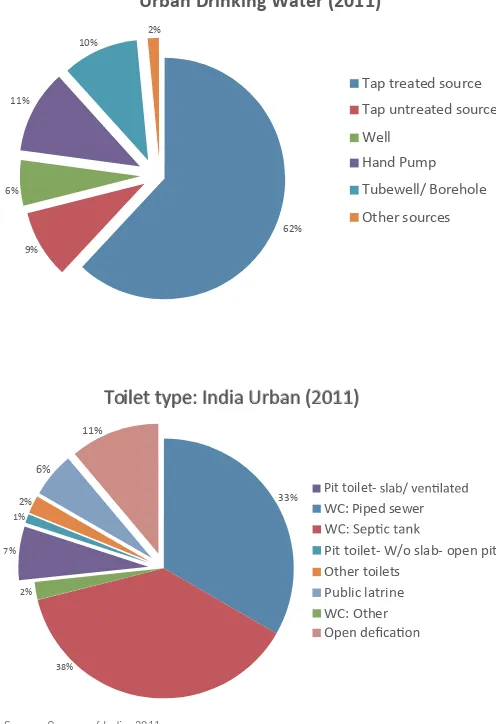
Figure 2.5: Drinking water and sanitation arrangements: Urban India 2011
Source: Census of India, 2011
Poor infrastructure-especially storm water drainage and sewerage, has resulted in increased risk of water logging and loods during rainy seasons while high leakage losses are exacerbating water scarcity conditions in most cities. These services are de-jure managed by the ULBs, but is often modiied by the residents through illegal connections as well as using sewerage system to drain waterlogged areas. Poorly managed sewerage systems also result in increased breeding of pests and disease vectors and occasional epidemics like malaria and Dengue, which have become more common in the recent years. With the sewerage systems not fully maintained, they become breeding areas for vectors like cockroaches and rats and support a growing pest control industry.
The urban growth over the current backlog of
infrastructure imposes major challenges to urban service delivery. Even though the leakage and unaccounted for water (UFW) is quite high in most cities, the ULBs are not exploring for soft options like leakage reduction and metering. Also, the lack of inancial, technical and managerial capacities of the ULBs to ill the growing gap in infrastructure and services further imposes very high burden on the citizens who have to invest on coping measures. India Infrastructure Report in 2006 noted that “Though there are vast improvements in basic amenities such as access to telecom services, electricity, water supply and sanitation, etc., the quality of basic services except that of telecom, is declining. In other words increasing coverage of infrastructure is not matched by improvement in the service levels. While there are more taps today in sheer number, there is less water once the taps are turned on” (3iNetwork 2006). This observation is still valid with inordinate delays and bottlenecks in building infrastructure and managing the services due to a variety of governance issues.
This current gap in urban infrastructure and services in cities is due to building up of lag due to historic lack of functional and inancial autonomy given to urban local bodies by the state governments. Only after the 74th Amendment was enacted, some degree of autonomy was delegated to the urban local bodies. The issue of autonomy and delegation of functions, funds and functionaries is still being addressed by enforcing reforms through conditionality to access the urban development funds under JNNURM programme. The thrust of the infrastructural development strategy is on generation of larger tax and non-tax revenue through internal sources, external borrowing, private-public partnerships, mobilizing funds through bonds and other innovative inancial instruments. The development plans and investments (e.g. JNNURM) over last decade have also focused on limited number of large cities with less focus on investments for small and medium towns.
2.4.3 Water Supply services
Inadequate coverage, intermittent supplies, low pressure and poor quality are some of the most prominent features of water supply in the cities of India. Even those covered by centralized water supply get intermittent supply with attendant problems of low pressures and contamination from sewerage network.
Toilet type: India Urban (2011)
33%
With rapid increase in urban population and continuing expansion of city limits, the challenge of delivering water in Indian cities is growing rapidly (MoUD 2011). Without suficient coping measures like storage tanks, pumps and water puriiers at household level, the vulnerability to waterborne diseases would remain high. The scarcity has given rise to a growing private sector of borewell drillers, tanker water suppliers and capital goods like PVC storage tanks, booster pumps and various types of water puriication systems. The city horizons are dominated by PVC storage tanks.
While the burden of unreliable water supply is felt by all sections of the society, it is more pronounced among the lower-income households and coping costs for water supply is highest for the urban poor. An intermittent water supply or collection of water from tankers/distant sources forces the poor to forgo work or lose part of their earnings. Alternatively, they also have to pay much higher cost for supply (often many times that of formal supply) from illegal or informal networks. Slums are often not taken into consideration for planning purposes and such habitations are typically bypassed at time of service expansion. Even if they are provided water supply, “elite capture” upstream leads to poor supplies to slums. The responsibility of ULBs with respect to slums is often restricted to supply through public stand posts or delivering water through ad-hoc arrangements such as water tankers. Since provision of municipal water connection may be seen as regularizing an illegal slum and leads to subsequent demand for tenure rights, ULBs and state governments have not extended themselves to provide house service connections in slums (Banerjee & Pratap 2011). On the other hand, water is used as a political tool, especially during elections.
Of the 27 Asian cities with populations of over a million, Chennai and Delhi are ranked as the worst performing metropolitan cities in terms of hours of water
availability per day, while Mumbai is ranked as second worst performer and Calcutta fourth worst. While the 2001 Census data shows that 90% of urban India has access to “safe drinking water”, only about 50% of this population was directly connected to the distribution system, and another 24% was accessing public
standpipes. By 2011, the percentage connected to some form of tap water supplies (treated or untreated) went up to 71% only.
The water availability is another major issue. With
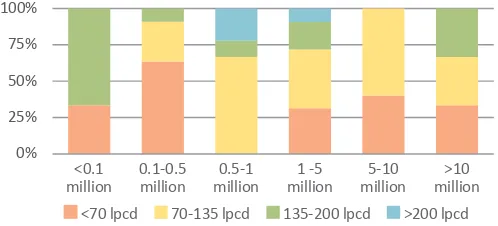
high leakages, the actual availability is much less than water supplied in to distribution network. The following Figure 2.6 presents the per capita treated water made available. About 77% of the total population of the 63 largest cities of India (also covered under JNNURM. 154 million population in 2011) gets less than 135 lpcd.
Figure 2.6: Per capita water availability in 63 Indian cities after deducting UFW
<70 lpcd 70-135 lpcd 135-200 lpcd >200 lpcd
Source: ADB 2007, Taru analysis, City population Website. City CDPs
With metering system abandoned and lat tariff system introduced over the decades, households and other users now have no incentives to control water use. In addition, lack of access to round the clock water supply has created several perverse incentives like elite capture, created water markets often relying on the existing system itself. The poor maintenance and inadequate replacement lead to technical losses in the distribution network. Errors in metering, unbilled water consumption and plain theft contribute to commercial losses. This leads to high levels of non-revenue water with no monitoring system in place and no incentive to reduce ineficiencies, the urban water scenario in India is one of poor service delivery, poor maintenance of physical systems, poor recovery of costs, and poor generation of revenues (MoUD 2011).
The cost is not computed or understood when cities map out the current and future water scenario. In most cases (as evident from the city development plans submitted to JNNURM for funding), cities emphasize the need to augment supply, without estimating what it will cost, in physical and inancial terms. Data suggests that most cities spend anywhere between 30-50
percent of their water supply accounts for electricity to pump water. As the distance increases, the cost of building and then maintaining the water pipeline and its distribution network also increases.
Since most of the distribution infrastructure is old and decrepit and also not maintained, water losses also increase. The end result is that the cost of water increases and the state may not able to subsidize the water supply. The situation is worse in the case of the poor who often have to spend a great deal of time and money to obtain water since they do not have house connections. Worse, as the city municipal water system collapses under the weight of under-recoveries, the rich move to private water sources like bottled water. The poor suffer the cost of poor health.
Coping measures: The coping measures include, increasing household level storage capacity to
overcome water supply uncertainties, use of household iltration equipment and reliance on bottled water for drinking and cooking. Almost all middle and upper class households have invested on these “mini-utilities” to overcome intermittent water supply and water quality issues. Also, since the new housing and other development projects have to internalize these costs, the additional costs have to be borne by the prospective buyers of houses. While the household level coping measures alleviate some of the issues, at city scale they often aggravate the problems due to elite capture. Improving the quality of services under the urban growth scenarios is the greatest challenge today and will continues over next several decades. If not addressed, these issues can lead to violent protests and law and order problems especially during peak scarcity periods. Such semi-organized protests have become common in cities facing water scarcity. Indore is one of the best examples where the city is facing water scarcities and organized protests leading to violence during every summer.
The public is willing to pay, provided reasonable services are made available to them and conidence building measures to overcome historic poor
performance is taken up and reasons for the water charges increases explained to them. For example, many ULBs have been able to simultaneously improve services and increase the water tariffs without
protests by the residents. The production costs in cities depending on distant sources are quite high and cross subsidies are given to enable domestic users to pay less than O&M costs. This system leads to commercial and industrial users shifting to other sources like groundwater, resulting in overall insuficient revenue to pay for the production costs.
Beside these challenges, cities are also facing threat from climate change. Increasing temperature, changing rainfall patterns, reducing natural resources, sea level rise and urban loods are imposing threat to infrastructure and livelihood of the urban citizens in India.
2.4.4 Sewerage and Sanitation services
The challenge of sanitation in Indian cities is acute. With very poor sewerage networks, a large number of the urban poor still depend on public toilets. Many public toilets have no water supply while the outlets of many others with water supply are not connected to the city’s sewerage system. Only 13.5 % of the sewage from Indian cities was treated the rest being let out untreated leading to pollution of land and water-bodies, while the treatment capacity installed was only 30%. The actual treatment was estimated at 72.2 % of the sewage collected which implies that only about 20% sewage generated was treated before disposal in Class I cities and Class II towns (CPCB, 2009).
Over 50 million people in urban India were estimated to be defecating in the open every day in 2008. None of the 423 cities studied by MoUD in 2008 were found to be ‘healthy’ and ‘clean’. The scoring done for these cities indicated that the Municipal Corporations of Chandigarh, Mysore, and Surat and the New Delhi Municipal Council were the only four ULBs that fared relatively better. Close to 190 cities in the study were rated to be in a state of emergency with respect to sanitation and public health (MoUD, 2008). Eradicating practices of manual scavenging, and mobilizing states and cities to accord sustained priority to urban sanitation (MoUD &MoRD, 2011)
to substantial loss of life and potential. It is estimated that one in every ten deaths in India is linked to poor sanitation and hygiene. Diarrhoea, a preventable disease, is the largest killer and accounts for every twentieth death. Around 450,000 deaths were linked to Diarrhoea alone in 2006, of which 88% were deaths of children below ive. Monetized economic losses linked to poor sanitation in 2006 was of the order of Rs.2.4 Lakh Crore (US$ 53.8 billion), or Rs.2,180 (US$ 48) per person. This works out to 6.4% of Gross Domestic Product (WSP, 2010).
The poor are worst affected by the poor water supply and sanitation services. Water related diseases result in disproportionately high medical expenses as well as infant mortality, which is compounded by the location of slums and poor settlements along the drainage lines, which receive the sewage from the rest of the city. Also, since poor predominantly depend on contaminated groundwater for water supplies without treatment, their vulnerability to water borne diseases are higher. They also suffer disproportionally during water crisis periods due to elite capture of centralised supplies.
2.4.5 Electricity
About 92% of the urban households used electricity for lighting, indicating that they have access to electricity (Census 2011). Also, National sample survey indicated that only about 86% of the lowest quintile of MPCE in urban households had access to electricity (NSSO, 2010). It is not the access, but frequent power cuts that is an issue in poorer sections of urban population. Also, a signiicant proportion of poor households have illegal connections, which pose revenue loss to the utilities. In 2008, lighting accounted for approximately 30 percent of total residential electricity use, followed by refrigerators, fans, electric water heaters and TVs. Approximately 4 percent of total residential electricity used is for standby power. In 2009, the urban India had estimated number of 179 million fans, 28.3 million air coolers and 4 million air conditioners. By 2030, the numbers of fans are expected to grow to 527 million fans, 107 million air coolers and about 40 million air conditioners (10 times). This would mean an increase of 4-6 times energy for space cooling alone. Appliance penetration, particularly of refrigerators and air conditioning units, is expected to be the main driver for the growth of residential energy demand by 2020 (World
Bank, 2008). Frequent power cuts and low quality of electricity occasional damage to the appliances that constrain the urban households.
2.5 URBAN GOVERNANCE
2.5.1 Urban Governance in India
History of Municipal Governance: Municipal Governance in India exists since 1687 with the formation of Madras Municipal Corporation and then Calcutta and Bombay Municipal Corporation in 1726. In early part of the nineteenth century almost all towns in India had experienced some form of municipal Governance. In 1882 Lord Ripon’s resolution of local self-government laid the democratic forms of municipal governance in India. In 1919 Government of India act incorporated the need of the resolution and the powers of democratically elected government were formulated. In 1935 Government of India act brought local government under the purview of the state or provincial government and speciic powers were given. (City managers Orissa, website 2012).
However, decentralization through the Constitution Seventy- fourth Amendment Act, 1992 (CAA) is considered to be a watershed development in urban policy initiatives in India. This is due to the fact that for the irst time in the history of urban governance, the municipal bodies were provided the Constitutional Status of the third tier of government. It is however, well known that the local governments in India are confronted with poor inances, state control over local governance and multiplicity of agencies- often with overlapping functional and geographical jurisdictions. With the increase in responsibilities as a result of the devolution of eighteen functions mentioned in the 12th Schedule of the 74th CAA, empowerment of the ULBs became inevitable. Moreover, the decline in the budgetary support from the higher tiers of Government, as a result of the second generation of reforms that aimed at reducing state iscal deicits, made devolution of powers to ULBs imperative. It took nearly two decades for decentralisation initiative after the second generation of reforms triggered during the early nineties (Bagchi & Chattopadhyay 2004). Still, some of the states have not devolved all the functions to the ULBs.
and urban service delivery mainly comprises the Constitutional provisions, State Municipal Laws, role of State Finance Commission (SFC) and Central Finance Commission (CFC), and status of ULBs and parastatals (DEA, 2009). Under the Seventh Schedule of the Constitution, the state government has the exclusive domain of the Local government, including the constitution and powers of municipal corporations, improvement trusts, district boards, mining settlement authorities and other local authorities for the purpose of local self-government or village administration. The statutory urban areas have one of the following administrative bodies:
Nagar Panchayats for areas in transition from a rural area to urban area;
Municipal Councils for smaller urban areas; Municipal Corporations for larger urban areas. The Census towns are administered by respective Panchayats, pending declaration as the statutory towns and formation of Municipalities. The 74th Constitutional Amendment Act (CAA) came into force in June, 1993, which sought to strengthen decentralization. The CAA devolved most of the urban management and planning functions to the ULBs (funds, functions and functionaries), but actual devolution across states show very high diversity. The CAA did not lay down revenue base for ULBs and the power to determine the revenue base continues to remain with state governments (DEA, 2009).
With the long history of state government’s control over ULBs, the ULBs are typically weak in terms of inances, technical capacity and functional autonomy is only slowly taking root. The fragmentation and duplication of roles between many agencies exists resulting often unmanageable situations. Despite the devolution of the functions, the problem continues and is often aggravates due to lack of capacity of ULBs and expansion of the cities. In most states, the infrastructure development is still being managed by the parastatal (Urban development Authorities) and state departments.
FRAGMENTED AND OVERLAPPING ROLES IN MANAGEMENT OF URBAN SERVICES
In Bengaluru city, the water supply and sewerage is managed by
the Bangalore Water Supply and Sewerage Board (a Parastatal Agency), while the storm water drainage is managed by the ULB. With the result, storm water and sewerage gets mixed up and causing the natural drainage carrying the sewerage during normal periods while during rainy seasons, the sewerage system overlows in to the streets with storm water. Also, this results in the sewage treatment plants not getting suicient load to treat waste water. Similar cases are reported from many other cities across the country.
- TARU analysis 1994
Institutional arrangements for water supply and sanitation in Indian cities vary greatly. Typically, a state-level agency is in-charge of planning and investment, while the local government is in-charge of operation and maintenance. Some of the largest cities have created municipal water and sanitation utilities (parastatal) that are legally and inancially separated from the local government. Tariffs are also set by state governments, which often subsidize operating costs. However, due to subsidization of services, the utilities generally remain weak in terms of inancial capacity. In spite of decentralization, ULBs remain dependent on capital subsidies and capital investments from the state governments.
Role of Parastatal Agencies
The extent of devolution of powers from the state governments across the country has been quite diverse and a variety of parastatal agencies formed earlier to develop and manage urban infrastructure and services still continue to play major role in infrastructure development and service delivery. They mainly include Urban Development Authorities, Water Supply and Sewerage Boards etc. formed at state or at city levels. Also the State Public Works Departments and Public Health Engineering Departments continue to provide urban services and are in-charge of capital works in many states.