Summary Collecting phenological data is a slow process. Although such data have been collected by a number of organi-zations, the reliability of these data is not known because the data-generating process cannot be repeated. No further obser-vations to improve the reliability can be obtained. However, the data usually consist of several overlapping observation series and this overlap can be utilized to construct a combined phe-nological time series and to improve its reliability. We have developed two techniques for selecting the most reliable obser-vations or observation series and thereby improve the reliability of the combined time series. Both techniques require that the method used to combine the separate phenological time series adjusts the individual series to eliminate possible systematic differences between them. A data set of bud burst in Betula pendula Roth collected in Central Finland during 1896--1955 was adjusted and used to test both techiques. Both techniques considerably improved the reliability of the combined time series; the mean of the confidence intervals of the annual means decreased by 12%. Despite the improvement in reliability, the resulting changes in the annual values of the combined time series were small, the largest change being 2.5 days. Removing outliers was the most effective method of improving reliability, i.e., it resulted in the greatest improvement with the smallest number of discarded observations.
Keywords: Betula pendula, bud burst, combined time series, outliers.
Introduction
The environmental factors affecting the timing of phenological events have been widely studied and several phenological models have been developed (Reaumur 1735, Bünning 1963, Hari et al. 1970, Sarvas 1972, Pelkonen and Hari 1980, Cannell and Smith 1983, Hänninen 1990, Kramer 1994). Reliable phenological data are needed to evaluate the predictive quality of phenological models; however, these data are scarce. Phe-nological phenomena usually take place only once a year and hence long data series cannot be collected quickly. Fortunately, some organizations have specialized in the collection of phe-nological data. Old data sets are excellent material for testing
and developing phenological models. These data sets can cover time spans as long as decennia.
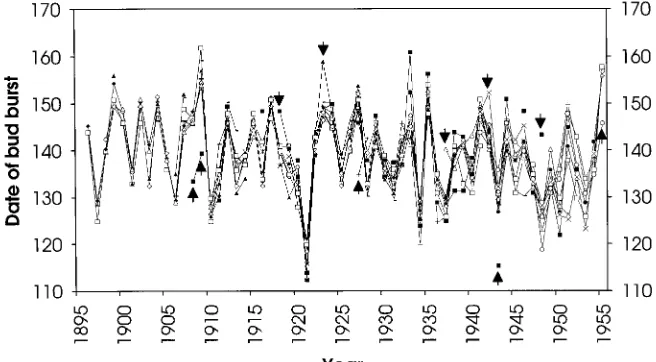
There are two problems associated with using old data. First, the data-generating process cannot be reproduced to examine the error sources and their effects on the data. Therefore the reliability of such data is not known, although large discrepan-cies in the data are often obvious (Figure 1). Second, further observations cannot be obtained to improve the reliability of the data. We have undertaken a study to determine whether the reliability of the data can be assessed without knowing the data-generating process, and whether the reliability of the data can be improved by selecting some subset of the whole data set. We define the reliability of a data set as the trustworthiness of the data. The exact quantification of reliability depends on the nature of the data.
Similar problems are faced by meteorologists. The general practice is to check the weather data collected by the observa-tion network for possible erroneous observaobserva-tions. Each obser-vation is compared to known reasonable maximum and minimum values, and all observations beyond these are exam-ined. Further, each observation is compared with data from nearby locations. As the correlation between closely situated observation places is usually high, suspicious observations can easily be recognized.
We developed two techniques for determining the reliability of phenological data consisting of several separate observation series. The techniques were used to select the most reliable subset of observations and thereby improve the reliability of the combined phenological time series of bud burst in Betula pendula Roth.
Measuring and improving the reliability of the data
Old phenological data vary with respect to both the reliability and the length of the observation series. The reliability of the data can be improved and the time span increased if several observation series are combined. The overlapping of annual observations in such data can be used to detect and remove systematic differences in the overall level of the observation series (Häkkinen et al. 1995). The adjustments have to be
Improving the reliability of a combined phenological time series by
analyzing observation quality
TAPIO LINKOSALO,
1RISTO HÄKKINEN
1and PERTTI HARI
21
The Finnish Forest Research Institute, Unioninkatu 40 A, FIN-00170 Helsinki, Finland
3
Department of Forest Ecology, University of Helsinki, Unioninkatu 40 B, FIN-00170 Helsinki, Finland
Received May 17, 1995
Tree Physiology 16, 661--664
recalculated after each step of selecting or discarding series of observations or particular observations within a series. To measure the reliability of combined time series developed in this way, we used the mean of the confidence intervals of annual means of the adjusted observation series.
Two techniques for selecting the most reliable subset of observations were compared. The correlation between individ-ual observation series and the combined time series varied considerably, suggesting that some of the observation series were less reliable than the majority of the series. Therefore a technique was developed for selecting the most reliable vation series. The finding that even in the least reliable obser-vation series there were only a few clearly deviating observations led to the development of a second technique based on the detection of single outlying observations.
Choosing the most reliable observation series
The reliability of each observation series j, Dj, was determined from the square root of the mean of the squared differences between the adjusted observations and the combined time series, ci. The combined time series was calculated as the annual mean of the adjusted observations. Large values of Dj indicate low concordance and, therefore, low reliability of the observation series. series j. The least reliable observation series were discarded from the combined time series in the order of descending values of Dj. Generally, when the less reliable observation series are omitted, the standard deviations of the annual dates of phenological events should decrease, thus reducing the mean of the confidence intervals of annual means. As the number of observation series is further decreased, the effect of
the decreasing standard deviations should be obscured by the decreasing number of observations. A global minimum of the mean of the annual confidence intervals, i.e., the smallest value of the mean in all possible subsets of observation series, should therefore be found. This is used as an objective criterion to select the observation series to be included in the combined time series.
Detecting outlying observations
An alternative method of selecting the most reliable data set is to detect outlying observations. Each adjusted observation was examined by comparing it to other adjusted observations of the same year. We used a discordancy test for an extreme observa-tion, presented by King (1953), with the test statistic Ti, to determine reliability:
The test compares the excess of the extreme observation from the closest observation to the total range of annual obser-vations. The extreme observation is considered an outlier if Ti, exceeds a critical value (tabulated in Barnett and Lewis 1978). The test assumes normal distribution of the observations.
Betula pendula data
The data set of bud burst in Betula pendula in Central Finland (Häkkinen et al. 1995) was used to test the methods. The data consisted of 19 series with a total of 465 observations during the period 1896--1955. The length of the series varied from 15 to 57 observations, with an average of 24 (Figure 1). System-atic differences in the individual series were removed by the optimization method of adjustment presented by Häkkinen et al. (1995).
Figure 1. Bud burst data for Betula pen-dula. The dates are measured as the number of days since the beginning of the year. Observations marked with an arrow were identified as outliers by the discordancy test.
Results
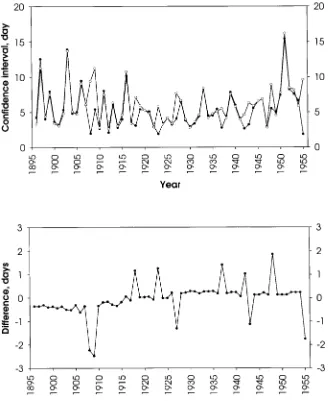
The mean of the 95% confidence intervals of the annual means of the adjusted observation series was used to select the com-plete observation series to be included in the combined time series. The mean of the confidence intervals decreased from 6.0 days for the complete data to 5.6 days (7%) when the two least reliable observation series out of a total of 19 were omitted. The values of Dj for the two series were 7.4 and 5.6 days. These were considerably larger than the mean of 3.0 for the rest of the observation series. The greatest decrease in confidence intervals occurred in 1908, from 9.4 to 1.9 days.
Removal of outliers based on the discordancy test, using a 5% risk level, proved to be a more efficient technique than the determination of Dj. Removing only 10 outlying observations decreased the mean of the annual confidence intervals from 6.0 to 5.3 days (12%). This is below the level achieved by omitting two complete observation series that included a total of 39 observations. The greatest decrease in confidence intervals occurred in 1955, from 9.6 to 1.8 days (Figure 2).
Refining the data only slightly changed the combined time series. The largest deviation between the original time series and the time series refined by removing outliers was in 1909, 2.5 days (Figure 3). The mean of the deviations was −0.1 days.
Conclusions
Little attention has been paid to the reliability of data in biological sciences. Thus, all data sets are implicitly assumed to have the same evidential value, although this is an unjusti-fied assumption. Our study confirms the conclusion of Tuomi-vaara et al. (1994) that the reliability of the data should be taken into account when drawing conclusions.
The old Betula pendula data provided excellent material for the study, because there are overlapping data series that enable the reliability of the data to be estimated and even improved by removing some outlying observations. Most of the outliers are present in the least reliable observation series. Removing the obvious outliers improves the reliability of these series relative to that of the others because the outliers rather than the bulk of
Figure 2. The 95% confidence intervals of the annual means of the original time series of bud burst of Betua pendula (open circles) compared with that of the time series improved by removing out-liers (solid circles).
Figure 3. The difference between the origi-nal and the refined combined time series of bud burst of Betula pendula as a func-tion of observafunc-tion year.
the observations account for the lower reliability of the obser-vation series. Use of the techniques employed here resulted in up to a 12% decrease in the mean of the confidence intervals of the annual means. Thus, either technique can be used to improve the reliability of the phenological data and thereby allow more sensitive testing of the phenological models.
References
Barnett, V. and T. Lewis. 1978. Outliers in statistical data. Wiley, New York, 365 p.
Cannell, M.G.R. and R.I. Smith. 1983. Thermal time, chill days and prediction of budburst in Picea sitchensis. J. Appl. Ecol. 20:951--963.
Bünning, E. 1963. Die physiologische Uhr. Springer-Verlag, Berlin, 105 p.
Häkkinen, R., T. Linkosalo and P. Hari. 1995. Methods for combining
phenological time series: application to bud burst in birch (Betula
pendula) in Central Finland (1896--1955). Tree Physiol. 15:721--726.
Hänninen, H. 1990. Modelling bud dormancy release in trees from cool and temperate regions. Acta For. Fenn. 213.
Hari, P. and R. Häkkinen. 1991. The utilization of old phenological time series of budburst to compare models describing annual cycles of plants. Tree Physiol. 8:281--287.
Hari, P., M. Leikola and P. Räsänen. 1970. A dynamic model of daily growth of plants. Ann. Bot. Fenn. 7:275--378.
King, E. P. 1953. On some procedures for the rejection of suspected data. J. Am. Stat. Assoc. 48:531--533.
Kramer, K. 1994. Selecting a model to predict the onset of growth of Fagus sylvatica. J. Appl. Ecol. 31:172--181.
Pelkonen, P. and P. Hari. 1980. The dependence of the springtime
recovery of CO2 uptake in Scots pine on temperature and internal
factors. Flora 169:389--404.
Reamur, M. 1735. Observations du thermomètre, faites è Paris l’année 1735. Mem. Acad. Roy. Sci. Paris, pp 737--754.
Sarvas, R. 1972. Investigations on the annual cycle of developement of forest trees. Active period. Commun. Inst. For. Fenn 76(3):1--110.
Tuomivaara, T., P. Hari, H. Rita and R. Häkkinen. 1994. The guide-dog approach: a methodology for ecology. Univ. Helsinki, Depart. For-est Ecology Publ. 11, 92 p.