CONTACT US
APINDO-EU ACTIVE Project
Gedung Permata Kuningan Lantai 20 Jl. Kuningan Mulia Kav. 9C,
Guntur – Setiabudi, Jakarta 12980 – Indonesia
Tel: +62-21-83780594
Faks: +62-21-8378 0823, 8378 0746 E-mail: [email protected] Website: www.apindo.or.id
www.facebook.com/pages/APINDO-EU-ACTIVE-Project @DPN_APINDO
Join us on social media
INDONESIA–CHINA
TRADE IN ACFTA:
MAPPING OF
COMPETITIVENESS AND
SPECIALIZATION
COMPETITIVENESS AND
SPECIALIZATION
A
PINDO-ACTIVE working papers are issued in joint cooperation between Indonesia Employer Association (APINDO) and Advancing Indonesia’s Civil Society in Trade and Investment (ACTIVE), a project co-funded by the European Union. ACTIVE project aims to strengthen APINDO’s policy making advocacy capabilities in preparing the business environment and to empower national competitiveness in facing global integration.For more information, please contact ACTIVE Project Manager, telephone +6221-8378-0824 or visit www.apindo.or.id where copies are available in pdf format. The authors may be contacted at [email protected] or [email protected].
Further information about ACTIVE project can be accessed at:
www.apindo.or.id/index.php/trade-a-investment/active-project/tentang-active-project.
The contents of APINDO-ACTIVE working papers are the sole responsibility of the author(s) and can in no way be taken to reflect the views of Indonesia Employer Association (APINDO) or its partner institutions. APINDO-ACTIVE working papers are preliminary documents posted on the APINDO website (www. apindo.or.id) and widely circulated to stimulate discussion and critical comment.
Disclaimer
APINDO-EU Active Project Team Members:
Tiarma Fitriani P. (Project Manager) Fandi Achmad (Economist) Rosa Situmorang (Economist)
A
fter the full implementation of ACFTA on January 1, 2010, zero tariffs have been imposed on 6,682 tariff posts in 17 sectors. Zero tariffs make even bigger trade deficit compared to 2011 for Indonesia. ACFTA also impacts the growth of industries and restructures the supply chain network in the region. Experience with ACFTA is strongly influencing public perception about the responsiveness of the government to improve trade and investment environment in order to be prepared for more open trade and investment.The closer integration puts Indonesia in a severe competition because China’s products are cheaper and substitutive to Indonesia’s products. Hence, Indonesia should also be aware of its competitiveness and specialization in trade with China to survive in the ACFTA.
This study maps the changing pattern of trade competitiveness and specialization between Indonesia and China. This map shows products in which Indonesia is more specialized in bilateral trade with China. In addition, when a country has competitiveness in producing goods relatively to the average ability of the world, it does not necessarily mean it has specialization in bilateral trade. Therefore country to country analysis should be considered in making trade policies for the next international trade agreements.
We would like to thank Rosa Situmorang and Fandi Achmad for conducting this study. We also like to appraise the contribution of Advancing Indonesia’s Civil Society in Trade and Investment (ACTIVE) program which address the lack of capacity in APINDO to analyze, evaluate and advocate adequately the Indonesian business sector’s interests in many free trade agreements. After all, we believe that the findings in this study will give great insight for policy makers and our social partners. We hope it will generate useful discussions and give significant contribution to Indonesia’s development.
Sofjan Wanandi Chris Kanter
General Chairman Vice Chairman
Indonesia Employer Association (APINDO) Indonesia Employer Association (APINDO)
Abstract I 6
Overview ASEAN–China Free Trade Area I 7
Indonesia-China Trade: Facts and Figures I 13
Methodology I 19
Data I 19
Trade Competitiveness I 19
Trade Specialization I 24
Mapping: Indonesia–China Trade Commodities I 25
Analysis of Indonesia-China Trade Competitiveness and
Specialization I 27
Recommendation I 32
References I 33
Appendix I 35
Figure 1.1 Indonesia’s Free Trade Agreement through ASEAN
Figure 1.2 Historical Lines of ASEAN-China Free Trade Area
Figure 1.3 Approaches to Establish ASEAN-China Free Trade Area
Figure 1.4 Types of Wholly Obtained Product in Rules of Origin
Figure 1.5 Commitments to Open Up Services
Figure 2.1 Indonesia-China Trade Growth 2007-2011
Figure 2.2 Indonesia-China Export-Import 2007-2011
Figure 2.3 Indonesia’s Largest Export Value to China
Figure 2.4 Indonesia’s Largest Import Value from China
Figure 2.5 Indonesia’s Import Pattern from China 2001-2011
Figure 2.6 Indonesia’s Export Pattern to China 2001-2011
Figure 3.1 The Evolution of Trade Competitiveness Measurement
Figure 3.2 Mapping of Trade Competitiveness and Specialization of ASEAN-China Free Trade Area
Table 1.1 Schedules of Tariff Reduction in ASEAN-China Free Trade Agreement
Table 3.1 Comparison of Six Comparative Advantage Measurement
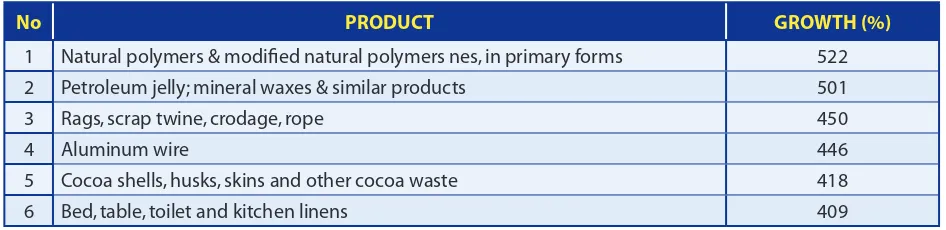
Table A3.1 Products with Export Growth Above 400% p.a. of 2007-2011 calculation
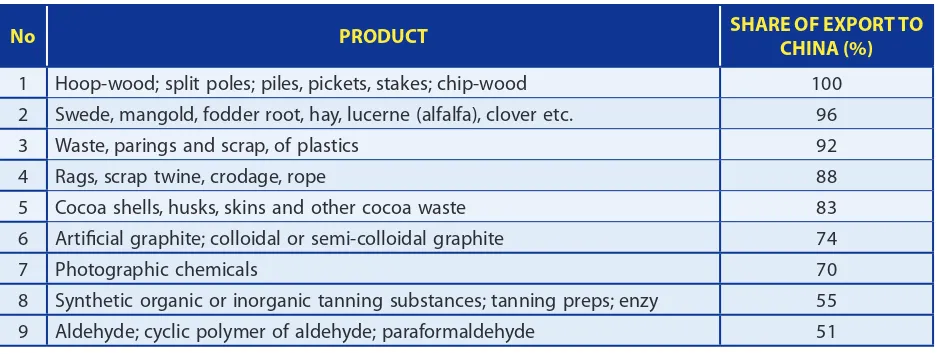
Table A3.2 Products with China as Main Market for Indonesia’s Export
Figure 4.1 Indonesia’s Trade Distance Indexes against China (Top 10 Specialized Commodities)
Figure 4.2 China’s Trade Distance Indexes against Indonesia (Top 10 Specialized Commodities)
Figure 4.3 Indonesia-China Trade Commodities Mapping 2004
Figure 4.4 Indonesia-China Trade Commodities Mapping 2011
Figure A2.1 Indonesia’s Trade on Section TTA 2011
Figure A2.2 Indonesia’s Trade of TTA and Cotton 2001-2011
Figure A2.3 Share of Cotton Commodities 2011
Figure A3.1 Export Share Based on the Distribution of Export Growth (2011)
Figure A3.2 Share of Export to China Based on the Distribution of Export Growth (2011)
A
SEAN- China Free Trade Area (ACFTA) opens opportunities for Indonesia to gain benefit from non- tariff barriers on several products. There are some competitive areas in which Indonesia has comparative advantage in the world trade. However, in the context of bilateral trade, the relative specialization between Indonesia and China more precisely determines the trade opportunities. This paper presents commodities competitiveness and specialization mapping of Indonesia- China trade. Competitiveness represents the comparative advantage of a country on certain commodities in the world trade and specialization explains the relative difference of comparative advantage within two countries in bilateral trade. The map explains Indonesia’s areas of specialization and the sectors which need attention.I
ndonesia grows many regional trade agreements through ASEAN in recent years. As a part of the ASEAN, Indonesia has several free trade agreements with China, Korea, Japan, India, Australia, New Zealand, and 9 members of ASEAN itself. The increasing tendency to form trade agreements deserves special attention, particularly in regard to the advantages and disadvantages. Therefore, every free trade agreements have to be examined and directed to prioritize Indonesia’s interest. FIGURE 1.1 indoneSia’S free Trade agreemenT Through aSean
One of default in these agreements is when Indonesia did not prepare yet for ASEAN – China Free Trade Area (ACFTA). ASEAN-China Free Trade Area (ACFTA) is an agreement between countries members of ASEAN with China to create a free trade area by eliminating or reducing tariff or non-tariff barriers to trade in goods, increasing market access to services, reforming rules and regulations of investment to improve the welfare of ASEAN countries and China. ACFTA provides opportunities to increase export from Indonesia. Ibrahim (2010) found that Indonesia obtained a net trade creation amounted to 2% and total export growth increased by 1.8%. However, the commodity structure of China and the non-competing behavior of ASEAN countries including Indonesia (tends to be complement) caused China is relatively easier to penetrate export to the ASEAN market than ASEAN itself (Ibrahim et al, 2010).
ACFTA has built up by its long story. The formation of ACFTA can be traced back to Chinese Premier Li Peng’s visit to Bangkok in 1989 when he stated four principles in establishing, restoring, and developing relations with all ASEAN countries. These were: (1) peaceful coexistence despite differences in social and political systems, (2) anti-hegemonic ideology, i.e. China will not seek to be a hegemony power nor will it interfere in the domestic affairs of ASEAN countries, (3) further development of economic relations and (4) continuing support of regional cooperation and initiatives from ASEAN (Baviera, 1999). Since then, there have been signifi cant milestone in China – ASEAN economic cooperation.
Economic cooperation opened up in the year 1991. Qian Qinchen, Chinese Foreign Minister, attended the opening of ASEAN Ministerial Meeting in Kuala Lumpur on July 1991. He showed China’s interest to cooperate with ASEAN. It is responded positively by agreement to establish two joint committees - Joint Committee on Scientifi c and Technological Cooperation and Joint Committee on Economic and Trade Cooperation (ACJETC). These committees were formally established in September 1993 when Dato’ Ajit Singh, ASEAN Secretary General, visited Beijing. During the talks on economic and trade cooperation, ACJETC mainly exchanged views on international and regional economic issues and discussed how to put forward bilateral trade and investment cooperation.
In December 1997, a document of Good Neighborliness and Good Mutual Trust was established as the framework of ASEAN-China relations. It gave priority to economic relations and trade with the principle of comparative advantages and mutual benefi t. It also encouraged the cooperation in the areas of resources, technology, market, banking, information, human resources, development and investment.
As real steps on economic cooperation in ASEAN, China respectively signed framework documents on bilateral trade cooperation with Thailand and Malaysia and signed joint statements on future cooperation with Viet Nam and Brunei in 1997. Moreover, China had already signed all bilateral trade cooperation documents with each ASEAN countries by the end of 2000. All of this bilateral trade cooperation encouraged ASEAN and China to begin negotiations to set up a free trade area at The 7th ASEAN Summit in Brunei.
ASEAN-China economic cooperation progressed to a new stage in November 2002 by the signing of Framework Agreement on Comprehensive Economic Cooperation between ASEAN and China. It was signed by Premier Zhu Rongji and the leaders of the ASEAN countries. Based on the agreement, the ASEAN-China Free Trade Area should cover trade in goods, trade in services, investment, and economic cooperation with trade in goods as the core. It included the setting rules of origin, and disciplines on anti-dumping measures, countervailing measures, safeguards, and dispute settlement mechanism, as guarantee methods to smooth the running of trade exchange between ASEAN and China. For areas of economic cooperation, it encouraged to focus in 5 priority sectors, including agriculture, information and communications technology, human resources development, investment, Mekong River basin development and can be extended to other areas. Overall, this agreement laid the foundations for the ASEAN – China Free Trade Area.
Through Framework Agreement on Comprehensive Economic Cooperation, China and ASEAN countries agreed to negotiate in within 10 years. Negotiation was directed through several approaches in order to strengthen and enhance economic cooperation. These approaches will be outlined into regulations as guidance for ASEAN – China Free Trade Area. In January 2004, ASEAN – China Free Trade Area was initially implemented under the early harvest of agreement on trade in goods of the Framework Agreement on Comprehensive Economic Cooperation. Early harvest program aimed to accelerate tariff reduction and elimination in agricultural products as the fi rst major step in realizing free trade area. Then, In July 2005, the tariff reduction plan was offi cially launched. This tariff reduction plan consisted of 5 tracks including early harvest program.
FIGURE 1.3 approacheS To eSTaBliSh aSean–china
In January 2004, ASEAN – China Free Trade Area was initially implemented under the early harvest of agreement on trade in goods of the Framework Agreement on Comprehensive Economic Cooperation. Early harvest program aimed to accelerate tariff reduction and elimination in agricultural products as the first major step in realizing free trade area. Then, In July 2005, the tariff reduction plan was officially launched. This tariff reduction plan consisted of 5 tracks including early harvest program.
Track Indonesia’s Products* Rules
Early Harvest Program
8 (HS 2 Digit)
Products with applied MFN tariff rates higher than 15% should reduce not more than 10 % by January 1, 2004, not more than 5% by January 1, 2005, and 0% by January 1, 2006
Products with applied MFN tariff rates between 5% and 15% should reduce not more than 5 % by January 1, 2004 and 0% by January 1, 2005 Products with applied MFN tariff rates lower than 5% should reduce to 0% by January 1, 2004
Normal Track I
1880 (HS 6 Digit) By July 1, 2005, should reduce tariff at 0% - 5% for at least 40% tariffs line placed in the normal track
2820 (HS 6 Digit) By January 1, 2007, should reduce tariff at 0% - 5% for at least 60% tariffs line placed in the normal track
6683 (HS 6 Digit) By January 1, 2010, should eliminate all tariffs for tariffs line placed in the normal track
Normal Track II
263 (HS 6 Digit) Flexibility to have tariffs of some tariff line under normal track I, not exceeding 150 tariff lines and eliminated by January 1, 2012
Sensitive
Track 304 (HS 6 Digit)
Sensitive track placed for 400 tariff lines at the HS 6-digit level and 10% of the total import for Indonesia. Value is based on 2001 trade statistics
MFN tariff rates for products placed in the Sensitive track shall be reduced to 20% by January 1, 2012
Tariff rates shall be subsequently reduced to 0%-5% by January 1, 2018
Highly Sensitive
Track
47 (HS 6 Digit)
Tariff placed in the highly sensitive track should be not more than 40% of the total number of tariff lines in the Sensitive Track or 100 tariff lines at the HS 6-digit level
MFN tariff rates for products placed in the Highly Sensitive Track shall be reduced not more than 50% by 1 January 2015 for ASEAN 6 + China and January 1, 2018 for newer ASEAN member
TABLE 1.1 ScheduleS of Tariff reducTion in aSean- china free Trade area
Beside tariff reduction, there are other regulations to support trade between ASEAN-China. One of the regulations gets concern from trader is the rule of origin. The products imported by a trader should be deemed to be originating and eligible for preferential concessions if they conform to the origin requirements. Rules of origin divided products to wholly obtained product and not wholly obtained product. For not wholly obtained products, it can be traded if they fulfill minimum 40% of its content originates from any party (ACFTA member countries)
or if the total value of the materials produce originating from outside of the territory of a Party (i.e. non-ACFTA) does not exceed 60% of the FOB value of the product. In the free trade area, rules of origin discourage aggregate trade fl ows and encourage trade in intermediate goods (Estevadeordal and Suominen, 2005). Thus, Indonesia has to respond to it carefully.
Besides trade in goods, ACFTA also look at the opportunity of trade in services. ASEAN and China agreed to liberalize trade in services with substantial sectors coverage. In this case,
Indonesia committed to open up new market in 10 services area while China opened 5 services area (Directorate General of International Trade Cooperation of Indonesia, 2010). Trade in services is boosted through progressive elimination of substantially all discrimination between countries, except for measures permitted under Article V(l)(b) of the WTO General Agreement on Trade in Services (GATS). The exceptions are only for the purposes to: (1) protect public morals, (2) protect human, animal, and plant life, (3) secure compliance with laws or regulations which are not inconsistent with the provisions of this agreement, and (4) safeguard balance of payment.
Services play a major role in all modern economies. Indeed, it would be hard for any economic activities to run without services such as telecommunications, banking and freight logistics. Then, an effi cient services sector is critical for trade in goods and economic growth. Furthermore, promoting greater trade in services through open markets and non-discriminatory treatment can lead to higher employment levels, higher incomes and higher standards of living through jobs creation in this fi eld.
The opening of certain services sectors can create competition and provide consumers with access to a broader range of services. It also brings out a greater depth of expertise from domestic and overseas. In addition, openness in services influences long run growth performance. Mattoo, et al (2001) estimated that countries with fully open telecom and financial services sectors grow up to 1.5 percentage points faster than others (Mattoo et al, 2006). Indonesia openness in services seems to grab this opportunity.
Ultimately, the establishment of ASEAN-China Free Trade Area would welcome an economy area with USD 1.9 billion consumers which are 27.8% of total consumer in the world. It also produces over USD 9.4 trillion of GDP (13.56% of world GDP) and USD 6.05 trillion of total volume of trades, 16.8% of total volume of trade in the world (2011)1. ASEAN-China
Free Trade Area would be one of the most populous free trade area of the world, and the largest free trade area formed by developing countries.
COMMITMENT TO OPEN UP SERVICES
INDONESIA CHINA
1. Business Services (Computer Related Services, Real Estate Services, Market Research, Management Consulting)
2. Construction and engineering related services 3. Environmental Services
4. Transport Services
5. Recreational, Cultural and Sporting Services 6. Tourism and travel related services
7. Educational services 8. Telecommunication services 9. Health-related and social services 10. Energy services
1. Business Services (Computer Related Services, Real Estate Ser vices, Market Research, Management Consulting)
2. Construction and engineering related services 3. Environmental Services
4. Transport Services
5. Recreational, Cultural and Sporting Services
Source: Directorate General of International Trade Cooperation, Ministry of Trade of Indonesia
FIGURE 1.5 commiTmenT To open up ServiceS
2 The growth rate is based on the calculation of International Trade Centre, the computation formula of the growth rate over
fi ve years is the following: ( ((∑ ) ∑
) )
Where is the value of the i-th year in current US Dollar. More information about the calculation can be accessed in the web www.trademap.org.
T
he full implementation of ACFTA on January 1, 2010 has abolished the tariffs on 6,683 posts in 17 sectors. This free trade was established to strengthen trade partnership between China and ASEAN countries by creating a wider space for both parties to expand their trade. In 2011, Indonesia’s export value to China reached USD 22.94 million and the import value reached USD 26.21 million. The trade volume had been fl ared for more than ten times within the last decade, while in the last fi ve years Indonesia’s import value has grown 29% p.a. and export grew 22% p.a2.ACFTA successfully jacked up the trade volume between two countries. The trend of Indonesia-China trade shows an ascending trade value, especially steeper in the last fi ve years (Figure 2.2). In fact, the diminishing of trade barriers (which actually have started gradually since 2005) has given a big hit in Indonesia’s trade balance. The free tariffs have blown-in a huge amount of commodities from China. The products infl ow grew more rapidly than the outfl ow causing defi cit trade balance records for Indonesia since 2008. In 2010, when the ACFTA was fully implemented, the defi cit was over USD 4 billion. The export capacity of China was supported by the investment climate and infrastructure
inDonesia-CHina traDe:
FaCts anD FigUres
FIGURE 2.1 indoneSia-china Trade growTh 2007-2011
which boosted up the industrialization. In 2011, the industrial production growth rate3 of
China was 13.90%, while Indonesia was left far behind by 4.10%. The gap of industrial production growth also refl ects Indonesia’s lack of capacity to enter the FTA with China. The downstream industries were not supported by upstream industries and still relied on imported capital goods and raw materials.
FIGURE 2.2 indoneSia-china exporT-imporT 2007-2011
Source: International Trade Centre, based on calculation of UN COMTRADE
Mineral fuels, oil and distillation products became the largest Indonesia’s chapter of export commodities4 to China, with the volume of export in 2011 reached USD 8,923 million
(Figure 2.3), followed by animals/vegetable oils, ores, rubber, and organic chemicals. The export value of those fi ve chapters was more than 80% of Indonesia’s total export to China. The main mineral export commodity was coal (included bituminous coal) with the value of USD 6,007 million or 67% of total exported mineral products. The export of coal had grown very fast within the last fi ve years with the annual growth between 2007-2011 more than 80% p.a.
Among the ten largest chapters of export commodities, ores, slag and ash grew the fastest within 2007-2011 with 46% p.a. The largest value of exported ore was nickel (41.1%), aluminum (27.1%), copper (16.7%) and iron ore (10.4%). Iron ore was the fastest growing ore commodity with the annual export growth rate in 2007-2011 up to 80% p.a.
3 Industrial production rate is the annual percentage increase in industrial production, including manufacturing, mining, and
production (data from Central Intelligence Agency United States’ World Fact Book, https://www.cia.gov/library/publications/ the-world-factbook/).
4 Chapter of Commodities is a group of commodities which is classifi ed based on 2 digits Harmonized System (HS) by World
FIGURE 2.3 indoneSia’S largeST exporT value To china
Source: International Trade Centre, based on calculation of UN COMTRADE
On import side (Figure 2.4), machinery and electrical equipment were the largest commodities in 2011 with the value for both commodities remarkably exceeding USD 10 billion. The largest value of imported products in the chapter of machinery was portable digital computers (USD 1,113 million) and the largest value of imported electrical equipment was telephone (for cellular networks mobile telephones/ for other wireless) with the value of USD 1,000 million.
There are some highlights on the data of Indonesia’s import from China. First, the third largest import value in 2011, iron and steel, showed a deceleration in 2007-2011 of 1% p.a. The decline of iron and steel import value was in accordance with the revision of import regulation which was enforced to control the import of iron and steel5.
5 The Ministry of Trade has issued several regulations to restrict the import of iron and steel by requiring the importers to
In the other hand, the import of cotton had the highest growth among the ten largest import chapters of commodities. Indonesia has been a net importer of cotton since the growing national demand of cotton was not supported by the national production. So far, up to 99% of domestic demand for cotton has been fulfi lled by import. The estimated volume of domestic cotton produced was only 33,000 tons per year, whereas the domestic demand was up to 700,000-800,000 tons per year6. As the main cotton producer which
produces 29% of world cotton (based on statistics from US Department of Agriculture)7,
Indonesia’s domestic demand from grew rapidly. Indonesia’s dependence on imported cotton brought Indonesia to uncompetitive position in its textile products. But interestingly, out of the dependence on imported cotton, chapter cotton itself has been the fi fth largest export to the world in section textile andtextile articles8 with the value of USD 811 million
in 2011. This fact indicated some possible situations in domestic cotton industry. First, it might show the intra industry product specialization and the second, it might indicate the unmatched demand and supply of cotton between the upstream and downstream industry in Indonesia, see [APPENDIX 2].
FIGURE 2.4 indoneSia’S largeST imporT value from china
Source: International Trade Centre, based on calculation of UN COMTRADE
6 Indonesia’s main suppliers of cotton were US, Brazil, and Australia
(http://industri.kontan.co.id/news/walau-harga-naik-industri-tekstil-tetap-genjot-impor-kapas--1).
7 The data can be retrieved from Nationmaster (Nationmaster is a vast compilation of data from such sources as the CIA World
Factbook, UN, and OECD). It can be accessed through the website www.nationmaster.com.
8 The section textile and textile articles based on HS 2012 contents 14 chapters of commodities in textile and textile articles
FIGURE 2.5 indoneSia’S imporT paTTern from china 2001-2011
Source: International Trade Centre, based on calculation of UN COMTRADE
9 The term SECTION is based on the Harmonized System 2012 which classifi ed 97 chapters of commodities into 22 sections. Over years, Indonesia and China have expanded the bilateral trade between both countries. The trade pattern has also changed. Figure 2.5 and fi gure 2.6 show the Import and export pattern of Indonesia-China over the period 2001-2011. The chapters of commodities presented here are classifi ed by the term of sections9. With the rapid technology development
in China within last decade, the pattern of Indonesia’s import from China had also been switched. In early 2000s, machinery and electrical equipment was not main import commodity from China. Fantastically, in ten years the share of machinery and electrical equipment in total import sharply grew three times bigger and dominated the import value. At the same time, the share of chemical and mineral products gradually shrank.
FIGURE 2.6 indoneSia’S exporT paTTern To china 2001-2011
METHODOLOGY
DATA
This research aims to map trade competitiveness and specialization between Indonesia and China before and after ACFTA. It also tries to examine the changing pattern of competitiveness and specialization between the two countries. Therefore, trade competitiveness and trade specialization become two main variables in this research. Details of these variables including the development are explained below. Trade competitiveness is proxied by Normalized Index (NI) while trade specialization is proxied by Trade Distance Index (TDI).
Data on export and import, the basic variables to calculate normalized index (NI) and trade distance index (TDI), is published by International Trade Centre (ITC)10. Internationally,
traded products are classifi ed according to some international standards of classifi cation such as the Standard International Trade Classifi cation (SITC), the Harmonized Commodity Description and Coding System (HS) and the Broad Economic Categories (BEC). This research uses HS 201211. This research focuses to examine the year 2004 and 2011 to compare trade
competitiveness and specialization before and after ACFTA.
These trade data are based on the Harmonized System (HS) 2-digit level of aggregation, which consists of 97 classifi cations (from HS 01 to HS 99 with HS 77 and 98 being empty as “reserved for possible future use”). In this case, those classifi cations are called chapter. See [APPENDIX 1] for the description of HS 2-digit codes. Furthermore, HS can be elaborated to be approximately 5000 article/product descriptions that appear as headings and subheadings and grouped in 21 sections.
TRADE COMPETITIVENESS
The Evolution of Trade Competitiveness Measurement
The term trade competitiveness is widely used but has a lot of interpretation. OECD defi nes trade competitiveness as a measurement of a country’s advantage or disadvantage in selling its products in international markets. In the micro level, competitiveness pertains to the ability and performance of a fi rm, sub-sector or country to sell and supply goods and services in a given market, in relation to the ability and performance of other fi rms, sub-sectors or countries in the same market12.
10 Based on United Nations Commodity Trade Statistics Database (UNCOMTRADE) calculation (link: www.intracen.org). 11 The Harmonized Commodity Description and Coding System (HS) of tariff nomenclature is an internationally standardized
system of names and numbers for classifying traded products developed and maintained by the World Customs Organization (WCO).
Assessing trade competitiveness was started by Liesner (1958). Liesner proposed Index of Relative Export Performance (REP). It is used as a proxy for comparative costs in an effort to assess the effects of an entry into the European Common Market on British industry. The equation is as showed below:
Where X represents exports, i is a country, j is a commodity (or industry), and n is a set of countries (e.g. the world). Since it has a lot of weakness on the application, comprehensive measurement is evolved.
A more advanced measure of trade competitiveness was later on presented by Balassa (1965), popularly known as the Balassa Index (BI). Alternatively, as the actual export fl ows ‘reveal’ the country’s strong sectors, it is also known as Revealed Comparative Advantage (RCA). The equation for BI is following:
Where X represents exports value, i is a country, j is a commodity, t is a set of commodities and n is a set of countries.
BI is based on observed trade patterns. It measures a country’s export of a commodity in relation to its total exports and to the corresponding export performance of a set of countries. If BI>1, then a comparative advantage is revealed, the commodity can be considered as competitive. The higher value of BI means country is more competitive
FIGURE 3.1 The evoluTion of Trade compeTiTiveneSS meaSuremenT
to sell the products. However, BI got a lot of critics of its limit to compare with other countries. For example, the value of BI in mineral oils is 500 in Indonesia while it is 100 in machinery. It means Indonesia is more competitive to sell mineral oils than machinery to the world. But, we cannot state that Japan more competitive to sell mineral oils than Indonesia when their BI value at 600. The higher Japan’s BI value in mineral oils can be caused by the decreasing of total export of all products in Japan despite there are nothing changes in the production or selling of Japan’s mineral oil. Furthermore, using exports to measure comparative advantage, in view of the increasing importance of intra-industry trade may lead to erroneous conclusion13. Therefore, import has to be included.
Lafay Index (LI) in 1992 tried to solve it by inserting import and GDP to the equation. It takes account of both exports and imports and is therefore more suitable for a country with intra-industry trade. Lafay Index gives weight to each product based on its contribution according to the respective importance in trade. It is also controlling the distortions due to the macroeconomic factors with the GDP variable (Alessandrini et al, 2007). Lafay Index is shown by following equation:
Where X represents exports value, M represent imports value, i is a country, j is a commodity, Y is GDP and t is a set of commodities. It is considered to have a comparative advantage (disadvantage) in a given commodity when the LI’s value exceeds (is less than) zero. Yet, LI does not measure trade competitiveness with respect to other countries, but with respect to total trade of a given country. Moreover, there is suggestion to accommodate different value of export share since sum of LI for all sectors will be zero.
Solution for the importance of export share in specific product is raised by Proudman and Redding (1998). They use cross section mean to fix mean of BI, called Weighted Index (WI). WI adopts a measurement in which an economy’s export share in given sector is evaluated relative to its average export share in all sectors. WI’s equation as follows:
BI represents value of Balassa Index, i is a country, j is a commodity, and n is a set of countries. By construction, the mean value of WI is constant and equal to one, which enables to compare over time and over country. But, WI does not overcome the problem of asymmetry. It values ranging from zero to infinity. Another problem with the WI, also LI and BI, is that its value is asymmetric; it varies from one to infinity for products in which a country has a revealed comparative advantage, but only from zero to one for commodities with a comparative disadvantage.
13 Intra-industry trade means the trade exchange is occurred in similar products belonging to the same industry, where the
same types of goods or services are both imported and exported.
∑
( ) (∑( )
∑ ( )
Dalum et al (1998) proposed a revealed symmetric comparative advantage (RSCA) through
Symmetric Index (SI) to alleviate the problem of asymmetric as follows:
Where BI represents value of Balassa Index, i is a country, j is a commodity. The SI value ranges from minus one to plus one and is equal to zero at the comparative-advantage-neutral point ( ). Hence, it is called symmetric. The SI measure preserves most of distribution characteristics of the original BI, and it can be considered a more elegant substitute of BI. Nevertheless, the “forced” symmetric may obscure BI’s dynamic, especially when it is expressed by a change of the symmetric itself. Its reduced asymmetry does not imply normality. Benedictictis and Tamberi (2001) found that only with low level of disaggregation level it will possible to have normal distributed residuals14.
Other solution for asymmetric problem is using Additive Index (AI) by Hoen and Oosterhaven (2006). It is also well known as additive revealed comparative advantage. It identifi es the sectors in which an economy has a comparative advantage, and to track changes over time. Unlike the BI index, it is symmetric. The AI is defi ned as the difference of two shares: The share of a country’s total exports of the commodity of interest in its total exports and the export share of set of countries exports to its total exports. The equation as follows:
Where X represents exports value, i is a country, j is a commodity, t is a set of commodities and n is a set of countries. The fi rst term is the share of good j in the exports of country i, while the second term is the share of good i in the exports of countries group. It takes a value between –1 and +1. Country has a revealed comparative advantage if the value exceeds zero, vice versa.
However, the comparability in cross-country analysis is in doubt: the sum of AI values with respect to a given sector is not stable in the cross country analysis, thus leads to variant mean value. Furthermore, although its empirical distribution is bell-shaped and the mean value is centered and constant, it does not follow normality due to far too high kurtosis15.
None of alternative measurements above have satisfactorily overcome all of its shortcomings. Then, Yu et al (2009) try to develop Normalized Revealed Comparative Advantage or Normalized Index (NI) in 2009. The NI calculates the degree of deviation of a country’s actual export from its comparative-advantage-neutral level in terms of its relative scale
14Benedictictis and Tamberi used SITC to exercise distribution of error. At 2 digits, only 4 out of 13 cases are rejected while 3
digits only 3 pass the normality test. At 4 digits level none pass.
15High kurtosis makes assumption of normality is biased and rejected to include in the modeling analysis (Hoen and Oosterhaven,
2006)
16It was presented by Ullah, et al (2011) in 6th Annual London Business Research Conference.
with respect to the world export market and thus provides a proper indication of the underlying comparative advantage. It features include its symmetrical distribution and independence from the number of countries and sectors. Therefore, the value can be used as comparable score among commodity, time, or country. The NI can be expressed as follows:
Where:
Xij : Export of country i in commodity j Xi : Export of country i in all commodities Xw : World export in all commodities Xwj : World export in commodity j NI : Normalized Index
Values of NI is between -0,25 to +0,25. According to the equation, NI > 0 or NI < 0 indicates that country’s actual export of commodity j is higher or lower than its comparative-advantage-neutral level. Thus, NI > 0 means commodity is comparative advantage, on the other hand NI < 0 means commodity is comparative disadvantage. The greater (or the lower) the NI value is, the stronger the comparative advantage (or disadvantage) would be.
Besides its comparability, one of the advantages of NI is the sum of NI is stable and equal zero. It explains well the condition if a country gains comparative advantage in one sector, then the country loses comparative advantage in other sectors; and if one country gains comparative advantage in a sector, then other countries lose comparative advantage in that sector. Furthermore, NI is neither affected by the level of sectors aggregation nor by the choice of reference group of countries, while the AI has attached this problem. However, NI is sensitive to commodity classifi cation in which case more disaggregated classifi cation might show different result than that of a less disaggregated ones16.
The Selection of Revealed Comparative Advantage Index as Trade Competitiveness Measurement
Each one of the revealed comparative advantage indexes above has advantages and disadvantages. Thus, it should be important to have knowledge on the property of indices and properly use them. Sanidas and Shin (2010) exercised six indicators i.e. BI, LI, WI, SI, AI, and NI to fi nd the best one. The fi ndings are summarized below:
̂
(
)
̂
Based on the properties and comparability, NI seems a best indicator to measure trade competitiveness even though it cannot fill normality requirements. NI can compare cross sector and country with over time. In addition, NI has more favorable features than the others, especially its stable mean across space and time, and independence from aggregation level that can be very helpful in analyzing trade competitiveness. Therefore, this research uses value of NI as a proxy of trade competitiveness17.
TRADE SPECIALIZATION
Another important variable to assess the importance of bilateral or regional trade is trade specialization. Trade specialization is different with trade competitiveness. Since trade competitiveness measures the ability of country to sell commodities in the set of countries, trade specialization is more to how different commodities sold between countries in the bilateral or multilateral trade. How different commodities sold is translated to be “distance” in this research. Therefore, trade distance index is used to measure trade specialization. Trade distance index is measured by cross-country difference between the average shares across time of a particular sector in total exports. This difference is called “distance”. Normally, it adds up distances calculated from all sectors to get overall sectors distance measure for total export. The equation is following:
PROPERTIES BI LI WI SI AI NI
Comparative advantage neutral point 1 0 1 0 0 0
Sum over sectors - 0 - - 0 0
Sum over countries - - - 0
Independence from aggregation level X X X X √ √
Independence from reference group of countries X X X X X √
Symmetry X X X √ √ √
Normality X X X X X X
COMPARABILITY BI LI WI SI AI NI
Cross-sector X X X X X √
Cross-country X X √ X √ √
Over-time X √ X X √ √
TABLE 3.1 compariSon of Six comparaTive advanTage meaSuremenT
Source: Sanidas and Shin (2010)
Source: Sanidas and Shin (2010)
17Sanidas and Shin (2010) also used OLS Galtonian regression to assess how similar or dissimilar the distributions of revealed
This paper is simplified it. It only analyzes the trade specialization between two countries in commodities level, thus do not need to sum distance of export share. In addition, it also do not use average shares across time since it only uses data from last available year in 2011. The new equation as follows:
eint stands for the share of sector n in total export of country i at time t while ejnt stands for the share of sector n in total export of country j at time t. the value of TDI can be positive and negative. Thus, TDIij > 0 means commodity is specialized for country i, on the other hand TDIij < 0 means commodity is specialized for country j. The greater (or the lower) the TDIij value is, the stronger (weakened) the specialization of those countries in commodity. In this case, trade distance index is used only to analyze on bilateral trade between two countries at a time per each commodity. As a result, the value of trade distance index shows the strength of its specialization.
MAPPING: INDONESIA – CHINA TRADE COMMODITIES
This mapping focuses on Indonesia and China as trade partners using combination of two main variables into map. They are stuck into two lines, horizontal and vertical line. Horizontal line shows value of normalized index while vertical line shows value of trade distance index. This map combines trade competitiveness of a country with its specialization on bilateral trade in a given commodity. Since NI > 0 means commodity is comparative advantage (has trade competitiveness) and NI < 0 means commodity is comparative disadvantage (does not have trade competitiveness), the midpoint value for horizontal line is zero. Moreover, the midpoint for vertical line is also zero. If TDI > 0, this commodity is highly specialized for Indonesia rather than China while TDI < 0 means commodity is less specialized for Indonesia than China. Then, it identifies four regions in the mapping of Indonesia – China Trade Commodities.
Quadrant Supreme shows Indonesia has ability to sell commodities relative to the average ability of the world. At the same time, Indonesia is also relatively more specialized in the bilateral trade with China. It means China does not yet have a more competitiveness in these commodities relative to Indonesia.
∑
FIGURE 3.2 mapping of Trade compeTiTiveneSS and SpecializaTion of aSean – china free Trade area
The upper left quadrant shows Indonesia has competitiveness to sell the commodities relative to the average ability of the world. Nevertheless, Indonesia is more specialized in exporting these commodities relatively than china in bilateral trade between the two countries. The name Irrational refers to the fact that Indonesia still can be specialized exporter relative to China despite its competitiveness in the world trade. It indicates that China is less concerned relative to Indonesia on these commodities.
Quadrant Inferior shows the commodities where Indonesia does not have competitiveness relative to the ability of the world and is also not specialized in bilateral trade with China. Therefore, this is not an area where Indonesia should focus its export.
SPECIALIZATION
F
ree trade creates more opportunity for each country to expand its economy and reach its maximum productivity stage. Since every country is endowed with different resources, the repealed tariff barriers will free the countries to fulfi ll their needs by importing the products which their domestic industries are not able to produce. Essentially, a free trade aims to open the market which in turn will encourage each country to specialize in their production. The specialization is established as a result of comparative advantage where a country can produce a product more effi cient than others. The specialization can be inter or intra industries18.As mentioned before, Trade Distance Index measures the distance and direction between two countries. Thus, in the case of Indonesia and China, ACFTA has been expected to create the specialization distance between Indonesia and China. The increase of absolute value of the trade specialization index indicates the increase of the specialization capacity of Indonesia against China in a certain commodity.
Figure 4.1 shows the top 10 chapters which are Indonesia’s specialization. Among the top 10 specialized chapters, the index of mineral fuel had increased most rapidly from 2004 to 2011 as well as animal and vegetable oil products. It indicates Indonesia has been more specialized in those both chapters against China, relatively compared with trade performance in 2004. The increase of those both chapters was driven by the escalation of China’s demand for coal and Crude Palm Oil (CPO) which are China’s favorite import commodities from Indonesia. Another chapter which had been more specialized was rubber and articles of rubber. However, the Trade Distance Index of wood and paper has decreased, which means the trade correlation with China for those two chapters were getting closer to be substitutive. On the other hand, Figure 4.2 shows China’s specialization against Indonesia. The fi gure shows the absolute value of the Trade Distance Index which in parallel move up for two main chapters, machinery and electrical equipment. In addition, as we can see in the fi gure, furniture and boats also have been increasingly specialized.
The comparison of Trade Distance Index between 2004 (before the implementation of FTA) and 2011 (after the full implementation of FTA) shows that FTA has encouraged the trade specialization of both countries. In fact, both countries might have same ability to produce certain goods which makes them competitive on those products in the worldwide trade. This condition then not necessarily blots out the possibility of trade between them as they might have different relative effi ciency. FTA is expected to provide the products which cannot be supplied by domestic production, which eventually results a greater variety
18In earlier theories of trade, the production of a good should concentrate in regions which have a comparative advantage
FIGURE 4.1 indoneSia’S Trade diSTance indexeS againST china (Top 10 Specialized commodiTieS)
FIGURE 4.2 indoneSia’S Trade diSTance indexeS againST china (Top 10 Specialized commodiTieS)
Comparative advantage of a country on a world stage can be measured by Normalized Index (NI), while the advantage of a country against another country in bilateral relationship can be measured by the Trade Distance Index. Thus, NI measures the competitiveness of a country in the world and Trade Distance Index measures the specialization between the two countries. By plotting Normalized Index against Trade Distance Index, we may see whether a traded commodity between the two countries actually substitutes the domestic products or complements the domestic needs. Figure 4.5 shows the mapping of Indonesia-China trade commodities on the competitiveness against specialization in 2011. As a comparison, the mapping of year 2004 is showed in Figure 4.4. The term commodities here are explained as the chapters of commodities (2-digits HS). The commodities with specifi c characteristic of Supreme, Irrational, Inferior, and Rivalry are those which are plotted outside the area of -0.0002 ≤ NI ≤ 0.0002 and -0.02 TDI ≤ 0.02.19 Thus, there were 11 intense character chapters
plotted for year 2004 and 9 chapters plotted for year 2011.
In 2004, there were 6 supreme chapters: mineral fuel, animal/vegetable oil, wood, rubber, ores and paper. However in 2011, wood and paper were no longer intense supreme chapters due to the decrease of Indonesia’s relative specialization to China on these chapters. As explained before, chapter mineral fuel and animal/vegetable oil has been Indonesia’s most major export commodities to China since years.
On Quadrant Inferior, there are chapter electronic equipment, chapter machinery, and chapter optical, technical and medical apparatus. In 2004, chapter toys, games and sport requisites was considered as inferior, but with the decrease of China’s relative specialization to Indonesia on this chapter, it was less inferior. This is also a sign of improvement in Indonesia’s toys industry in answering the growing demand of toys to be more innovative20. On the other
hand, chapter furniture arose on 2011 as an intense inferior chapter. The rise of China’s furniture was in accordance with the decline of Indonesia’s competitiveness due to the high production and distribution cost, such as shipping cost and extortions in exporting process21.
Quadrant 4, which explains the rivalry commodities, is occupied by knitted articles/accessories of apparels. Though Indonesia has a comparative advantage of this chapter in the world trade, compared with China, Indonesia is signifi cantly less specialized. It also indicates China has been more effi cient in this industry, while Indonesia actually has a potential. If Indonesia does not improve its competitiveness, China’s commodities may then substitute domestic products, which eventually will kill the domestic industry. In the long term, it may also seize Indonesia’s market share in the world and shift this chapter to Quadrant 3.
19 This normative decision is in regards of the plot distance from the 0 midpoint. Since the distance indicates the strength of
characteristic of the commodities, the more a commodity is distanced from the midpoint, the more intense the characteristic. The distance is computed by Pythagoras theorem:
ommodity is distanc
where CI is Character Intensity of chapter j. To see the commodities with most intense character, the analysis would focus on chapters with CIj > 0.02, which are scattered on the area of -0.0002 ≤ NI ≤ 0.0002 and -0.02 ≤ TDI ≤ 0.02.
20 Toys industry is a creative based industry which requires consistent innovation (source: http://peluangusaha.kontan.co.id/
news/modal-kreatif-bisnis-mainan-edukatif/2012/08/29). However there is still a big space in domestic industry to expand its business, one of the obstacles in this industry is technology (source: http://www.kabar24.com/index.php/industri-mainan-domestik-belum-digarap-maksimal/).
FIGURE 4.3 indoneSia-china Trade commodiTieS mapping 2004
Trade Competitiveness
Trade Competitiveness
T
ra
d
e
C
o
m
p
e
ti
ti
v
e
n
e
ss
T
ra
d
e
C
o
m
p
e
ti
ti
v
e
n
e
FIGURE 4.4 indoneSia-china Trade commodiTieS mapping 2004
Trade Competitiveness
Trade Competitiveness
T
ra
d
e
C
o
m
p
e
ti
ti
v
e
n
e
ss
T
ra
d
e
C
o
m
p
e
ti
ti
v
e
n
e
A
country involves in international trade to fulfill the needs which cannot be supplied by its own domestic production. Therefore international trade should not dim the existing domestic industries. In global trade, specialization gives a country the advantage to gain the benefit of trade liberalization. Each country has different resources which leads to different ability and efficiency in producing goods. To get mutual gains, a country should specialize in producing the goods it does best and import goods that its partners are able to supply at lower cost. Therefore, the government should have a competitiveness map of tradable goods as the basis in making policies which focus on the specialized product.In Indonesia-China bilateral trade, mineral fuel, animal/vegetables fat, rubber and ores are examples of sectors which have been prioritized and specialized by Indonesia. On the other hand, Indonesia imports high-tech commodities (such as machinery and electronics) from China. Both countries will have mutual gains if they have different competitive commodities. However, there are some sectors which cannot meet that sufficient condition. In this case, the specialization will go to the more efficient country.
An example of this case is chapter knitted articles of apparel and accessories where both Indonesia and China has competitiveness in the world trade. Being more specialized, China puts more pressure on our competitiveness in this sector. It should become a concern for the government otherwise Indonesia will lose its competitiveness in the long term, especially with the zero tariff policy allowing commodities to flow freely into domestic market.
Aldrich, John. 2004. The Discovery of Comparative Advantage. Journal of the History of Economic Thought, 26 (3): 379-399.
Alessandrini, et al. 2007. The changing pattern of foreign trade specialization in Indian manufacturing. Oxford Review of Economic Policy, 23: 270-291. Antoni Estevadeordal and Kati Suominen. 2005. What Are the Effects of Rule of Origins on Trade? Integration and Regional Programs Department, Inter-American Development Bank.
Balassa, B. 1965. “Trade Liberalization and Revealed Comparative Advantage” The Manchester School of Economics and Social Studies, 33 (2): 99-123. Ballance, R. H., Helmut Forstner, and Tracy Murray. 1987. Consistency Tests of
Alternative Measures of Comparative Advantage. Review of Economics and Statistics, 69 (1): 157-161.
Baviera, A. 1999. China’s Relations with Southeast Asia: Political Security and Economic Interests. PASCN discussion paper No.99-17.Philippine APEC study center network.
Benedictis, Luca De and Massimo Tamberi. 2001. A Note on the Balassa Index of Revealed Comparative Index. Working Papers 158, Universita’ Politecnica delle Marche, Dipartimento di Economia. Italy.
Directorate General of International Trade Cooperation of Indonesia. 2010. ASEAN – China Free Trade Area. Ministry of Trade of Indonesia. Department of Foreign Affairs, Australia. 2012. The Importance of Services
Trade in Australia, http://www.dfat.gov.au/trade/negotiations/services/ overview trade in services.html. Accessed in December 10, 2012 Hoen, A. and J. Oosterhaven. 2006. On the Measurement of Comparative
Advantage. Annals of Regional Science, 40: 677-691.
Ibrahim, Meily Ika Pratama, and Wahyu Ari Wibowo. 2010. The Impact of ACFTA Implementation on International Trade of Indonesia. BEMP Volume 13 No 1. Bank Indonesia.
International Trade Center. 2012. http://www.intracen.org/trade-support/ market-data-and-information. Accessed in December 10, 2012. Lafay, G. 1992. The Measurement of Revealed Comparative Advantages.
DAGENAIS, M. G. & MUET, P.-A. (eds.) International Trade Modeling. London: Chapman & Hall.
Liesner, H. 1958. The European Common Market and British Industry. The Economic Journal, 68: 302-316.
Mattoo, Aaditya and Rathindran, Randeep. 2006. Measuring Services Trade Liberalization and Its Impact on Economic Growth: An Illustration. Journal of Economic Integration, Center for Economic Integration, Sejong University, 21: 64-98.
Laurin, F. 2008. Mapping Specialization into Trade Volume in Spain’s Regions. International School of Economics at Tbilisi State University, http:// www.fredericlaurin.com/index_files/The%20Mapping%20between%20 Specialization%20and%20Trade.pdf.
Laursen, Keld. 1998. Revealed Comparative Advantage and the Alternatives as Measures of International Specialisation. DRUID Working Paper No. 98-30.
Proudman, J. and S. Redding. 1998. Openness and Growth. The Bank of England.
Sanidas, Elias dan Yousun Shin. 2010. Comparison of Revealed Comparative Advantage Indices with Application to Trade Tendencies of East Asian Countries. Seoul Journal of Economics, 24(2): 21-50.
Ullah, Muhammad Shariat and Inaba Kazuo. 2011. Patterns of Comparative Advantage of Bangladesh’s Exports. 6th Annual London Business Research Conference 2011, Imperial College, London, UK.
Vollrath, T. 1991. A Theoretical Evaluation of Alternative Trade Intensity Measures of Revealed Comparative Advantage. Weltwirtschaftliches Archiv, 127: 265-280.
Widodo, Tri. 2009. Comparative Advantage: Theory, Empirical Measures and Case Studies. Review of Economic and Business Studies, Alexandru Ioan Cuza University, Faculty of Economics and Business Administration, 4: 57-82.
World Trade Organization, Uruguay Round Table. 2012. WTO General Agreement on Trade in Services (GATS), http://www.wto.org/english/ tratope/serve/gatsintre.htm. Accessed in December 13, 2012.
Yang, J. 2003. Sino-Japanese Relations: Implications for Southeast Asia, Contemporary Southeast Asia, 25(2): 306-27.
A P P E N D I X 1
CODE
CHAPTER
Section 1: Live animals; animal products
01 Live animals
02 Meat and edible meat offal
03 Fish, crustaceans, molluscs, aquatic invertebrates nes 04 Dairy products, eggs, honey, edible animal product nes 05 Products of animal origin, nes
Section 2: Vegetable products
06 Live trees, plants, bulbs, roots, cut flowers etc
07 Edible vegetables and certain roots and tubers
08 Edible fruit, nuts, peel of citrus fruit, melons 09 Coffee, tea, mate and spices
10 Cereals
11 Milling products, malt, starches, inulin, wheat gluten
12 Oil seed, oleagic fruits, grain, seed, fruit, etc, nes 13 Lac, gums, resins, vegetable saps and extracts nes 14 Vegetable plaiting materials, vegetable products nes
Section 3: Animal,vegetable fats and oils, cleavage products, etc
15 Animal,vegetable fats and oils, cleavage products, etc
Section 4: Prepared foodstuffs; beverages, spirits and vinegar; tobacco and manufactured tobacco substitutes
16 Meat, fish and seafood food preparations nes
17 Sugars and sugar confectionery 18 Cocoa and cocoa preparations
19 Cereal, flour, starch, milk preparations and products 20 Vegetable, fruit, nut, etc food preparations
21 Miscellaneous edible preparations 22 Beverages, spirits and vinegar
23 Residues, wastes of food industry, animal fodder 24 Tobacco and manufactured tobacco substitutes
Section 5: Mineral products
25 Salt, sulphur, earth, stone, plaster, lime and cement 26 Ores, slag and ash
27 Mineral fuels, oils, distillation products, etc
Section 6: Products of the chemical or allied industries
28 Inorganic chemicals, precious metal compound, isotopes
29 Organic chemicals
30 Pharmaceutical products
CODE
CHAPTER
31 Fertilizers
32 Tanning, dyeing extracts, tannins, derivs,pigments etc 33 Essential oils, perfumes, cosmetics, toileteries
34 Soaps, lubricants, waxes, candles, modelling pastes
35 Albuminoids, modified starches, glues, enzymes 36 Explosives, pyrotechnics, matches, pyrophorics, etc
37 Photographic or cinematographic goods 38 Miscellaneous chemical products
Section 7: Plastics and articles thereof; rubber and articles thereof
39 Plastics and articles thereof 40 Rubber and articles thereof
Section 8: Raw hides and skins, leather, furskins, and articles thereof; saddlery and harness; travel goods, handbags, and similar containers; articles of animal gut (except silk-worm gut)
41 Raw hides and skins (other than furskins) and leather
42 Articles of leather, animal gut, harness, travel goods 43 Furskins and artificial fur, manufactures thereof
Section 9: Wood and articles of wood; wood charcoal; cork and articles of cork; manufactures of straw, of esparto, or of other plaiting materials; basketware and wickerwork
44 Wood and articles of wood, wood charcoal
45 Cork and articles of cork
46 Manufactures of plaiting material, basketwork, etc.
Section 10: Pulp of wood or of other fibrous cellulosic material; recovered (waste and scrap) paper of paperboard; paper and paperboard and articles thereof
47 Pulp of wood, fibrous cellulosic material, waste etc
Section 11: Textiles and textile products
50 Silk
51 Wool, animal hair, horsehair yarn and fabric thereof
52 Cotton
53 Vegetable textile fibres nes, paper yarn, woven fabric
54 Manmade filaments
55 Manmade staple fibres
56 Wadding, felt, nonwovens, yarns, twine, cordage, etc 57 Carpets and other textile floor coverings
58 Special woven or tufted fabric, lace, tapestry etc 59 Impregnated, coated or laminated textile fabric 60 Knitted or crocheted fabric
61 Articles of apparel, accessories, knit or crochet
62 Articles of apparel, accessories, not knit or crochet 63 Other made textile articles, sets, worn clothing etc
CODE
CHAPTER
Section 12: Footwear, headgear, umbrellas, sun umbrellas, walking-sticks, seat-sticks, whips, riding-crops and parts thereof; prepared feathers and articles made thereof; article flowers; articles of human hair
64 Footwear, gaiters and the like, parts thereof
65 Headgear and parts thereof
66 Umbrellas, walking-sticks, seat-sticks, whips, etc 67 Bird skin, feathers, artificial flowers, human hair
Section 13: Articles of stone, plaster, cement, asbestos, mica or similar materials; ceramic products; glass and glassware
68 Stone, plaster, cement, asbestos, mica, etc articles
69 Ceramic products
70 Glass and glassware
Section 14: Pearls, precious stones, metals, coins, etc
71 Pearls, precious stones, metals, coins, etc
Section 15: Base metals and articles of base metal
72 Iron and steel
73 Articles of iron or steel 74 Copper and articles thereof
78 Lead and articles thereof 79 Zinc and articles thereof
80 Tin and articles thereof
81 Other base metals, cermets, articles thereof 82 Tools, implements, cutlery, etc of base metal 83 Miscellaneous articles of base metal
Section 16: Machinery and mechanical appliances; electrical equipment; parts thereof; sound recorders and reproducers, television image and sound recorders and reproducers, and parts and accessories of such articles
84 Machinery, nuclear reactors, boilers, etc
85 Electrical, electronic equipment
Section 17: Vehicles, aircraft, vessels, and associated transport equipment
86 Railway, tramway locomotives, rolling stock, equipment 87 Vehicles other than railway, tramway
88 Aircraft, spacecraft, and parts thereof 89 Ships, boats and other floating structures
Section 18: Optical, photographic, cinematographic, measuring, checking, precision, medical or surgical instruments and apparatus; clocks and watches; musical instruments; parts and accessories thereof
90 Optical, photo, technical, medical, etc apparatus
91 Clocks and watches and parts thereof 92 Musical instruments, parts and accessories
CODE
CHAPTER
Section 19: Arms and ammunition; parts and accessories thereof
93 Arms and ammunition, parts and accessories thereof
Section 20: Miscellaneous manufactured articles
94 Furniture, lighting, signs, prefabricated buildings 95 Toys, games, sports requisites
96 Miscellaneous manufactured articles
Section 21: Works or art, collectors’ pieces and antiques; miscellaneous
97 Works of art, collectors pieces and antiques
Section 22: Commodities not elsewhere specified
A P P E N D I X 2
importeD Cotton: Helping or Killing?
FIGURE A2.1 indoneSia’S Trade on SecTion TTa 2011
Source: International Trade Centre, based on calculation of UN COMTRADE
Harmonized System classification categorized 14 chapters of commodities into section Textile and Textile Articles (TTA), including the chapter cotton. As the main material of a lot of textile articles, TTA dependence on cotton is very significant, thus the pattern of cotton in trade significantly influences the ability of producing textile articles. Among those 14 chapters, cotton had been the first largest import meanwhile it is also the fifth largest export of Indonesia in section TTA. This fact is very interesting and explicitly indicates an intra-industry specialization in cotton. The question is: Is this a good or bad sign?