ASIAN CITIES CLIMATE CHANGE RESILIENCE
NETWORK
CITY LEVEL VULNERABILITY ANALYSIS OF INDORE
Prepared For
Rockefeller Foundation
Prepared By
TARU/ACCCRN Indore City Level Vulnerability Analysis, Phase-I June 2009 i
TABLE OF CONTENTS EXECUTIVE SUMMARY E.I 1 INDORE PROFILE 1 1.1 Location and setting... 1
1.2 Demography ... 2
1.3 Economy ... 4
1.4 Municipal Administration ... 5
1.5 Growth ... 6
1.6 Resource base... 7
1.6.1 Water ... 7
1.6.2 Energy ... 12
1.6.3 Land ... 12
1.7 Poverty ... 13
1.8 Institutions... 13
2 VULNERABLE GROUPS 14 2.1 Background data... 14
3 VULNERABILITY STUDIES 16 3.1 Process ... 16
3.2 Identification of Sample Areas... 16
3.3 Tools of Data Collection ... 17
3.4 Findings from the study ... 17
3.5 Limitations of the study ... 30
4 Conclusions and way forward 31 4.1 Conclusions ... 31
4.2 Way forward... 32 References 34
LIST OF TABLES
TABLE (1): DEVELOPMENT HISTORY OF INDORE 1
TABLE (2): AREA AND POPULATION OF INDORE OVER THE YEARS 2
TABLE (3): SLUM POPULATION IN THE CITY OF INDORE 3
TABLE (4): INDORE PROFILE 3
TABLE (5): IMC BUDGET SUMMARY FOR YEAR 2007-2008 (million Rupees) 5
TABLE (6): GROWTH OF INDORE PLANNING AREA (1975-2002) 6
TABLE (7): HISTORY OF WATER SUPPLY ARRANGEMENT IN INDORE SINCE 1878 8
TABLE (9): PERCENTAGE OF BORE-WELLS WITH PUMPING PROBLEMS IN INDORE 10
TABLE (10): STATUS OF INDORE PLANNING AREA 12
TABLE (11): SAMPLE SETTLEMENTS SELECTED FOR PILOT STUDY 17
TABLE (12): HOUSE CLASSIFICATION BY WALL TYPE AND ROOF TYPE 18
TABLE (13): FLOOR AREA OF THE HHS ACROSS SAMPLE SETTLEMENTS (in sq.ft) 18
TABLE (14): HOUSE TYPES & OWNERSHIP STATUS ACROSS SAMPLE SETTLEMENTS 18
TABLE (15): DEPENDENCY RATIO ACROSS SETTLEMENTS (in percents) 19
TABLE (16): EDUCATIONAL STATUS ACROSS SETTLEMENTS* 20
TABLE (17): EMPLOYMENT PROFILE ACROSS SETTLEMENTS 21
TABLE (18): REPORTED FLOOD EVENTS ACROSS SETTLEMENTS 21
TABLE (19): MULTIPLE WATER SUPPLY ARRANGEMENTS ACROSS SETTLEMENTS 22
TABLE (20): MUNICIPAL WATER SCARCITY ACROSS SETTLEMENTS 23
TABLE (21): TIME SPENT BY HHS IN WATER MANAGEMENT IN SCARCE MONTHS (in hrs) 23
TABLE (22): TIME SPENT BY HHS IN WATER MANAGEMENT IN NON-SCARCE MONTHS (in hrs) 24
TABLE (23): WATER STORAGE ARRANGEMENTS TO COPE WITH WATER SHORTAGE 24
TABLE (24): REPORTED PAYMENT BY THE HHS TOWARDS ELECTRICITY USAGE (Rs/month) 26
TABLE (25): SAVING HABIT & IMPACT OF FLOODS ON FINANCIAL PLANNING OF THE HHs 26
TABLE (26): TYPE OF INFRASTRUCTURE/FACILITY BUILT/BOUGHT AGAINST FLOODS 27
TABLE (27): EXPENDITURE ON INFRASTRUCTURE/FACILITY BUILT AGAINST FLOODS 27
TABLE (28): INFRASTRUCTURE/FACILITY BUILT TO COMBAT WATER SCARCITY 28
TABLE (29): COPING EXPENDITURE TO ADDRESS WATER SCARCITY (in Rs.) 28
TABLE (30): AWARENESS STATUS ABOUT DM PLAN OF THE CITY 29
LIST OF FIGURES
FIG. (1) : EVOLUTION OF INDORE... 7
FIG. (2) : TOPOGRAPHY OF INDORE AND NEIGHBOURHOOD...14
FIG. (3) : LOCATION OF PILOT STUDY SAMPLE SETTLEMENTS...16
LIST OF BOXES
BOX (1): SLUM NETWORKING PROJECT FUNDED BY DFID IN INDORE ...15
BOX (2): MUNICIPAL CORPORATION IN A MAJOR FIX OVER WATER SUPPLY...25
ANNEXURE
ANNEX (A): WATER SCARCITY FROM MUNICIPAL SOURCES………..A1
ANNEX (B): TIME SPENT FOR WATER COLLECTION AT HOUSEHOLD LEVEL ACROSS
SETTLEMENT (NORMAL PERIOD)……….A2
ANNEX (C): TIME SPENT FOR WATER COLLECTION AT HOUSEHOLD LEVEL ACROSS
SETTLEMENTS (SCARCE PERIOD)……….A3
ANNEX (D): WATER SCARCITY RELATED COPING INVESTMENTS AT HH LEVEL ACROSS
TARU/ACCCRN Indore City Level Vulnerability Analysis, Phase-I June 2009 iii ABBREVIATIONS
AC : Advisory Committee
ADB : Asian Development Bank
BPL : Below Poverty Line
CDP : City Development Plan
CGWB : Central Ground Water Board
CRGM : Community Resource Government Markets
DM : Disaster Management
GPS : Global Positioning System
HH : Households
ICTSL : Indore City Transport Services Limited
IDA : Indore Development Authority
IDFL : Indore Development Fund Limited
IMC : Indore Municipal Corporation
ISDA : Infrastructure Services Deficiency Analysis
ITES : Information Technology Enabled Services
JNNURM : Jawaharlal Nehru Urban Renewal Mission
MP : Madhya Pradesh
MPEB : Madhya Pradesh Electricity Board
MPHB : Madhya Pradesh Housing Board
MPPSB : Madhya Pradesh Pollution control Board
MPSEB : Madhya Pradesh State electric board
NIUA : National Institute of Urban Affairs
PHED : Public Health Engineering Department
PP : Poverty Pockets
RCC : Reinforced Cement concrete
RFSTE : Research Foundation for Science, Technology & Ecology
RWH : Rain Water Harvesting
SHG : Self Help Groups
SLD : Shared learning Dialogue
STP : Sewage Treatment plant
TCPO : Madhya Pradesh Town and Country Planning Office
.
EXECUTIVE SUMMARY
Indore is located on the southern edge of fertile Malwa plateau (22°.43 N, 76°.42 E ). It has an average altitude of 550 m above Mean Sea Level. The city of Indore has a history of over 300 years from the Pre-Holkar period to the present day. The total planning area of Indore is 504.87 sqkm including the Indore Municipal Corporation (IMC) area (Indore CDP, 2006). The present population is expected to be around 2.2 million with projected population for 2011 being 2.5 million (Indore CDP, 2006).
The city of Indore is the largest and the most important commercial/industrial city of Madhya Pradesh. The main industries include engineering and textile units, food processing (Soya, sunflower and pulses), pharmaceutical, iron & steel foundries, leather, automobile components, industrial chemicals, mini cement plants, mini steel plants, solvent extraction, soap and detergents, etc.
The core city is administered by the IMC, which is entrusted mostly with maintenance of the roads, water, drainage, sewerage, transport, street lighting, solid waste management along with slum development and other city administration functions. IMC has tried to incorporate many urban sector reforms. IMC issued Municipal Bonds in 2001, for Rs. 100 million to improve roads of the city with the State Government providing guarantee. The Indore Development Authority (IDA) is responsible for most of the development works including colonies, shopping centres, roads and over-bridges with the whole development area.
The slum population of the city was about 0.35 million in 1991. The slum population is expected to be much more now with the present population of city at 2.2 million. The UN Habitat-WaterAid, poverty mapping study (WaterAid, 2006) puts the figure of Poverty Pockets in the city at 604 of which only 229 have been notified by Municipal Corporation. Lack of major industrial city apart from Indore in the nearby region is a major factor for the migrant influx to the city.
Indore depends on a variety of water sources including two small dams near the city, Narmada river based pumping systems (2 phases already working) and ground water. Apart from Narmada, there are five rivers flowing in the neighbourhood, but none of them are suitable for water supply to the city due to size or location.
Insufficient available water supply compared to growing demand has left a section of the population partially or completely un-served. Presently, the city is able to manage 180 million litres per day (mld) while the computed requirement of the city is nearly 270 mld. About half the water supplied is reportedly unaccounted for-mainly due to leakages. In the recent years, the water scarcity has been very acute and has started affecting households and industries severely.
To meet the growing water needs of the city, the IMC has taken up additional water supply from Narmada Phase II and improvement of distribution networks is underway. Besides the Narmada Phase III water supply project (capacity of 360 mld), augmentation of Yashwant Sagar with Asian Development Bank (ADB) loan is being commissioned. The city, which is already reeling under water scarcity problems, also faces occasional short duration floods during the monsoon season.
TARU/ACCCRN Indore City Level Vulnerability Analysis, Phase-I June 2009 E.II
livelihoods, assets, skill levels, dependency, infrastructure service deficiency, current risks and coping measures. Some of the key inferences from the study are listed below:
About 83 percent of the HHs reported staying in self-owned houses. A variety of house types were reported in the city. The most common wall type among the samples is brick with cement mortar whereas the common roof type is Reinforced Cement concrete. Dependency ratio1 was reported to be between 200-500% in 55 percent of the sample households.
The sample households reported dependence on multiple sources of water. Access to municipal water supply was reported in 67 percent sample households while 42 percent reported access to ground water. Tanker was reportedly used by 25 percent of sample households.
Water scarcity problem has been acute since the last decade. Water scarcity problem was reported from March onwards by 47 percent of the sample households while 10 percent each from April and May onwards. Arranging water takes considerable amount of time of households across the city. About 83 percent sample households reported spending more than an hour per day on arranging water.
Sample households reported using different water storage arrangements ranging from underground storage, installation of sump-motor over head tank systems, containers of various sizes. The Municipality has resorted to power cuts during water supply periods and people cope by using hand pumps to suck water from the pipelines.
The city of Indore does not have sufficient sewerage system. Until recently, it did not have sewage treatment plants and most of the sewage was disposed in to local streams. Currently, there are two working Sewage Treatment Plants (STP) in Indore. Due to lack of sewerage system, Both STPs are reportedly getting less sewage than their installed capacity. With the result, the ground water is reported to be contaminated in most parts of the city.
Flood was not reported to be the major issue across the sample settlements. Only stream bank settlements reported of either water logging or short duration high velocity floods. Raised plinth height and drainage pipes to remove water were reported to be the only preparation among the sample households. Several households reported floods since 2004, with 2006-07 floods being fresh in their memory.
Only few households reported membership to Self Help Groups2 (SHG), Community support system or festival groups3. Maintenance of the assets and loss of mandays4 during floods accompanied with increased medical costs increase the vulnerability of the people especially in the low income settlements. Access to informal credit was reported to be high across the settlements. As per the survey results, Insurance of household assets was found to be low. Saving cum life insurance policies was most common among those insured.
1
Dependency ratio = (No of nonworking members/No of working members)*100.
2
A Self-Help Group (SHG) is a registered or unregistered group of micro entrepreneurs having homogenous social and economic backgrounds, voluntarily coming together to save regular small sums of money, mutually agreeing to contribute to a common fund and to meet their emergency needs on the basis of mutual help. They generally have broad anti-poverty agendas.
3
Festival groups are groups which come together generally at the community level to organize and celebrate festivals. Most of them remaining active only till the festival season. In some communities, they remain active throughout the year.
4
Awareness of city disaster management plan was reported by 22 percent of the sample households. This does not account the participation level of the sample households in the preparation of the plan or in the implementation.
TARU/ACCCRN Indore City Level Vulnerability Analysis, Phase-I June 2009 1 1 INDORE PROFILE
1.1 Location and setting
Indore City is located in the center of Indore District, on the southern edge of fertile Malwa plateau, at 22°.43 N latitude, and 76°.42 E longitude. It has an average altitude of 550 meters above mean sea level. It is the largest city of Madhya Pradesh and the only large industrial hub of the state.
Indore has moderately extreme climate (often referred to as Shab-e-Malwa, meaning pleasant evenings of Malwa), but the residents now say that summer evenings are no longer pleasant. During winters (November to February), the night temperature is low at around 10°C and sometimes as low as 2-3° C. Winter day temperatures hover around 18 to 20° C. During summers (April-June), the days are hot (35-40°C) with the peak summer (May) day temperature sometimes touching 45°C.
Rainfall: The city gets an average annual rainfall of about 1050 mm, but inter annual variation is high and drought years are common. The residents report that rainfall pattern has experienced significant changes, with the number of wet days decreasing, but not the quantity. These extreme events have resulted in short term flooding in low lying areas of the city. Unfortunately, most of these areas are occupied by the slum settlements, which are already vulnerable owing to other factors.
Indore City has a history of almost 300 years (see Table 1). It originated as a camp for traders and armies travelling from the coast to interior India. The historical evolution of Indore city is presented in the following Table.
TABLE (1): DEVELOPMENT HISTORY OF INDORE The Pre-Holkar Period
History of 300 years. Developed from a small settlement on the bank of river Saraswati, now known as Juni Indore
In year 1728, Maratha king Bajirao Peshwa, handed over kingdom to Malhar Rao, who ruled from Indore between 1728 and 1766. At that time, the total area covered was 28.5 Parganas5. The area was developed like a cantonment, and later it took shape of a commercial city. The region emerged as an important military camp and a trade centre, owing to its location.
The two rivers Khan and Saraswati played an important role in the development of the city. These rivers had an immense value in medieval times, when the settlement was established as a defence fortification.
Phase I
This area was owned by Brahmins. Even after so many years the important religious places like Shani Mandir, Navagriha Mandir are still there in well maintained condition.
The Holkar Capital
In the reign of Holkars, the area developed around their palace Rajwara. In 1818, Holkar’s capital was shifted to Indore. Previously it was in Maheswar.
Establishment of Holkar’s capital at Indore provided new forces for development of the city. Phase II
In 1912 Mr. H. V. Lancaster was invited, by the local body to advice in respect of improvement and expansion of the city especially with regard to the better sanitary conditions in the residential
5
areas.
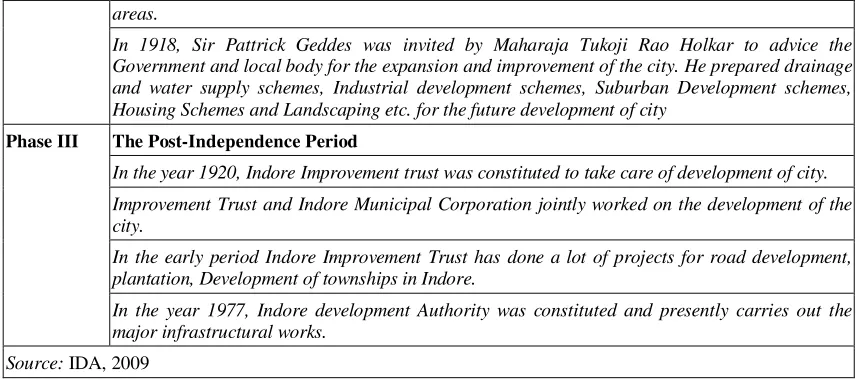
In 1918, Sir Pattrick Geddes was invited by Maharaja Tukoji Rao Holkar to advice the Government and local body for the expansion and improvement of the city. He prepared drainage and water supply schemes, Industrial development schemes, Suburban Development schemes, Housing Schemes and Landscaping etc. for the future development of city
The Post-Independence Period
In the year 1920, Indore Improvement trust was constituted to take care of development of city. Improvement Trust and Indore Municipal Corporation jointly worked on the development of the city.
In the early period Indore Improvement Trust has done a lot of projects for road development, plantation, Development of townships in Indore.
Phase III
In the year 1977, Indore development Authority was constituted and presently carries out the major infrastructural works.
Source: IDA, 2009
The city also has the advantage of being strategically located with easy access to most cities of central, western and north India. The history of industry in Indore dates back to 1886 when the first textile mill was started (Agnihotri, 1994). Fertile black cotton soils made Indore an ideal location for agro industries, especially after Independence and formation of Madhya Pradesh state. The city is also catching up with the pace of Information Technology Enabled Services (ITES). Pitampura (20kms from Indore) and Dewas (32kms from Indore) are well established Industrial areas. Indore is also known in the map of Asia as one of the largest producer of Pharmaceuticals like basic and bulk drugs formulations, tablets, capsules etc. There are more than 1,000 small and big Pharmaceutical units located in and around Indore.
1.2 Demography
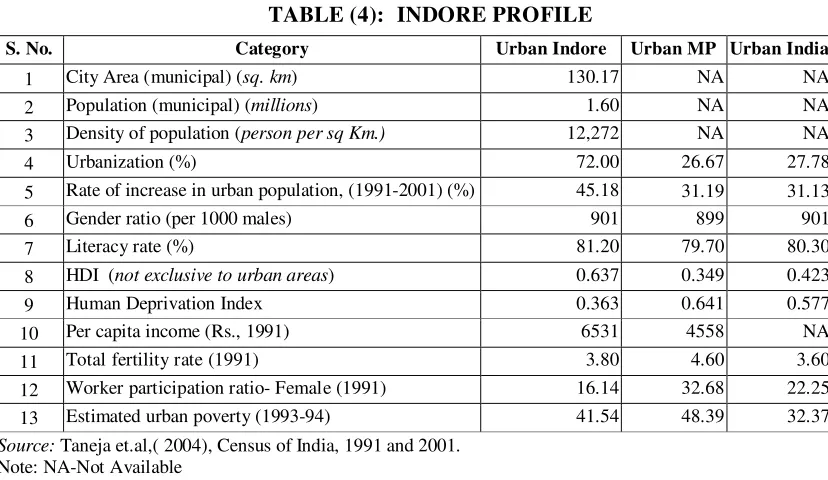
Indian demography shows a 2-3-4-5 syndrome. In the last decade, as India grew at an average annual growth rate of 2%, urban India grew at 3%, mega cities at 4% and slum populations rose by 5% (Taneja et.al.,2004). Both the “push and pull” factors, acting in synergy, have made this situation more critical, especially for Indore, which has large semiarid, drought-prone hinterland with iniquitous land holdings. The urban growth is especially alarming for Indore, where the infrastructure growth has not been able to match with the rapid population growth. Table (2) indicates that the population of Indore is 1.6 million according to 2001 figures which is likely to rise to 2.5 million and 3.6 million by 2011 and 2035 respectively (Indore CDP, 2006). This would incorporate neighbouring settlements in the region (ICTSL, 2006).
TABLE (2): AREA AND POPULATION OF INDORE OVER THE YEARS S. No. Year Area (IMC) in sq. km Population in millions
Source: Census data of respective years, Taneja et.al,( 2004)
TARU/ACCCRN Indore City Level Vulnerability Analysis, Phase-I June 2009 3
noted that the city limits have grown and the population of the outgrowths is enumerated in to the city population.
The Table (1.3) presents the growth of slum population in Indore city with respect to the total population of the city. It shows that proportion of slum population to the total city population has actually decreased in 2001.
TABLE (3): SLUM POPULATION IN THE CITY OF INDORE
Year Total pop. of together, but the female participation in the work force is sizably reduced when we compare Indore and the whole of Urban MP. As evident from Table (4), the rate of increase in urban population is quite high as compared to urban MP. There is lack of other large cities like Indore in MP where people can actually migrate in search of livelihoods. Mumbai and Surat are other destination for people migrating from rural MP.
During the 1991-2001 period, Indore registered a high population growth of 40%, (CDP, 2006), though conflicting figures put it at 47% (1991 -2001) (WaterAid, 2006). The district of Indore has more than 70.1% of its population living in urban areas (total population of 1,597,551) (WaterAid, 2006).
5 Rate of increase in urban population, (1991-2001) (%) 45.18 31.19 31.13
6 Gender ratio (per 1000 males) 901 899 901
12 Worker participation ratio- Female (1991) 16.14 32.68 22.25 13 Estimated urban poverty (1993-94) 41.54 48.39 32.37 Source: Taneja et.al,( 2004), Census of India, 1991 and 2001.
The population growth has increased the pressure on the land and infrastructure. The CDP reports that the growth of Indore during 1974-1991 was below the density proposed in the Development Plan (1974-1991). High density in some areas reflects a skewed spatial distribution with dense pockets in the Central Business District area and in the slums coexisting with sparsely populated fringe areas.
As the main city of Madhya Pradesh state, Indore has a population of 2.2 million with a high annual growth rate of 4.6 percent. Being located in the catchment boundary6, it doesn’t have sufficient water resources to support a million plus city. Although the city population doubled from 1971 to 1991, the slum population almost tripled over the same period. In 1991, the population of the city was nearly 1.2 million out of which slum dwellers accounted for 0.35 million (WaterAid, 2006). There are significant discrepancies in slum population reported by various studies,
Most of the immigrants come from neighbouring Nimar, Dhar regions and neighbouring dry regions of Maharashtra state, where poverty is quite high. A good number of these people are un-skilled daily wage labourers, while around 20% of the people are also engaged in semi-skilled and semi-skilled labour. Some of the people are also engaged in micro-enterprise activities in the city like vegetable vending, etc. Females from the slums are mostly engaged in domestic help.
1.3 Economy
During the early and middle periods of Indore’s city history, opium trade was the important lifeline of this area (until the beginning of 20th century). The first textile mill in Indore during end of the 19th Century was followed by several others in the early 20th century which boosted employment in Indore. Large cotton growing hinterland of the Malwa and Nimad regions supported these industries. As the relationship between Indore and Ahmedabad (the other textile capital of India) grew, Indore flourished under the Gujarat’s influence.
When the large scale textile industry declined in India, Indore also saw a drastic reduction in the mills from 1985–1991. The closure of six mills, the backbone of the city’s economy, changed the economic and social environment of the city. Industrial slums that had mushroomed around the mills are now in worse condition than before, with most of the male residents of these areas dependent solely on whatever they can earn on a day-by-day basis. Consequently, women have ventured out to work and are active wage-earning members of families. (Taneja et.al, 2004). Majority of the people in-migrating from the nearby areas with low levels of education are unskilled workers taking the level of unskilled workers in the city to increasing heights. Large underdeveloped and drought-prone hinterland creates push factors while Indore is only first destination for most of the unskilled and semi-skilled labor force.
Located at the cross roads of Western and Central India, Indore has been the hub of trade and commerce. The present economy of Indore basically revolves around industries and trade. Though the city’s economic output is significant, employment opportunities are mostly limited to skilled jobs except for construction, domestic help and transport sectors. The main industries include textiles, food processing (Soya, sunflower and grams), electrical machinery and appliances, pharmaceuticals and automobile ancillaries in medium and large industries sectors. Indore also accounts for one third of the total Namkeen (Variety of gram flour snacks)production of the country. Due to its trade and industry, it is sometimes referred to as
Mini Bombay.
6
TARU/ACCCRN Indore City Level Vulnerability Analysis, Phase-I June 2009 5 1.4 Municipal Administration
The core city is administered by the Indore Municipal Corporation (IMC) which is entrusted with construction and maintenance of the roads water, drainage, sewerage, transport and street lighting solid waste management along with slum development and other city administration functions. The IMC is governed by the provisions of the Madhya Pradesh Nagar Palika Nigam Adhiniyam, 1956. Indore city is divided into 69 wards. These wards have been further grouped into 14 zones for administrative purposes. The Mayor is the Chairperson of the council and is elected through direct election by the citizens of the municipal area. The Mayor appoints a 10 member Mayor-in-Council, with each member overseeing the functioning of one Advisory Committee (AC) of the Corporation. Each AC consists of nine councillors and member of the IMC serve as their Chairman. The principal functionary of the corporation is the Commissioner and his position is the only executive position (other than that of Mayor, Mayor-in-Council) that has statutory standing. Zonal Officers are appointed to head each zone and they report directly to the Commissioner. The constitution of Ward Committees is required by law. but this has not yet taken place (NIUA, 2009).
Indore development Authority (IDA) has been established through Notification under Section 38 of M.P. Nagar Tatha Gram Niwesh Adhiniyam 1973 to:
Implement the proposal in the Development Plan.
Prepare Town Development Schemes for planned development.
Acquire and develop the land for the purpose of expansion or improvement of the Planning area.
The IDA is entrusted with urban development of the core and peripheral areas. New area development and building new colonies are the main activities of the IDA along with construction (roads, flyovers, gardens) within the city limits. While most of the new developments and income from sale of new buildings are within IDA, it has sufficient resources, while IMC’s revenues come from various taxes, which is insufficient to match the expenses. Up to recently, like the other municipal corporations across the country, the IMC also had revenue deficits as is evident from Table (5). It has significantly tried to improve on the front since urban reforms, which is supported by the state and central government funds.
TABLE (5): IMC BUDGET SUMMARY FOR YEAR 2007-2008 (million Rupees)
Revenue Surplus(+) / Deficit(-) 10,72.498 8,57.932 5,04.685 5% of Total Receipts Transferred to General Reserve 1,86.639 1,81.167 1,00.598 Net Revenue Surplus(+)/ Deficit 8,85.859 6,76.765 4,04.086 Capital Surplus(+) / Deficit(-) -11,52.07 -9,87.772 -6,07.182 Net Surplus(+) / Deficit(-) -2,66.211 -3,11.007 -2,03.096 Source: Indore Municipal Corporation (IMC), 2009.
IMC issued Municipal Bonds, in 2001, for Rs. 100 millions to improve roads of the city with the State Government providing guarantee to the bonds. Though there have been significant investments in the local service delivery programmes by the state government supplemented by the donors (mostly through intervention in the slums), the situation seems to have improved a bit, but the huge pressure on the resources neutralise many of these achievements. The increase in the influx in the city requires major capacity addition to water supply, sewerage and transport networks. Though, in this context the Narmada Phase III water supply project seems to bring some relief in water supply sector, it comes with additional operation and maintenance (O&M) costs (Narmada Phase III water costing about Rs 12/KL), which may not be affordable by large sections of lower middle class and poor. Cross subsidization, as practiced so far, would require sufficient income from industrial and upper class users, who can pay at higher rates to meet deficits arising out of subsidisation. It is going to be a challenge for the IMC and state government, in case cross subsidisation system is unable to create income surplus.
1.5 Growth
The present planning area of the city is 504.87 sqkm (Indore CDP, 2006) which includes the IMC area too. Indore city has 604 Poverty Pockets (PP) of which only 229 have been notified by Municipal Corporation of the City (WaterAid, 2006).
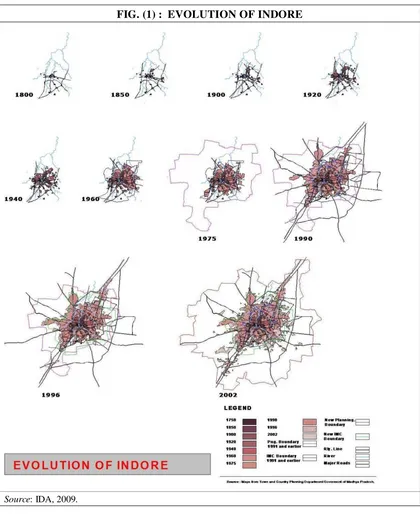
The map of the Indore city in Fig (1.1) over a period of time captures the significant expansion of the city since its inception. As is evident, there has been a substantial/noticeable increase in the area covered since 1990s. This becomes all the more important in the context that it is the most prominent city in Western MP with employment avenues, surrounded by underdeveloped hinterland with seasonal and scarce labour demand. An analysis of the slum population during the present study brings forth this point that the maximum migration has been from MP rural areas.
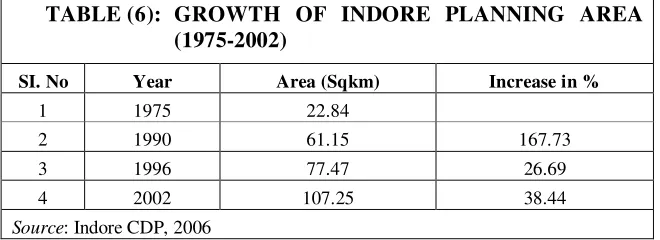
TABLE (6): GROWTH OF INDORE PLANNING AREA (1975-2002)
SI. No Year Area (Sqkm) Increase in %
1 1975 22.84
2 1990 61.15 167.73
3 1996 77.47 26.69
4 2002 107.25 38.44
Source: Indore CDP, 2006
TARU/ACCCRN Indore City Level Vulnerability Analysis, Phase-I June 2009 7 FIG. (1) : EVOLUTION OF INDORE
Source: IDA, 2009. 1.6 Resource base
1.6.1Water
east of Indore, but it is already exploited by Ujjain and Dewas towns. The Khan River flows through the city from south to north and meets Kshipra in Ujjain. It is small seasonal stream and the water is polluted.
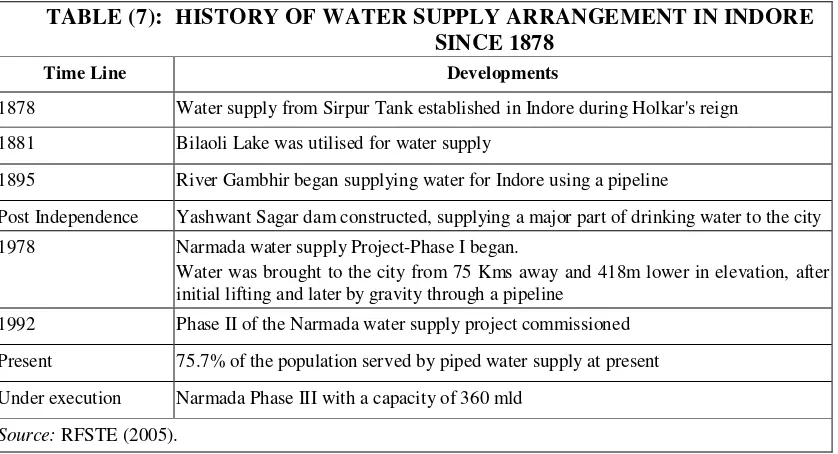
Indore depends on a variety of sources of water including reservoirs across local streams, Narmada River based pumping systems (2 phases already working) and ground water. Table (7) shows the various sources of water supply on which Indore has been dependent since 1878.
TABLE (7): HISTORY OF WATER SUPPLY ARRANGEMENT IN INDORE SINCE 1878
Time Line Developments
1878 Water supply from Sirpur Tank established in Indore during Holkar's reign 1881 Bilaoli Lake was utilised for water supply
1895 River Gambhir began supplying water for Indore using a pipeline
Post Independence Yashwant Sagar dam constructed, supplying a major part of drinking water to the city 1978 Narmada water supply Project-Phase I began.
Water was brought to the city from 75 Kms away and 418m lower in elevation, after initial lifting and later by gravity through a pipeline
1992 Phase II of the Narmada water supply project commissioned Present 75.7% of the population served by piped water supply at present Under execution Narmada Phase III with a capacity of 360 mld
Source:RFSTE (2005).
The city witnessed unprecedented population growth every time its water supply system was augmented. The old township depended for its water on Pipaliyapala, Sirpur, Limbodi and Bilawali tanks and a number of open wells. The gravity flow of two million gallons of water per day (MGD) continued from these tanks till about 1989. The residential area had a separate system of water supply of 0.3 million gallons a day from a jack well in Khan River and a bore well constructed in later years.
In order to meet the growing needs of the city Narmada phase-I was commissioned in 1978, designed for a projected population levels for 1991(0.9 million), which was attained in 1981 itself. To meet the growing water needs, Narmada Phase-II was proposed, which finally became operational in 1990. Presently two phases of Narmada Water Supply Scheme are working.
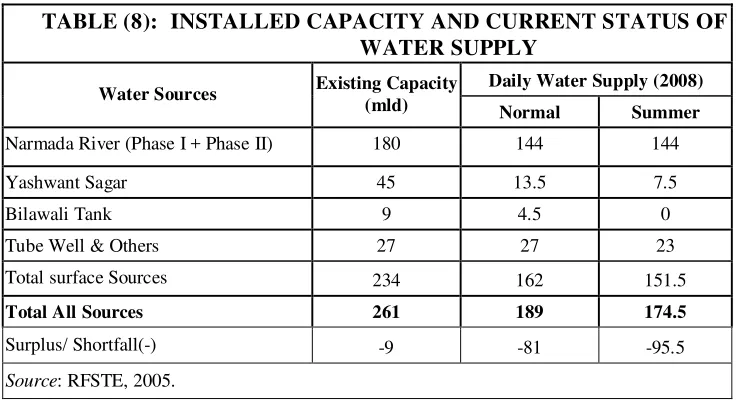
Water scarcity: With daily water requirement of the city at nearly 270 million litres per day (mld), the IMC has to manage a deficit of about 80 mld during normal times and more than 95 mld during summers (Table 8). The distribution network is ageing and suffering from low maintenance and a lack of investments. Unaccounted for water constitutes 52 per cent of the total water production (NIPFP, 2006). About 20,000 illegal connections and leakages of about 25 percent account for the high unaccounted for water losses. It is reported that a significant proportion of domestic users have refused to pay water taxes due to unreliable supply, which has compounded the problem.
TARU/ACCCRN Indore City Level Vulnerability Analysis, Phase-I June 2009 9
mix of pipes including PVC pipelines of various vintage, which tend to get damaged with age.
The water supply is intermittent (less than one hour on alternate days) and faces acute water shortages during summers (supply reportedly less than 80 lpcd). Even the households with municipal water connection only receive intermittent supplies on alternate days in summers.
TABLE (8): INSTALLED CAPACITY AND CURRENT STATUS OF WATER SUPPLY
Due to high population growth and lag in commissioning of additional sources, the water shortage in the city of Indore has become acute since last 10 years. Surface sealing by roads and buildings and planning negligence have resulted in water logging and temporary flooding and also reduction in ground water recharge. The problem of pumping water from far (about 70 km away with a lift of nearly half a km) is compounded with the power shortages faced in the district.
In some of the low income settlements, people reported to have not paid the water supply bills since last 15 years. Non-payment is either because of the frustration of improper supply received by the HHs or the political patronage enjoyed by the residents. Though some HHs reported to have received the pending bills amounting to Rs. 15,000/- and more, but show their inability to pay. These responses are also accompanied with suggestions that if the complete system of piped water supply system is revitalised, people will be willing to pay for the improved services. The water supply available through stand posts in the low income settlements is not paid for. Reported instances of people using individual plastic pipes to fetch water from the standposts directly into the HHs were evident in some of the settlements. In some of the settlements, people had reportedly asked the ward member not to send tankers as it leads to scuffles. Reports of people using extra pumps to draw water from the municipal supply are common. This complex set of interrelated problems in the system challenges any possible technical solutions like improving supply or increasing water rates to match the water supply costs.
Groundwater: Indore city is located in the Deccan Trap volcanic region characterized by less permeable black cotton soils underlain by alternate layers of massive and fractured volcanic rocks7. Bore-well yields are highly variable across the city. The soil depths are variable across the city resulting in high lateral changes in recharge potential across the city. In Back cotton soil areas, normal measures for recharging like decreasing the proportion of impermeable areas (on roads and house yards) are unlikely to yield results.
Public Health Engineering (PHE) and IMC had dug more than 3,000 bore-wells since 1965-66 but met with moderate success with no bore-well yielded more than 25,000 litres per hour (lph) of water (RFSTE 2005). People facing the shortage of water supply also resorted to digging bore-wells, but with the ground water level falling, this did not provide enough respite to the households in some of the less yielding parts of the city. Only in some parts of the city, water well drilling is feasible now, but the residents still are investing on deepening and drilling of new bore wells, since the choices are limited.
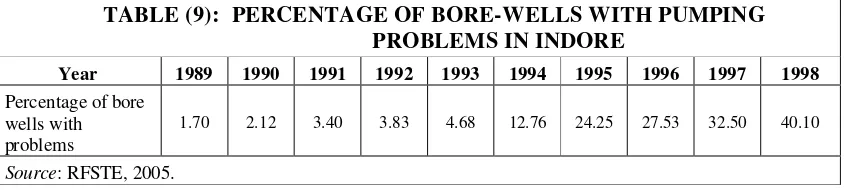
The Central ground Water Board estimates show that the ground water extraction is 172% of the natural recharge. Chasing the ground water by competing demands across the colonies has resulted in uncertainties in ground water as a reliable source to cope with municipal water supply. The bore-wells are dug by individual households/colonies or by IMC. It is reported that there are about 50,000 private bore-wells of which only about 20,000 are registered. The IMC’s groundwater supply is about 27 mld from 3,373 energised8 bore-wells and 431 Hand pumps which supplement water requirements of many settlements. The status of the municipal bore-wells in the city is presented in Table (9). Most of the municipality’s 3,000 bore wells are reportedly drying up.
TABLE (9): PERCENTAGE OF BORE-WELLS WITH PUMPING PROBLEMS IN INDORE
There have been reported cases in which people have to spend sleepless nights waiting for the tankers. Newspapers reports carrying such stories of water timing affecting the daily schedules of the households is a regular feature especially in the summer season. Several water conflicts were reported since early summer. Studies indicate that about 70 percent of the bore wells in Indore are affected by faecal contamination. Also, there have been reports of excessive fluoride in ground water.
ADB water project: Besides the Narmada Phase III water supply project (capacity of 360 mld), augmentation of Yashwant Sagar with ADB loan is being commissioned. The Yashwant Sagar augmentation project aims to restore the reservoir's original water supply capacity of 38 million litres per day. Whether Narmada Phase III water supply is going to be available in the near future at affordable costs remains to be seen, due to high O&M costs and
7
Hydro-geological description provided is simplified.
8
TARU/ACCCRN Indore City Level Vulnerability Analysis, Phase-I June 2009 11
legal battles over the construction of Maheshwar dam9. The Narmada Phase III will depend on commissioning of Maheshwar Dam to fill the intake works, which is currently under litigation.
Local Options: Many large Indian cities have initiated statutory measures and financial incentives to promote rain water harvesting. Indore city, in a Gazette notification published by the government made it mandatory for builders raising construction on plot area of more than 250 square meters to adopt Rainwater Harvesting Systems (RWHS). There is also an offer of six per cent rebate on property tax to those installing RWHS while IMC offers incentive of Rs 1,000 for setting up RWHS. IMC has also made it mandatory to issue work completion certificate to the builder only when RWHS is installed.
Since the city generates nearly 150 mld of sewage, there are opportunities to recycle wastewater after treatment for end-uses requiring low quality water. This has not been explored so far due to issues related to sewerage systems.
Sanitation & Sewerage: The city lacks a proper sewage collection and disposal system. A major section of the population uses septic tanks and the rest have to depend on unhygienic disposal systems ranging from direct disposal to streams or through short distance sewerage lines. Even the partially treated effluent of the septic tanks is allowed to flow to the open drains along with other untreated sewage directly from toilets. There are about 1,465 seats of public toilets constructed in the city attached to septic tanks; most of them are poorly maintained. The CDP also reports of 1,000 dry pit latrines still in use in the city and about 5% of the population resorting to open defecation10. It is quite possible that the ground water recharge as well as bore well contamination is closely linked with septic tanks and lack of sewerage system, as observed in other cities.
Until recently, Indore did not have sewage treatment plant(STP) and most of the sewage was disposed into local streams. Currently, there are two operational Sewage Treatment Plants (STP) in Indore. One constructed in Khan Nala (river) has capacity to treat 78 mld water based on Upflow Anaerobic Sludge Blanket11 (UASB) technology. Only 55% population has access to sewerage network and 80% of sewers are underutilized for want of maintenance (NIPFP,2006). It has been working since 2006. Since this plant uses a mix of domestic sewage and toxic industrial wastewater, it has been facing problems of stabilization of methanogenic bacteria and is therefore unable to produce gas.
The second STP, built on Bhamori Nala, with installed capacity of 12 mld was commissioned on 2007. Both the projects were installed under National River Conservation Development plan (NRCD). Both STPs are reportedly getting less sewage than their installed capacity due to lack of sewerage systems across the city. With the result, the ground water is reported to be suffering from water quality problems. A part of the treated water is used in construction work like roads and buildings. IMC also uses this water to irrigate gardens and rest of the treated wastewater flows into the khan river.
9
Maheshwar dam across Narmada is necessary for filling the water up the intake wells of the Narmada Phase III. This project was planned in 1978 and has seen several changes in ownership, withdrawal of financing institutions and R&R controversies. The Madhya Pradesh High Court has given stay orders on construction activities due to R&R issues.
10
Actual numbers may be much more. 11
IMC is constructing another sewerage treatment plant in Shakkerkhedhi under JNNURM Project. The total capacity of this plant is 245 mld. Also, there are plans to install city wide sewerage system under JNNURM.
The drainage of the city is provided by two small rivers, Khan and Saraswati, which ultimately drain into the river Kshipra. Khan River, a tributary of Kshipra, rises near Umaria village about 11 km south of Indore and flows through the heart of the city. Clogging of these streams and their tributaries by solid wastes and encroachment has been causing flash floods affecting neighboring settlements.
1.6.2 Energy
Electricity is supplied through Madhya Pradesh State Electricity Board (MPSEB); which was restructured during the early parts of the present decade. The state witnessed acute shortage of electricity supply since late 1990’s. The situation deteriorated after the bifurcation of the state, where Madhya Pradesh lost most of its generating stations to Chhattisgarh. Even now, the electricity supply is a major issue in the rural areas, but the urban electricity supply has been significantly improved with only about two hour power cut during the water supply periods. This is done to prevent use of illegal household pumps, which are used to draw water directly from the municipal supply pipelines. The poor are given the subsidies and it is cross-subsidised by the industrial and commercial users. With the result, the MPSEB has no interest in providing incentives for electricity conservation measures in industrial sector. While most of the HHs has access to electricity, a very small fraction (15 percent) of the households in poorer settlements reportedly has indirect connection to electricity (Taru Pilot study, 2009). The power supply in the city is not satisfactory and is marred with irregular power cuts, with the problem accelerating in the summer season.
1.6.3Land
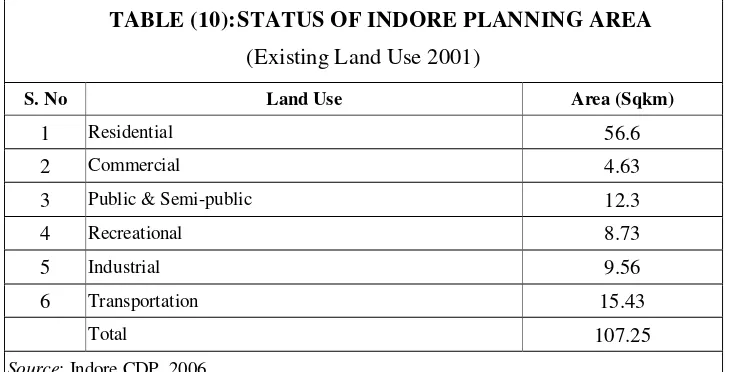
The present planning area of the city is 504.87 sqkm (Indore CDP, 2006) which includes the IMC area too. The planning area was revised and notified under sub section (2) of section 13 of the Act which came into effect from 28/06/2001. The total planning area of Indore is 504.87 Sqkm (Indore CDP, 2006). Out of this only 107.25 sqkm is the developed area, while the rest 397.62 is underdeveloped area. Table (10) below shows the land use pattern of the developed area in Indore.
TABLE (10):STATUS OF INDORE PLANNING AREA
TARU/ACCCRN Indore City Level Vulnerability Analysis, Phase-I June 2009 13
As per CDP of Indore, the development plan of Indore 1974-91 had proposed much more developed area, but none of them could be achieved on ground. The city termed as commercial and industrial capital of the state and also supports surrounding industrial areas of Pithampur in south west and Dewas in north, which is considered to be one of the reasons that the proposed Industrial area usage did not find many takers. Indore has overall population density 115 persons per ha. The CDP reports 1028 persons per hectare in Indore planning area (CDP, 2006) while another source puts it at 12,272 people per square kilometre (Taneja et.al, 2004).
1.7 Poverty
It is very difficult ascertain the present status of Below Poverty Line (BPL) families in the city (though that itself is has inherent inclusion and exclusion errors). The only official estimate available for number of BPL households is that of the Directorate of Food and Civil Supplies, Government of Madhya Pradesh, according to which 86,062 ration cards have been issued in Indore District as a whole (one card per family, data for 1997-98) and over two thirds of the slum families lived below the poverty line (WaterAid, 2006). Since BPL categorization is closely linked with financial benefits, it is a strongly contested domain among lower income groups.
1.8 Institutions
The important institutions responsible for providing services in the city are as follows: Indore Municipal Corporation (IMC)
Indore Development Authority (IDA) M. P. Public Works Department (PWD)
Indore City Transport Services Limited (ICTSL) Madhya Pradesh State electricity board (MPSEB) Madhya Pradesh Housing Board (MPHB)
Madhya Pradesh Town and Country Planning Office (TCPO) Madhya Pradesh Pollution control Board (MPPSB)
2 VULNERABLE GROUPS 2.1 Background data
A large portion of the city’s population/settlements are devoid of basic civic amenities or are in a just little better condition. This section of the population is the most vulnerable to any change which the city has to offer, or which the city undergoes. Vulnerability arises due to several factors.
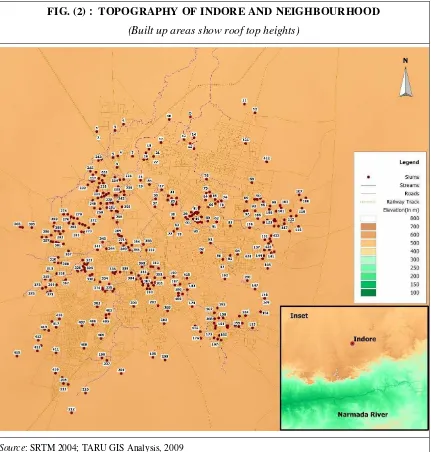
FIG. (2) : TOPOGRAPHY OF INDORE AND NEIGHBOURHOOD (Built up areas show roof top heights)
Source: SRTM 2004; TARU GIS Analysis, 2009
TARU/ACCCRN Indore City Level Vulnerability Analysis, Phase-I June 2009 15
location, occupation, living environment, housing structure, health and diseases, basic rights, displacement, access to education, assets, access to credit and tenure rights.
Box (1):Slum Networking Project Funded by DFID in Indore
The city’s slums were proliferating and the urban poor living in these faced the consequences of poor living conditions. It was in this scenario that the Indore Habitat Project was taken up in 1990, with the objective of reducing the serious deficit in urban shelter and services in Indore. The eight year project which was implemented in 183 slums demonstrated the potential of improvement of slums, rather than their clearance. Although the city population doubled from 1971 to 1991, the slum population almost tripled over the same period. In 1991, the population of the city was 1.25 million out of which slum dwellers accounted for 0.35 million. Slum networking is a method for integrated up gradation of the entire city using the slums as an urban net and not as isolated islands of deprivation.
Source: Taneja et al (2004)
3 VULNERABILITY STUDIES 3.1 Process
Pilot vulnerability surveys were conducted across different settlements representing important socio economic groups to understand broad issues related to current vulnerability and to further explore the possible climate change impacts. Based on the findings detail vulnerability studies will be undertaken in Phase 2 of the programme. This will be followed by large scale household and settlement surveys to explore the issues derived from the pilot surveys.
3.2 Identification of Sample Areas
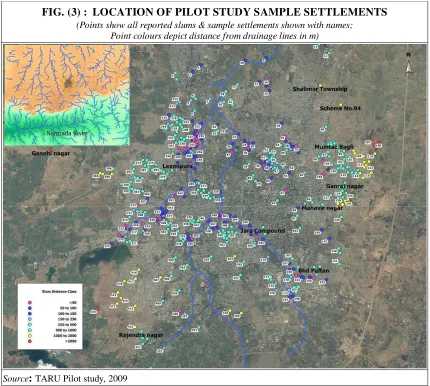
Mapping:The vulnerability survey was based on citywide mapping which was undertaken to identify different types of locations and contexts especially in regard to distance from risk sources like streams, and reservoirs, socio-economic group clusters, etc.
FIG. (3) : LOCATION OF PILOT STUDY SAMPLE SETTLEMENTS (Points show all reported slums & sample settlements shown with names;
Point colours depict distance from drainage lines in m)
Source: TARU Pilot study, 2009
TARU/ACCCRN Indore City Level Vulnerability Analysis, Phase-I June 2009 17
This exercise was followed by selection of different types of communities based on the spatial context, density and types of buildings and other parameters derived from interviews with city stakeholders and secondary sources.
3.3 Tools of Data Collection
Quantitative enquiry: Structured questionnaires were administered for each of the settlements and sample HHs reported above to elicit information on livelihoods, assets, resource use, risks, scarcity and other related issues. Disaster history and coping strategies were also explored. The following Table (11) presents the distribution of samples by socio economic groups and spatially.
TABLE (11):SAMPLE SETTLEMENTS SELECTED FOR PILOT STUDY
S. No. Community Reference location Type Core/
periphery Dominant occupation 1 Bhil- Paltan Musakhedi Slum Communities Core Govt. Job
2
Gandhi Nagar Bijasan Middle Class,
(Individual Houses) Peripheral Govt. Job/Business
3 Ganraj Nagar Khajarana Slum Communities Core Govt. Job/Unskilled worker
4 Luxmi-Puri Sangam Nagar Lower Middle Class Core Pvt Job
5 Mahaveer
Nagar, Kanadia Road Middle Class, (Flats) Core Govt. Job/Business
6 Mumtaz Bagh Ring Road Lower Middle Class Core Govt. Job/Unskilled worker
7 Jaora
Compound Police Apartments Middle Class, (Flats) Core Govt. Job
8 Rajendra
Nagar Dhanvantri Nagar
Middle Class, (Individual
Houses) Peripheral Govt. Job/Pvt Job
9 Scheme No. 94
Near Bombay Hospital
Middle Class, (Individual
Houses) Peripheral Govt. Job/Pvt. Job/ Business
10 Shalimar
Township Scheme No.78 Middle Class, (Flats) Core Govt. Job/Pvt Job
The enquiry at community level focused on understanding the context and to identify stratification within the community. A set of households in each of the community were selected to get a representative profile of the community.
Sample size: A total of 60 households across 10 communities were covered. The selection was done to capture the issues of the city as a whole and not a particular kind of settlement or a general population size. The heterogeneous selection ensured that each of the class in terms of Socio economic status, location from the city got suitable representation.
3.4 Findings from the study
The house is one of the most important assets for the urban households. Also, land ownership records are important for getting access to a variety of urban services as well as an important asset for access to formal credit. The study collected information on type, size and ownership of houses across the settlements.
TABLE (12):HOUSE CLASSIFICATION BY WALL TYPE AND ROOF TYPE
With the construction costs of the pucca houses (concrete roof with brick walls in this case) being the highest, ownership of these houses are the life time aspirations of lower and middle classes in India. Households spend significant part of their life time savings on houses. The floor area indicates the affordability levels as well as thermal comfort of the households. As seen in the following Table (13), floor area of the HHs in settlements shows a large diversity with almost 35 per cent of the HHs across settlements having less than 499 sqft floor area. Out of all households, 10 percent have less than 200 sqft floor area. About 28 percent of the sample households reported floor area between 500-999 sqft. About 20 percent of the HHs reported floor area of more than 1,500 sqft, representing the upper middle class.
TABLE (13): FLOOR AREA OF THE HHS ACROSS SAMPLE SETTLEMENTS (in sq.ft) rented accommodation as presented in Table (14). While the city has seen progress in the field of real estate developers but still single separate houses are still common in the city, which is rapidly giving way to multi-storied flats, especially in the peripheral areas of the city. The city core is still dominated by two to three storied houses, which will slowly transformed to multi storied flats, which in turn will increase pressures on essential services including water supply, sewerage and transportation.
TARU/ACCCRN Indore City Level Vulnerability Analysis, Phase-I June 2009 19
Source: TARU Pilot study, 2009
In the slum settlements where the land tenures are found to be disputed, single houses with less investment is seen as cautious strategy. About 27 percent of the sample households live in multi-storeyed flats, but the proportion is bound to grow with the increasing population and the space crunch getting more acute. Simultaneous growth of densely packed informal houses with uncertain tenure rights, best describes the shelter strategies adopted by the low income group. This housing pattern is because of the support, safety, belongingness that the close knit community provides and lower costs.
Dependency ratio: The ratio of nonworking members to working members is defined as dependency ratio. In rural areas, a variety of livelihoods depend on seasonal or part time occupations or natural resources providing incomes for even marginal workers. In urban areas driven by cash economy, the distinction between workers and non-workers is rather distinct. Earning a steady wage/profit based income is essential in the absence of other means of subsistence (animal husbandry, hunting/gathering). The following Table (15) presents the dependency ratio among sample households across the sample settlements.
TABLE (15):DEPENDENCY RATIO ACROSS SETTLEMENTS (in percents) Name of the Settlement 0-100 100-200 200-499 500-700
Bhill Paltan - 17% 50% 33%
Source: TARU Pilot Study, 2009
Note: Dependency Ratio has been calculated as (Non-Working Population/Working Population)*100.
among low income HHs. During disasters including flash floods, the income of the earning members can be lost resulting in distress to the whole family and informal credit is the only option in such cases, which can result in prolonged periods of indebtedness. In some stress situations like water scarcity, extra hands without formal work can be useful in non-remunerative activities like fetching water from longer distances.
Responses across the settlements have shown that male earning members are responsible for fetching water from the far off places and they often have to compromise on their livelihood earning time. This is largely due to perceptions regarding safety of female members in taking water transportation tasks from distant sources beyond their immediate community. Water needs cannot be compromised, resulting in regular income losses, especially for low income informal working classes. This holds true for the female working/non working members too, making them either compromise on certain productive activity or earning livelihood (e.g. Daily wage or domestic labour).
Education status: Education and skills are one of the determinants of incomes in urban areas. The following Table (16) presents the educational status of sample households.
TABLE (16):EDUCATIONAL STATUS ACROSS SETTLEMENTS* Name of the Settlement Illiterate Up to 5th 5thto 10th 10th-12th Graduate Post
Note: * persons above Age 14
Source: TARU Pilot Study, 2009
As indicated in the above table, the slum and low income settlements are characterized by low education levels or illiteracy. Most of the illiterate people are the migrants from rural areas with little access to formal education.
Employment: Table (17) presents employment profile of the working population across the settlements. While 53 percent of employed persons reported having Government jobs, 23 percent reported private jobs. Private jobs are followed by the unskilled labour/vendor/worker population, which is represented by 11 percent of the sample HHs across the settlements
TARU/ACCCRN Indore City Level Vulnerability Analysis, Phase-I June 2009 21 TABLE (17):EMPLOYMENT PROFILE ACROSS SETTLEMENTS Name of the settlement Business Govt. Job Pension Private Job Vendor/Unskilled labour
Bhill Paltan - 100% - - -
Disaster Risk exposure: Even though Indore is located in the upper catchment very near to the watershed boundary, occasional flash floods have been reported since last two decades. The flood risks have reportedly increased due to extreme precipitation events, which have reportedly become more common. The exposure has also increased with many informal settlements and encroachments mushrooming along the flood prone areas and very poor/nonexistent solid waste disposal system. The construction of bridges has further compounded the problem in some cases. The following Table (18) presents the flood events reported by the households across the city. Houses in the low lying areas of the settlements adjoining the drains reported the floods/ water logging problems. Some of them recalled the sheer velocity of the flood waters that gushed through the houses inflicting major damage.
TABLE (18):REPORTED FLOOD EVENTS ACROSS SETTLEMENTS Year
(or made so because of the increased heights of the newly constructed roads). Even in areas not prone to floods, prolonged water logging due to lack of drainage creates hygiene related problems. Poor drainage across the city, especially in the low income settlements has been the main cause for vector borne diseases. In some cases, this has also lead to contamination of ground water.
Water Sources: The source of drinking water across settlements shows a mix of arrangements. About 42 percent of the HHs reported dependence on ground water as main or alternate arrangement. 65 percent of the HHs reportedly has access to municipal supply as is evident in Table (19). The lack of reliability on a particular water source has resulted in people resorting to multitude of options. The HHs opt for these options depending upon the capacity to pay and access to other resources.
TABLE (19): MULTIPLE WATER SUPPLY ARRANGEMENTS ACROSS SETTLEMENTS
Water Supply Sources Name of the Settlement
Ground Water Municipal Tanker Stand post
Bhill Paltan - 67% 33% -
Source: TARU Pilot study, 2009
TARU/ACCCRN Indore City Level Vulnerability Analysis, Phase-I June 2009 23 TABLE (20):MUNICIPAL WATER SCARCITY ACROSS
SETTLEMENTS
Name of the Settlement March Onwards April Onwards No scarcity No Supply
Bhill Paltan 67% - - 33%
Source: TARU Pilot Study, 2009
About 83 percent of sample HHs reported of having to spend one or more hours in the collection/ management of water during the scarce months (see Table 21). Almost 15 percent of the respondents reported to have spent more than 3 hrs during the water scarcity months.. This implies that one or more members of the household have to put in extra time apart from their daily routine. In most cases, the water fetching from nearby sources is done by women, but transport of water through bicycles is generally done by men. The times spent in collection and management of water has also resulted in earning members getting delayed for their work. The situation reportedly has been so acute that there have been cases of regular quarrels. People have tried to get accustomed to the situation resorting to different options all the time. The reported time spent by HHs in water management across the sample communities in normal months is presented in the Annex(C).
TABLE (21): TIME SPENT BY HHS IN WATER MANAGEMENT IN SCARCE MONTHS (in hrs)
Though there was difference in the time spent in the scarce months and the non scarce months, but still a sizeable section of the population spent more than two hours in the collection of water (23 percent in non scarce months and 33 percent in scarce months) as seen in Table (21) &Table (22). This speaks of the gravity of the water shortage problem in Indore. The reported time spent by HHs in water management across the sample communities in normal months is presented in the Annex (B).
TABLE (22): TIME SPENT BY HHS IN WATER MANAGEMENT IN NON-SCARCE MONTHS (in hrs)
Source: TARU Pilot study, 2009
The problem of water shortage is seen across settlements and is not restricted to specific areas. The people according to their capacity and the availability of space resort to different measures which include installing underground storage system, pumps, overhead water tanks and increasing the number of vessels in the HHs. Table (23), shows that 65 percent of the total respondents reported underground storage in their houses, while 42 percent of the HHs had overhead water tanks. Overhead water tanks require pumps and were mostly reported from middle and upper SEC settlements like Mahaveer Nagar, Rajendra Nagar, Scheme 94 and Shalimar Township. The water scarcity related coping measures across the sample communities is presented in the Annex(D).
TABLE (23): WATER STORAGE ARRANGEMENTS TO COPE WITH WATER SHORTAGE
TARU/ACCCRN Indore City Level Vulnerability Analysis, Phase-I June 2009 25 TABLE (23): WATER STORAGE ARRANGEMENTS TO COPE WITH
WATER SHORTAGE Name of the Settlement Underground
storage
Source: TARU Pilot study, 2009
Poor HHs, either due to the paucity of funds/space manage to have drums/big containers or increased number of small vessels to maximize the water storage. These are kept either inside the house if there is space or outside, in case the house is congested, as in case of slums and informal settlements. The settlements with access to overhead tank and pump are supposedly well off localities.
Box (2):Municipal Corporation in a Major Fix Over Water Supply
The municipal corporation is presently running into revenue deficit, (IMC, 2009). The infrastructural cost and the operation and maintenance cost of the municipal corporation is far higher than the water charge collection. The revision of tariff charges to cover O&M costs is politically sensitive issue, which the ULB is unwilling to address. The new project (Narmada Phase-III), being commissioned through the ADB loan of Rs. 490 Million (RFSTE, 2005), is a further burden on the exchequer and any expectation on positive side to match them with the tariff collection is open to reality check.
The bigger question remains whether Narmada-III will be able to meet the expectations of growing needs of the city (especially keeping in mind the previous experience with the Narmada-I and Narmada-II). The lessons from the past are manifold, if one gets to look back at them and learn from them.
A brief look at the past indicates that there have been certain key reasons, which have led the situation of water problem to such a level:
1. The plan has always been made keeping in mind the core of the city, and the periphery have been left out, and as earlier mentioned, the periphery is ever growing. The inclusion of IDA area (often with partial development of infrastructure) in to the municipal area complicates the matter further. 2. The estimated population of the city which was expected for 1991 was achieved in 1981. This is an
unavoidable facet, which one has to face keeping in mind the in-migration factor that is very strong in this city.
3. The city is located in a drought-prone region.. According to IMC and Central Ground Water Board (CGWB), while there are around 1,000 Rain Water Harvesting (RWH) structures in Delhi, their number in Indore is about 3,000. Yet the latter's groundwater level has declined by 4 meters in the past 20 years. Consequently, several bore-wells are rendered redundant every year. Though efforts to promote RWH began in 1999, the city did not have a good monsoon until 2003 also lead to increased exploitation of surface and groundwater. (RFSTE, 2005)
4. The total Municipal Water Supply from the various sources amounts to be 180 Million lit/day which is quite less in comparison to a computed requirement of nearly 270 Million lit/day. Moreover, floating population in the city, which is considerable, has not been taken into account as far as the water supply sufficiency is concerned.
5. The city has to support industrial areas of Pithampur and Dewas.
TABLE (24):REPORTED PAYMENT BY THE HHS TOWARDS ELECTRICITY USAGE (Rs/month)
Name of the Settlement 200-399 400-599 600-799 800-999 1000-1199 1200-1399 1400-1599
Bhill Paltan NA NA NA NA NA NA NA
Source: TARU Pilot study, 2009
Savings: It is very important to understand the saving habits of the people and the financial planning to understand the vulnerability. About 78 percent of the HHs across settlements reported to have some kind of saving habit apparently varying across the different SEC settlements. The recent spate of floods in the city has reportedly affected the financial planning of almost 38 percent of the HHs (see Table 25).
TABLE (25): SAVING HABIT & IMPACT OF FLOODS ON FINANCIAL PLANNING OF THE HHs
affected affected Saving Business Loss of days lost Income Maintenance problem Medical cost Increased
Bhill Paltan 50% - - - -
Source: TARU Pilot study, 2009
TARU/ACCCRN Indore City Level Vulnerability Analysis, Phase-I June 2009 27
As mentioned earlier, flood is not seen as major problem across the city but is restricted to stream bank slums. In the high and middle income settlements, this is seen as a problem of just water stagnation for few hours or a case of rapid run-off. So response of the respondents in this regard has not been forthcoming or clear. Table (26) gives an understanding of the type of infrastructure facility developed against floods.
TABLE (26): TYPE OF INFRASTRUCTURE/FACILITY BUILT/BOUGHT AGAINST FLOODS
Name of the Settlement Others Drainage Pipe Raised Plinth
height None
Source: TARU Pilot study, 2009
To counter the entry of water into the ground floor, 27 percent of the HHs reported raising of plinth heights. To remove the water from the vicinity, 3 percent of the HHs reported procuring drainage pipes (short term measure), but as such there is no major preparation across the city for resistance against floods.
TABLE (27): EXPENDITURE ON INFRASTRUCTURE/FACILITY BUILT AGAINST FLOODS
Investment ( in Rs.) Name of the Settlement
<1000 1,000-10,999 11,000-20,999 21,000-30,999 41,000-50,999
Bhill Paltan 100% - - - -
Mostly people living in the adjoining areas of the drains or low lying areas are affected by floods. The investment therefore on infrastructure built for protection against the floods is reported by only 20 percent of the sample HHs. Majority, (68 percent) of the HHs reported an investment of less than Rs 1,000 (Table 27).
In stark contrast to the reaction and preparedness of the people against floods, the response of the people towards water scarcity has been much detailed. This indicates that people are easily identifying with the problem of water scarcity but not with the urban floods. Also, water scarcity continues to bother almost throughout the better part of the year. As presented in the Table (28), almost 57 percent of the HHs reported buying drums/vessels for water storage. Drums/vessels cost less as well as take less space which is ideal for the people in the low income settlements. Only 20 percent of the sample households responded taking no measure against water scarcity. There has been general perception regarding decline in the groundwater table across the city, but since other options are limited, the bore-wells are still being dug or deepened.
TABLE (28): INFRASTRUCTURE/FACILITY BUILT TO COMBAT WATER SCARCITY
Source: TARU Pilot study, 2009
Average reported expenditure on coping with water scarcity lies somewhere at Rs, 500-600 with 40 percent of the HHs reporting expenditure between Rs 200-500. Households also reported to have made expenditure of more than Rs 5,000, mostly for the installation of overhead tanks or underground storage (see Table 29). New houses constructed in the city are generally provided with the underground and overhead water storage facility, which is easier to incorporate during the house construction. This is to be found to be common even in the low income settlements where people have the option of constructing pucca houses.
TABLE (29):COPING EXPENDITURE TO ADDRESS WATER SCARCITY (in Rs.)
Name of the Settlement 200-500 501-1000 1001-2000 2001-5000 >5001
Bhill Paltan 83% - 17% - - Gandhi Nagar 67% 33% - - - Ganraj Nagar 100% - - - - Jaora Compound 67% - - 17% 17%
TARU/ACCCRN Indore City Level Vulnerability Analysis, Phase-I June 2009 29 TABLE (29):COPING EXPENDITURE TO ADDRESS WATER SCARCITY (in
Rs.)
Name of the Settlement 200-500 501-1000 1001-2000 2001-5000 >5001
Mahaveer Nagar 17% - - - - Mumtaz Bagh 67% 17% 17% - - Rajendra Nagar - 17% 33% 17% 17%
Scheme 94 - - - 100% -
Shalimar Township - - - - -
Grand Total 40% 17% 7% 13% 3%
Source: TARU Pilot study, 2009
Disaster Management Plan: Though the initiatives in the city regarding the disaster management plan is often heard among the decision making and the planning circles, the community participation in the decisions making seems to be too low as is apparent form the response mentioned in Table (30).
TABLE (30): AWARENESS STATUS ABOUT DM PLAN OF THE CITY
Name of the Settlement Yes No
Bhill Paltan - 100%
Gandhi Nagar - 100%
Ganraj Nagar - 100%
Jaora Compound 17% 83%
Laxmipuri 33% 67%
Mahaveer Nagar 33% 67%
Mumtaz Bagh 17% 83%
Rajendra Nagar 67% 33%
Scheme 94 17% 83%
Shalimar Township 33% 67%
Grand Total 22% 78%
Source: TARU Pilot study, 2009