Summary Leaf gas exchange, temperature, and incident ra-diation were measured in situ for 20 mature trees of 12 decidu-ous species spanning a range of heights from 7.9 to 30.1 m and growing in the southern Appalachian Mountains. Air tempera-ture, water vapor pressure, total radiation, photosynthetically active radiation, and carbon dioxide concentration were also measured. Estimated mean, light-saturated net assimilation rates (µmol m−2 s−1) were: Quercus coccinea Muenchh. (10.3),
Q. prinus L. (9.9), Q. rubra L. (8.9), Betula lenta L. (8.1), Liriodendron tulipifera L. (7.9), Q. alba L. (7.6), Carya glabra Mill. (7.2), Acer rubrum L. (5.6), Nyssa sylvatica Marsh. (3.9), Cornus florida L. (3.5), and Acer pensylvanicum L. (1.7).There were significant differences in both net assimilation rates and quantum yield efficiencies between species, with the under-story species C. florida and A. pensylvanicum exhibiting lower net assimilation rates at saturation and higher estimated quan-tum yield efficiencies than the other species. Average tempera-ture and light decreased from the canopy top to bottom, whereas ambient CO2 concentration increased, and vapor
pres-sure and vapor prespres-sure deficits were inconsistent. We observed curvilinear effects of temperature and vapor pressure deficit on net assimilation response to light, and these effects varied by species. Errors in predicted net assimilation ranged from 1 to 3 µmol m−2 s−1 under the environmental conditions prevailing
during the study.
Keywords: Acer, Betula, Carya, Cornus, gas exchange, Liri-odendron, net assimilation, Nyssa, quantum yield efficiency, Quercus, radiation, solar radiation, temperature.
Introduction
During the past decade there has been much effort to develop and improve landscape- and regional-scale estimates of forest processes and productivity. Most estimates involve the cou-pling of detailed measurements of small-scale processes (e.g., respiration and photosynthesis) with spatially explicit estimates of both temporally stable and variable factors (temperature, soil water, atmospheric vapor pressure, forest composition and structure, and soil texture and depth) (e.g.,
Valentini et al. 1995). Scaling generally involves integrating a point-specific model of ecophysiology with appropriate spatial data, and the application of the model to the region of interest (Ehleringer and Field 1993). Process-based models have been developed for several spatial and temporal scales, including leaf- (Wang and Jarvis 1990) and stand-level models in conif-erous forests (Running 1984, Hari et al. 1991, Korol et al. 1991, Webb 1991), leaf-to-plant-level models for clonal poplar (Rauscher et al. 1990) and oak--maple forests (Reich et al. 1990), and generalized models that encompass large regions (Aber and Federer 1992, Rutherford 1993, Running and Hunt 1993). Scaling requires aggregation, often across species, stands, and larger geographic areas, because of finite compu-tational resources and limited knowledge of important physi-ological parameters. Accounting for inter-species variability in physiological responses results in extremely complex models (Bossel 1991); however, the guidelines for aggregation are often arbitrary because differences in physiological responses among species are poorly known. Most measurement and modeling efforts in mature forests have concentrated on coni-fers (Running 1984, Korol et al. 1991), particularly even-aged, single-species stands (Wang and Jarvis 1990). Physiologically based, large-scale models in mixed species forests have typi-cally used lumped-parameter approaches (e.g., Aber and Fed-erer 1992), where for example, the photosynthetic rate of the entire forest canopy is represented by a single equation.
Although direct physiological measurements in mature broad-leaved deciduous forests are limited because canopy access is difficult, studies have established within-crown vari-ation in environmental factors and their effects on photosyn-thesis (Aubuchon et al. 1978, Caldwell et al. 1986), relationships of annual ontogeny to net carbon fixation (Dougherty et al. 1979), and physiology during water deficits (Weber and Gates 1990). However, functional ecophysiology in most mature deciduous forest species and canopies must be inferred through syntheses of several studies and approaches. Glasshouse and field studies employing seedlings and saplings have established relationships between net carbon assimilation (Anet) and leaf conductance, temperature, nitrogen, water, and
other environmental factors, at least under controlled
condi-Estimates of net photosynthetic parameters for twelve tree species in
mature forests of the southern Appalachians
N. H. SULLIVAN,
1P. V. BOLSTAD
2,3and J. M. VOSE
41
Department of Forestry, College of Forestry and Wildlife, Virginia Polytechnic Institute and State University, Blacksburg, VA 24061, USA
2
Department of Forest Resources, College of Natural Resources, University of Minnesota, 1530 North Cleveland Ave., St. Paul, MN 55108, USA
3 Author to whom reprint requests should be sent 4
Coweeta Hydrologic Laboratory, Southeast Forest Experiment Station, U.S. Forest Service. Otto, NC 28763, USA
Received February 1, 1995
tions (Geis et al. 1971, Bacone et al. 1976, Hinckley et al. 1978, Bahari et al. 1985, Hanson et al. 1988, Parker and Pallardy 1988, Walters and Reich 1989, Mebrahtu et al. 1991, Ranney et al. 1991, Hollinger 1992, Kubiske and Abrams 1992, Masarovicova 1992, Epron and Dryer 1993, Walters et al. 1993, Abrams et al. 1994). Additional work has identified typical within-canopy environmental gradients (Geiger 1965, Rosenberg 1974, Aubuchon et al. 1978), and vertical variation in leaf area (Aber 1978, Hutchison et al. 1986, Vose and Swank 1990, Ellsworth and Reich 1993). However, little is known about (1) Anet in mature canopies, (2) the magnitude of
inter-specific differences in maximum Anet and quantum yield
effi-ciency, or (3) how Anet differs among species with respect to
environmental conditions (light, humidity and temperature). The objectives of this study were to: (1) measure in situ rates of net photosynthesis for several species in mature southern Appalachian forests across the range of light, air temperature, and humidity conditions typical for the region, (2) model the relationships between photosynthesis and these abiotic vari-ables, and (3) identify species groups that may be functionally equivalent when modeling mature canopy productivity at stand and larger scales.
Methods Sites and access
Research was conducted at the Coweeta Hydrologic Labora-tory (35°3′ N, 83°25′ W) located in the southern Appalachians of western North Carolina. Four plots were established in control watersheds, undisturbed since harvesting before 1927. The area is occupied by mature mixed broad-leaved deciduous stands (Swank and Crossley 1988). Plots were arrayed along an elevational gradient, spanning a range from 740 to 1430 m, with a concomitant range of climatic conditions. Average an-nual temperature ranges from 8.2 to 13.1 °C and precipitation ranges from 1800 to 2200 mm within the Coweeta watershed (Swift et al. 1988).
We erected a canopy access tower at each plot. Towers were approximately 30 cm in cross section with cross-braces welded at intervals of approximately 25 cm, allowing continuous ver-tical sampling of leaves within approximately 2 m of the tower. Towers ranged from 18 to 28 m in height, and allowed access to the top of the canopy.
Basic site-vegetation characteristics (Table 1) were deter-mined from measurements made in March 1994 on 0.07-ha circular plots centered on the canopy access towers. Height and diameter of all trees greater than 6.3 cm in diameter (at 1.3 m height) were measured.
Nitrogen was measured in leaves collected from all canopy levels of the sample trees. Leaves were dried at 70 °C for 24 h, ground, and N concentration determined with a Perkin-Elmer CHN analyzer. Specific leaf areas were determined from fresh litter fall, sorted by species, and used to calculate nitrogen concentration on a per unit area basis.
Approximately monthly during the growing season, soil water was measured by time-domain reflectometry, using four pairs of 25-cm rods placed within each plot.
Sample tree descriptions
Twenty trees comprising 12 species were accessible from the four towers (Table 2). Diameters and heights ranged from 6.4 to 70.4 cm and 7.9 to 30.1 m, respectively. Six Acer rubrum L. individuals were distributed among three sites, three Betula lenta L. trees and two Quercus prinus L. trees were present at two sites, and the remaining species were represented by a single tree: Cornus florida L., Fagus americana Ehrh., Nyssa sylvatica Marsh., Quercus alba L., Liriodendron tulipifera L., Quercus coccinea Muenchh., Quercus rubra L., Carya glabra Mill., and Acer pensylvanicum L. Dominant individuals such as Q. prinus, Q. rubra, Q. alba and L. tulipifera were only accessible near the top of the towers. The shade-tolerant spe-cies A. pensylvanicum, C. florida, and F. americana were only accessible at low to intermediate heights (5 to 10 m). Branch retention and narrow crown form allowed sampling over a 10 to 12 m height range (from mid- to upper-crown positions) for B. lenta, N. sylvatica and C. glabra. Acer rubrum was accessi-ble in various canopy positions. At the 840-m elevation plot, three small A. rubrum trees were accessible at heights between 5 and 8 m, at the 740-m elevation plot, one individual could be reached only in the upper-mid canopy (18 m height), and at the 1430-m elevation plot, subcanopy branching allowed access to A. rubrum from mid- to upper-canopy positions (10 to 18 m).
Carbon assimilation measurements
Estimates of carbon assimilation were based on gas exchange measurements with an open-flow infrared gas analyzer (IRGA, Model LCA III) and Parkinson Leaf Chamber (Analytical Development Corporation, Hoddesdon, England). Gas ex-change measurements were conducted from May through Sep-tember of 1992 and from June through SepSep-tember of 1993. Leaves were sampled from those accessible from the tower, and no effort was made to ensure or avoid repeat sampling of the same leaves on subsequent dates. Sampling was usually conducted between 1000 and 1400 h, although observations were made earlier and later on two days. Shaded leaves and, if possible, leaves in direct sunlight were measured at each sam-pling location. Leaves were maintained in their natural orien-tation during measurement to minimize disturbance and reduce variation due to light and temperature acclimation responses. Leaves were monitored until CO2 entering and
Table 1. Site data, based on 0.07-ha plots centered on canopy towers, at Coweeta Hydrologic Laboratory, NC.
Site 1 Site 2 Site 3 Site 4
Elevation (m) 740 840 1070 1430 Aspect East Southeast East North
Slope (%) 52 29 24 35
Tree density (ha−1) 780 860 765 405 Mean DBH (cm) 19.7 15.3 21.3 27.3 Basal area (m ha−1) 33.51 21.39 36.15 32.06
LAI 4.56 4.58 4.94 5.35
exiting the leaf chamber stabilized (30--45 s).
The IRGA and leaf chamber CO2 sensors were calibrated at
the start of each sampling date with a 349 ppm CO2 standard.
Relative humidity sensors were calibrated using columns of desiccant (CaSO4) and humidifier (FeSO4). Outlet air
tempera-ture sensors were calibrated with a thermocouple and meter. Microclimate was noted for each sample using the sensors housed in the leaf chamber. Photosynthetic photon flux density (PPFD) was measured with a selenium cell mounted on the leaf chamber, and PPFD readings were periodically compared to values obtained with a quantum sensor (Model LI-190SA, Li-Cor, Inc., Lincoln, NE) that had been calibrated by the manufacturer in February 1992. The air to leaf temperature gradient in the chamber was reduced by continuous mixing of the air during sampling (Long and Hallgren 1985), and leaf temperature (Tl) was assumed to be the same as the
tempera-ture of leaf chamber outlet air T.
Net assimilation (Anet, µmol m−2 s−1) was estimated as
described by Long and Hallgren (1985). Vapor pressure deficit (VPD, kPa) was estimated as:
where Xs (mol−1) is saturation vapor pressure at the
tempera-ture of the air (T) in the leaf chamber and RH is percent relative
humidity (after Landsberg 1986).
Data analysis
Statistical summaries, simple linear regression, and non-linear regression (Johnson and Wichern 1982) were conducted with a PC-based software package (CRC-STATA, College Station, TX, CRC 1992). A Gauss-Newton nonlinear estimation rou-tine was used to estimate the parameters α and Amax in models
based on measured values for net carbon assimilation (Anet)
and PPFD (after Landsberg 1986):
A= αPPFDAmax αPPFD +Amax
,
where Amax is the modeled asymptotic maximum rate of
as-similation and α is quantum yield.
Two empirical approaches were used to examine the influ-ence of T and vapor pressure deficit (VPD) on assimilation rates. In the first approach, we examined the effects of T and VPD on residuals from the light response models. The residual analysis allowed us to evaluate the light response models using all observations across all temperatures, humidities, and irra-diances and examine the nature of any observed lack-of-fit. The second approach examined T and VPD effects at saturat-ing irradiances, i.e., at PPFDs greater than 750 µmol m−2 s−1, and where other factors limit photosynthesis (Nobel 1991). The results of subsetting the data in the second approach may have been affected by the correlations between PPFD, T, and
Table 2. Characteristics of sampled trees. Abbreviations: D = dominant, CD = codominant, I = intermediate, and U = understory canopy position.
Species Diam Total height Min. sampling Max. sampling Canopy
(cm) (m) height (m) height (m) class
Site 1
Acer rubrum 27.5 26.3 18.0 18.0 CD
Cornus florida 7.2 8.4 5.9 8.3 U
Fagus americana 6.4 7.9 5.9 5.9 U
Nyssa sylvatica 13.3 15.5 9.1 12.2 I
Quercus alba 47.6 24.1 19.4 21.0 D
Site 2
Acer rubrum 8.7 9.1 5.6 8.2 I
Acer rubrum 5.4 8.6 4.6 7.2 U
Acer rubrum 9.3 9.5 4.8 7.4 I
Liriodendron tulipifera 23.7 21.0 13.6 16.6 D
Quercus coccinea 33.1 19.5 11.2 15.0 D
Site 3
Betula lenta 21.0 22.1 14.5 23.7 CD
Betula lenta 25.8 24.4 12.7 24.1 CD
Carya glabra 17.9 24.6 10.4 21.0 CD
Quercus prinus 70.4 30.1 21.7 23.2 D
Site 4
Acer pensylvanicum 12.0 10.8 4.1 5.2 U
Acer rubrum 25.8 20.3 15.8 18.8 D
Acer rubrum 24.4 18.3 10.0 18.0 CD
Betula lenta 26.5 17.3 7.5 16.6 CD
Quercus prinus 47.3 21.3 15.1 17.1 D
VPD, i.e., observations under high light were more likely to be under high temperatures.
Results and discussion Microclimate during sampling
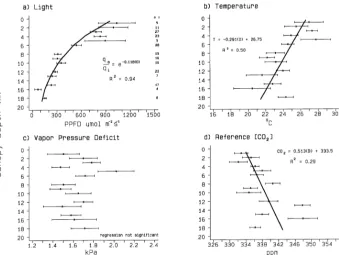
Sampling under field conditions resulted in left-skewed distri-butions of photon flux densities (Figure 1), caused by sampling in lower- to mid-canopy positions and on overcast days. Tem-peratures (T) ranged between 13.8 and 36 °C with a mean of about 26 °C. Many low T observations were made in Septem-ber when photosynthesis may also have been influenced by leaf senescence (Schaedle 1975), although we terminated sam-pling by mid-September, before color change and about five weeks before leaf fall. The VPD ranged from 0.8 to 2.8 kPa.
Significant vertical climatic gradients were observed on most sampling dates (Figure 2). In general, PPFD and T in-creased with increasing height in the canopy and CO2
concen-tration decreased (R2 = 0.94, 0.50 and 0.29, respectively); however, there was no significant vertical VPD gradient (Fig-ure 2c). Correlations between PPFD, T, and VPD constrained our ability to discern individual abiotic influences on CO2
assimilation. In practice, separation of leaf T and VPD is impossible under field conditions (Aphalo and Jarvis 1991). In our study, T and VPD were significantly correlated (R2 = 0.43,
P < 0.0005) as were T and PPFD (R2 = 0.15, P < 0.0005). Soil water in the top 25 cm was generally high and varied little over the 1992 growing season. Mean percent soil water (and ranges) for Sites 1 to 4 were 23.3 (17.7 to 29.4), 26.8 (19.0 to 30.8), 27.3 (21.9 to 31.4), and 30.7 (26.1 to 31.2), respec-tively. Minima generally occurred in mid-July, and maxima in June and August.
Figure 1. Distributions of leaf-incident light, air temperature, and vapor pressure deficit. Values are based on sensors attached to the leaf chamber.
Figure 2. Distributions of light, temperature and vapor pressure deficit by canopy depth. For the nonlinear model of light extinc-tion, qa is the PPFD incident on
Net photosynthesis
Canopy trees, especially Quercus spp., generally displayed the highest observed Anet and subcanopy trees generally had the
lowest observed Anet (Table 3). Rates of Anet for individual
observations ranged from 0.0 for B. lenta (minimum at lowest light category, < 500 µmol m−2 s−1) to 17.8 µmol m−2 s−1 for
Q. prinus at high irradiances (> 1000 µmol m−2 s−1). The mean Anet for PPFD values above 1000 µmol m−2 s−1 ranged from 1.7
(A. pensylvanicum) to 10.3 µmol m−2 s−1 (Q. coccinea). Rates
of Anet declined with decreasing irradiance for all species,
however the number of observations was low in certain light categories and species (e.g., Q. rubra and N. sylvatica at moderate irradiances and N. sylvatica, A. pensylvanicum, and C. florida at high irradiances).
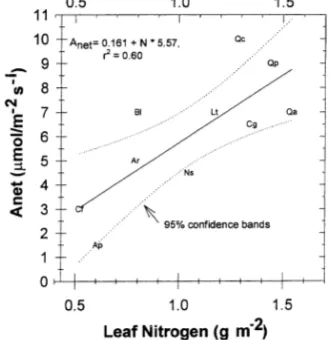
Maximum observed net photosynthesis was strongly related to leaf nitrogen on a per unit area basis (Figure 3). Both Anet
and leaf nitrogen concentrations were generally low for the subcanopy species C. florida and A. pensylvanicum, whereas intermediate values were observed for B. lenta, A. rubrum, and
Table 3. Summary of measured net photosynthesis (Anet, µmol m−2 s−1), and incident light (PPFD, µmol m−2 s−1) by three light categories: high
(H) is ≥ 1000, medium (M) is < 1000 and > 500, and low (L) is ≤ 500 µmol m−2 s−1.
Species Irradiance n PPFD Anet
Mean ± SE Mean ± SE Min Max
Quercus coccinea H 41 1296 ± 25.5 10.26 ± 0.465 0.99 14.14
M 30 756 ± 24.6 7.83 ± 0.324 4.16 11.52 L 13 323 ± 33.3 3.52 ± 0.377 1.64 5.54
Quercus prinus H 37 1348 ± 40.6 9.91 ± 0.552 3.61 17.80
M 18 660± 22.3 7.22 ± 0.601 4.25 13.78 L 39 342 ± 14.4 5.26 ± 0.413 1.29 12.11
Quercus rubra H 13 1403 ± 74.1 8.87 ± 0.918 2.63 13.53
M 2 644 ± 56.6 4.95 ± 2.651 2.30 7.60 L 12 297 ± 28.6 4.38 ± 0.788 0.56 7.88
Betula lenta H 30 1389 ± 63.4 8.09 ± 0.580 4.00 14.45
M 38 661 ± 21.9 4.97 ± 0.364 2.03 12.14 L 222 256 ± 7.7 2.63 ± 0.097 0.00 7.91
Liriodendron tulipifera H 37 1350 ± 44.4 7.85 ± 0.447 1.92 13.07
M 25 665 ± 26.0 6.67 ± 0.336 3.85 9.83 L 29 366 ± 13.6 4.18 ± 0.363 1.27 10.16
Quercus alba H 7 1452 ± 87.7 7.59 ± 1.201 3.23 11.34
M 8 703 ± 47.0 6.14 ± 0.544 3.27 8.51 L 14 274 ± 24.3 2.75 ± 0.465 0.88 6.85
Carya glabra H 15 1283 ± 61.2 7.22 ± 0.707 3.60 12.11
M 16 687 ± 39.3 5.46 ± 0.570 2.34 10.49 L 68 305 ± 11.6 3.79 ± 0.257 0.33 12.77
Acer rubrum H 30 1373 ± 51.5 5.58 ± 0.478 1.29 10.26
M 24 676 ± 25.7 4.52 ± 0.334 0.97 7.36 L 167 243 ± 9.4 2.52 ± 0.131 −0.56 10.16
Nyssa sylvatica H 1 1400 3.91 3.91 3.91
M 2 649 ± 33.9 5.54 ± 1.902 3.64 7.44 L 29 242 ± 18.4 2.91 ± 0.213 0.93 5.94
Cornus florida H 2 1501 ± 41.0 3.58 ± 0.657 2.93 4.24
L 18 189 ± 21.7 2.53 ± 0.247 0.88 3.72
Acer pensylvanicum H 3 1333 ± 33.4 1.67 ± 0.386 1.00 2.34
M 2 621 ± 9.2 2.68 2.68 2.68
L 36 107 ± 14.7 1.13 ± 0.121 0.19 2.66
Fagus americana L 10 163 ± 19.9 2.32 ± 0.271 1.32 3.92
Figure 3. Relationship between mean light-saturated Anet and leaf
nitrogen per unit area for the range of species included in this study. Ap = A. pensylvanicum, Ar = A. rubrum, Bl = B. lenta, Cf = Cornus. florida, Cg = Carya glabra, Lt = L. tulipifera, Ns = N. sylvatica, Qa =
N. sylvatica. In our study, B. lenta was a subcanopy species and A. rubrum and N. sylvatica occupied the mid- to upper canopy, with a large portion of the leaf area occurring in mid-canopy positions (Voseet al. 1995). This may reflect a strategy for partitioning N, i.e., a low N content per unit leaf area, but a high leaf area per unit ground area. High rates of Anet were
observed in association with high leaf nitrogen content for L. tulipifera, Carya glabra, and the three Quercus spp.
The assimilation values measured in our study are within the range of those observed for the same species in other studies (Table 4). We observed no seasonal trends in the maximum rate of Anet (Amax). Mean values were consistent through the
grow-ing season, even for subsets of data from similar conditions,
e.g., light-saturated conditions in early morning and from the upper canopy of selected species. Similarly, light-saturated Amax did not differ by canopy position, that is, light-saturated
leaves had similar maximum photosynthetic rates regardless of canopy position. Because we did not purposefully resample the same leaves, leaf-to-leaf variation, even on the same trees and under similar environmental conditions, was greater than changes in Amax with leaf age.
Light response models
All nonlinear light response models were statistically signifi-cant (P = 0.05), both when fitted with pooled data and when fitted by species (Table 5). Model fits were best for Quercus
Table 4. Comparison between observed CO2 assimilation (µmol m−2 s−1) in this and previous studies. Studies cited are: 1. Ranney et al. (1991),
2. Walters et al. (1993), 3. Kubiske and Abrams (1992), 4. Bahari et al. (1985), 5. Hinckley et al. (1978), 6. Weber and Gates (1990), 7. Dougherty and Hinckley (1981), and 8. Aubuchon et al. (1978).
Species Source Description Net assimilation
Age Light Water status Cited studies Present study
Betula spp. 1,2 Seedlings Saturated Drought 2 -- 10 8.09
1,2 Seedlings Saturated Nondrought 7 -- 16
Quercus rubra 3 Seedlings Saturated Nondrought 5.5 -- 7.5 8.87
2 Seedlings Saturated Nondrought 6.2
4 Saplings Saturated Nondrought 5.6
5 Saplings Saturated Nondrought 6.9
6 Saplings/mature Saturated Nondrought 13.0 6 Sapling/mature Saturated Drought 6.0
Quercus alba 4 Saplings Saturated Nondrought 5.3 7.59
5 Saplings Saturated Nondrought 8.7
7 Mature Saturated Nondrought > 8.8
7 Mature Saturated Drought < 5.5
8 Mature Low light Site ambient 2.9 2.75
8 Mature Saturated Site ambient 11.21 12.412
1 Maximum rate estimated by boundary-line analysis.
2 Maximum rate estimated using nonlinear regression.
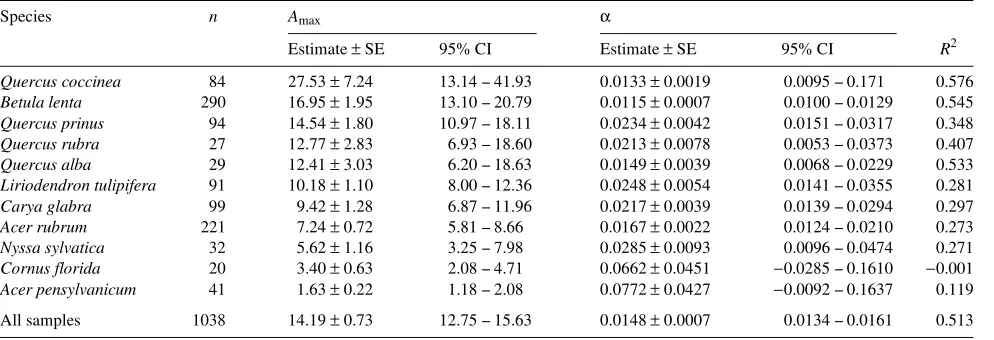
Table 5. Light response model parameters fit to measured data [Amax = µmol CO2 m−2 s−1, α (quantum yield efficiency) = Amax/PPFD]. R2 for all
models adjusted for the mean and df. Both Amax and α were significant (P < 0.001 and P < 0.05, respectively) for all species except C. florida and
A. pensylvanicum, where α was not significant (P > 0.05).
Species n Amax α R
Estimate ± SE 95% CI Estimate ± SE 95% CI R2 Quercus coccinea 84 27.53 ± 7.24 13.14 -- 41.93 0.0133 ± 0.0019 0.0095 -- 0.171 0.576
Betula lenta 290 16.95 ± 1.95 13.10 -- 20.79 0.0115 ± 0.0007 0.0100 -- 0.0129 0.545
Quercus prinus 94 14.54 ± 1.80 10.97 -- 18.11 0.0234 ± 0.0042 0.0151 -- 0.0317 0.348
Quercus rubra 27 12.77 ± 2.83 6.93 -- 18.60 0.0213 ± 0.0078 0.0053 -- 0.0373 0.407
Quercus alba 29 12.41 ± 3.03 6.20 -- 18.63 0.0149 ± 0.0039 0.0068 -- 0.0229 0.533
Liriodendron tulipifera 91 10.18 ± 1.10 8.00 -- 12.36 0.0248 ± 0.0054 0.0141 -- 0.0355 0.281
Carya glabra 99 9.42 ± 1.28 6.87 -- 11.96 0.0217 ± 0.0039 0.0139 -- 0.0294 0.297
Acer rubrum 221 7.24 ± 0.72 5.81 -- 8.66 0.0167 ± 0.0022 0.0124 -- 0.0210 0.273
Nyssa sylvatica 32 5.62 ± 1.16 3.25 -- 7.98 0.0285 ± 0.0093 0.0096 -- 0.0474 0.271
Cornus florida 20 3.40 ± 0.63 2.08 -- 4.71 0.0662 ± 0.0451 −0.0285 -- 0.1610 −0.001
Acer pensylvanicum 41 1.63 ± 0.22 1.18 -- 2.08 0.0772 ± 0.0427 −0.0092 -- 0.1637 0.119
spp. and B. lenta, poorest for the subcanopy species, and intermediate for the remaining species. The pooled data model accounted for about 50% of the observed variation. The scar-city of observations at high irradiance may account for the poor fit for A. pensylvanicum and C. florida. Parameters for F. americana could not be estimated.
The estimated maximum assimilation values (Amax) fall into
the same general order as the measured maximum values (Figure 4, Table 5). One notable exception is that estimated Amax of B. lenta is higher than that of Q. prinus and Q. rubra.
Masarovicova (1992) determined Amax values for two oak
spe-cies of 27.2 and 20.3 µmol m−2 s−1 using the boundary line
technique. Our estimated Amax values are high for mature trees
of some species (e.g., 27.53 µmol m−2 s−1 for Q. coccinea), probably because it is an estimate of an asymptote. The meas-ured data best fit a model with a high asymptote; however, Amax
would not be approached under ambient light conditions.
Un-der high irradiance (2000 µmol m−2 s−1), the predicted A net of
13.5 µmol m−2 s−1 is similar to the observed A
net for Q.
coc-cinea.
Based on 95% confidence intervals as the criteria (Sokol and Rohlf 1981), there are significant differences in Amax and
quan-tum yield among some species. For example, Amax values for
Q. coccinea and B. lenta (lower 95% CI = 13.1) are signifi-cantly higher than those for L. tulipifera, C. glabra, and A. ru-brum. (upper 95% CI = 12.4). Abrams et al. (1994) divided 17 temperate species into three categories based on habitat char-acteristics (i.e., xeric, mesic and wet-mesic) in a comparison between wet and dry years. Our observations suggest a land-scape-level model may also be simplified by grouping species into categories of similar ecophysiological response. However, these categories do not appear to correspond to typical habitat characteristics, e.g., Q. coccinea, a xeric species, appears to fall into the same category as B. lenta, a mesic species, and Q. prinus should, apparently, be grouped with Q. rubra.
Species with high estimated Amax generally had lower
esti-mated quantum yields than species with low Anet (Table 5).
Conversely, species with generally low Anet as found in the
subcanopy in this study ( N. sylvatica, C. florida, and A. pen-sylvanicum), displayed more efficient use of light at low irra-diances.
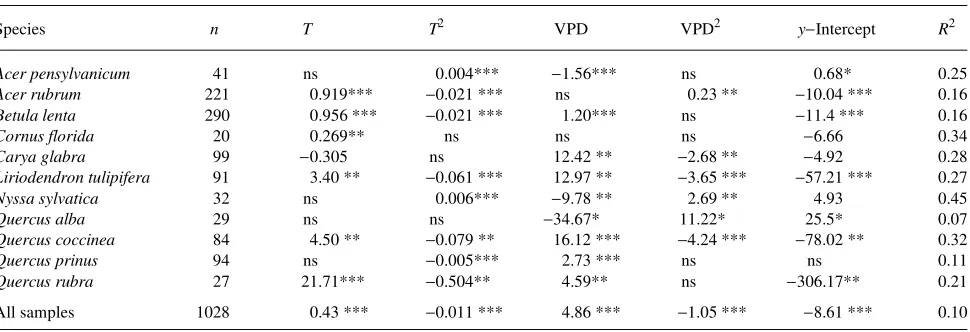
Temperature and VPD effects
Analyses of residual variation after fitting the light response models indicate about 10% of the variation in the residuals was related to squared T, VPD, and squared VPD (Table 6). These models of residuals are an attempt to understand the variation remaining after fitting the assimilation light response models (Equation 1) discussed above. A curvilinear response of T was expected (Lloyd and Woolhouse 1976, Kirschbaum and Far-quhar 1984, Nobel 1991) but the curvilinear VPD effect was unexpected and may have been due, in part, to the correlation between T and VPD, and, in part, to our assumption of equiva-lent chamber air and leaf temperatures. Some of the remaining unexplained variation may be related to differences in respira-tion rates among species. However, we have few data on leaf
Figure 4. Non-linear light response models (Table 5) plotted for all species: Acer pensylvanicum (Ap), Cornus florida (Cf), Nyssa sylva-tica (Ns), A. rubrum (Ar), Carya glabra (Cg), Liriodendron tulipifera
(Lt), Quercus alba (Qa), Q.rubra (Qr), Q. prinus (Qp), Q. coccinea
(Qc), B. lenta (Bl) and all species pooled (All).
Table 6. Models of residuals from the light response models of the influence of temperature and vapor pressure deficit (T and T2 in °C, VPD and VPD2 in kPa). Significant differences denoted by: * = P < 0.10, ** = P < 0.05, *** = P < 0.001, and ns = not significant.
Species n T T2 VPD VPD2 y−Intercept R2
Acer pensylvanicum 41 ns 0.004*** −1.56*** ns 0.68* 0.25
Acer rubrum 221 0.919*** −0.021 *** ns 0.23 ** −10.04 *** 0.16
Betula lenta 290 0.956 *** −0.021 *** 1.20*** ns −11.4 *** 0.16
Cornus florida 20 0.269** ns ns ns −6.66 0.34
Carya glabra 99 −0.305 ns 12.42 ** −2.68 ** −4.92 0.28
Liriodendron tulipifera 91 3.40 ** −0.061 *** 12.97 ** −3.65 *** −57.21 *** 0.27
Nyssa sylvatica 32 ns 0.006*** −9.78 ** 2.69 ** 4.93 0.45
Quercus alba 29 ns ns −34.67* 11.22* 25.5* 0.07
Quercus coccinea 84 4.50 ** −0.079 ** 16.12 *** −4.24 *** −78.02 ** 0.32
Quercus prinus 94 ns −0.005*** 2.73 *** ns ns 0.11
Quercus rubra 27 21.71*** −0.504** 4.59** ns −306.17** 0.21
respiration rate and our empirical approach cannot separate the influences of temperature on respiration and photosynthesis (Hari et al. 1991). Also, our data were not appropriate for discerning if species that spanned the elevation range accli-mated to differing temperature regimes, resulting in differing optimum temperatures (Rada et al. 1992).
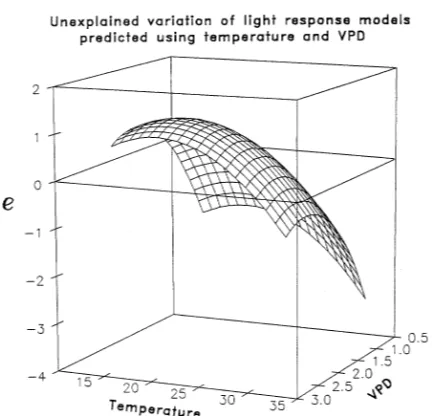
Analysis of residuals indicates small but statistically signifi-cant effects of T and VPD. For example, using the pooled-spe-cies model with a typical Coweeta climate (19 °C and 2 kPa VPD), our predicted Anet is about 1 µmol m−2 s−1 below
ob-served Anet (Figure 5). Under climatic conditions of 1 kPa VPD
and 33 °C, we predicted Anet to be approximately 3 µmol m−2
s−1 below observed Anet (Figure 5). However, the climatic
conditions that cause these larger residuals were seldom ob-served while sampling (Figure 1) .
The temperature and humidity response models for individ-ual species varied in qindivid-uality of fit (Table 6). For some species (A. rubrum and B. lenta) temperature alone was significant (P < 0.0005, R2 ≈ 0.16), T was not significant for C. glabra and N. sylvatica but VPD was significant (P < 0.005, R2 = 0.28 and
0.46), and for L. tulipifera and Q. coccinea both T and VPD
were significant (P < 0.005, R2 = 0.27 and 0.32). The lack of fit for some species could be because the species exhibited no response to T and VPD or because of the limited range of measured T and VPD values for each species.
Effects of T and VPD in saturating light
Temperature and VPD significantly influence Anet when
light-saturated data for all species are pooled (n = 266, P < 0.005, R2
= 0.15, Table 7, Figure 6). Squared VPD is not significant. The effects of T and VPD varied by species, and nonlinear models for N. sylvatica, C. florida, A. pensylvanicum, and F. ameri-cana would not converge. The T and VPD response model for all samples is plotted in Figure 6. Response across the VPD range is linear, 3.1 µmol CO2 m−2 s−1 across all temperatures.
Day et al. (1991) also observed increasing Anet with increasing
VPD. The curvilinear response to T and VPD was greatest (10.7 µmol m−2 s−1) at 27 °C and 0.8 kPa, respectively, and least at 15 °C and 2.8 kPa (2.9 µmol m−2 s−1). The Anet--T
relationship increases to a maximum near 26 °C, and there is a
Figure 5. Three-dimensional surface plot of model residuals (e) in the pooled light-response function (Table 6).
Table 7. Models predicting the influence of temperature (T and T2 in °C) and vapor pressure deficit (VPD in kPa) on Anet above light saturation (> 750 µmol PPFD m−2 s−1). Significant differences denoted by: * = P < 0.10, ** = P < 0.05, *** = P < 0.001, and ns = not significant.
Species n T T2 VPD Intercept R2
Acer rubrum 37 2.31*** −0.046*** ns −21.7 0.44
Betula lenta 39 2.59** −0.050*** 5.03** −33.4** 0.29
Liriodendron tulipifera 44 10.22** −0.174*** ns −140.6 0.31
Quercus coccinea 55 5.72* −0.093** ns −76.8** 0.20
Carya glabra 21 ns ns 3.75*** ns 0.47
Quercus alba 10 ns ns 3.75*** ns 0.43
All species 266 3.002*** −0.0559*** 1.735** −34.5*** 0.15 Figure 6. Three-dimensional surface of the residuals from the net photosynthesis model at light saturation (Anet at PPFD of > 750 µmol
rapid decline above that temperature. The Anet--VPD
relation-ship is more difficult to explain. Increasing VPD tends to reduce stomatal conductance, which in turn should reduce Anet.
However, our model fits indicate a slight increase in Anet with
an increase in VPD. Given the variation in the surface fit, revealed in scatter plots and R2 values, this result may be an artifact of our sampling, measurement, or modeling proce-dures.
In summary, we found a broad range in observed maximum assimilation rate for twelve species of broad-leaved deciduous tree species. Differences in models of net assimilation versus light were statistically significant, particularly for typical un-derstory versus overstory species. Small, although still signifi-cant, differences were found among overstory species, and species with similar site affinities did not always have similar light versus assimilation relationships. After accounting for the light response, we observed curvilinear effects of temperature and vapor pressure deficit on net assimilation.
References
Aber, J.D. 1978. A method for estimating foliage-height profiles in broadleaved forests. J. Ecol. 67:35--40.
Aber, J.A. and C.A. Federer. 1992. A generalized, lumped-parameter model of photosynthesis, evapotranspiration and net primary pro-duction in temperate and boreal forest ecosystems. Oecologia 92:463--474.
Abrams, M.D., M.E. Kubiske and S.A. Mosteller. 1994. Relating wet and dry year ecophysiology to leaf structure in contrasting temper-ate tree species. Ecology75:123--133.
Aphalo, P.J. and P.G. Jarvis. 1991. Do stomata respond to relative humidity? Plant Cell Environ. 14:127--132.
Aubuchon, R.R., D.R. Thompson and T.M. Hinckley. 1978. Environ-mental influences in photosynthesis within the crown of a dominant white oak. Oecologia 35:295--306.
Bacone, J., F.A. Bazazz and W.R. Bogess. 1976. Correlated photosyn-thesis responses and habitat factors of two successional tree species. Oecologia 23:63--74.
Bahari, Z.A., S.G. Pallardy and W.C. Parker. 1985. Photosynthesis, water relations, and drought adaptation in six woody species of oak-hickory forests in central Missouri. For. Sci. 31:557--569. Bossel, H. 1991. Modeling forest dynamics: moving from description
to explanation. For. Ecol. Manage. 42:129--142.
CRC-Computing Resource Center. (STATA) 1992. STATA Reference Manual: Release 3, 5th Edn. College Station, TX, 1163 p. Caldwell, M.M., H.P. Meister, J.D. Tenhunen and O.L. Lange. 1986.
Canopy structure, light microclimate and leaf gas exchange of
Quercus coccifera L. in a Portuguese macchia: measurements in different canopy layers and simulations with canopy model. Trees 1:25--41.
Day, T.A., S.A. Heckathorn and E.H. Delucia. 1991. Limitations of photosynthesis in Pinus taeda L. (loblolly pine) at low soil tempera-tures. Plant Physiol. 96:1246--1254.
Dougherty, P.M., R.O. Teskey, J.E. Phelps and T.M. Hinckley. 1979. Net photosynthesis and early growth trends of a dominant white oak (Quercus alba L.) Plant Physiol. 64:930--935.
Dougherty, P.M. and T.M. Hinckley. 1981. The influence of severe drought on net photosynthesis of white oak (Quercus alba). Can. J. Bot. 59:335--341.
Ehleringer, J.R. and C.B. Field. 1993. Scaling physiologic processes: leaf to globe. Academic Press. San Diego, CA, 388 p.
Ellsworth, D.S. and P.B. Reich. 1993. Canopy structure and vertical patterns of photosynthesis and related leaf traits in a deciduous forest. Oecologia 96:169--178.
Epron, D. and E. Dreyer. 1993. Photosynthesis of oak leaves under water stress: maintenance of high photochemical efficiency of pho-tosystem II and occurrence of nonuniform CO2 assimilation. Tree
Physiol. 13:107--117.
Geiger, R. 1965. The climate near the ground. Harvard Univ. Press, Cambridge, MA, 611 p.
Geis, J.W. R.L. Tortorelli and W.R. Bogess. 1971. Carbon dioxide assimilation of hardwood seedlings in relation to community dy-namics in central Illinois. Oecologia 7:276--289.
Hanson, P.J., J.G. Isebrands, R.E. Dickson and R.K. Dixon. 1988. Ontogenetic patterns of CO2 exchange of Quercus rubra L. leaves
during three flushes of shoot growth I. Median flush leaves. For. Sci. 34:55--68.
Hari, P., E. Nikinmaa and E. Korpilahti. 1991. Modeling: canopy, photosynthesis, and growth. In Physiology of Trees. Ed. A.S. Raghavendra. John Wiley & Sons, New York, 509 p.
Hinckley, T.M., R.G. Aslin, R.R. Aubuchon, C.L. Metcalf and J.E. Roberts.1978. Leaf conductance and photosynthesis in four species of the oak-hickory forest type. For. Sci. 24:73--84.
Hollinger, D.Y. 1992. Leaf and simulated whole-canopy photosynthe-sis in two co-occurring tree species. Ecology 73:1--14.
Hutchison, B.A., D.R. Matt, R.T. McMillen, L.J. Gross, S.J. Tajchman and J.M. Norman. 1986. The architecture of a deciduous forest canopy in eastern Tennessee, U.S.A. J. Ecol. 74:635--646. Kirschbaum, M.U.F. and G.D. Farquhar. 1984. Temperature
depend-ence of whole-leaf photosynthesis in Eucalyptus pauciflora Sieb. ex. Spreng. Aust. J. Plant Physiol. 11:519--538.
Korol, R.L., S.W. Running, K.S. Milner and E.R. Hunt. 1991. Testing a mechanistic carbon balance model against observed tree growth. Can. J. For. Res. 21:1098--1105.
Kubiske, M.E. and M.D. Abrams. 1992. Photosynthesis, water rela-tions, and leaf morphology of xeric versus mesic Quercus rubra in central Pennsylvania in relation to moisture stress. Can. J. For. Res.
22:1402--1407.
Landsberg, J.J. 1986. Physiological ecology of forest production. Academic Press, Inc. New York, 198 p.
Lloyd, N.D.H. and H.W. Woolhouse. 1976. The effect of temperature on photosynthesis and transpiration in populations of Sesleria caerulea (L) Ard. New Phytol. 77:553--559.
Masarovicova, E. 1992. Morphological, physiological and produc-tional characteristics of three oak species. Acta Physiol. Planta 14:99--106.
Mebrahtu, T. J.W. Hanover, D.R. Layne and J.A. Flore. 1991. Leaf temperature effects on net photosynthesis, dark respiration, and photorespiration of seedlings of black locust families with contrast-ing growth rates. Can. J. For. Res. 21:1616--1621.
Nobel, P.S. 1991. Physicochemical and environmental plant physiol-ogy. Academic Press. San Diego, CA, 635 p.
Parker, W.C. and S.G. Pallardy. 1988. Leaf and root osmotic adjust-ment in drought stressed Quercus alba, Q. macrocarpa, and Q. stellata seedlings. Can. J. For. Res. 18:1--5.
Rauscher, H.M., J.G. Isebrands, G.E. Host, R.E. Dickson, D.I. Dick-man, T.R. Crow and D.A. Michael. 1990. ECOPHYS: An ecologi-cal growth process model for juvenile poplar. Tree Physiol. 7:255--281.
Reich, P.B., D. Ellsworth, B. Kloeppel, J. Fownes and S. Gower. 1990. Vertical variation in canopy structure and CO2 exchange of
oak-ma-ple forests: influence of ozone, nitrogen, and other factors on simulated canopy carbon gain. Tree Physiol. 7:329--345.
Rosenberg, N.J. 1974. Microclimate: the biological environment. John Wiley and Sons., New York, 496 p.
Running, S.W. 1984. Microclimate control of forest productivity: analysis by computer simulation of annual photosynthesis/transpi-ration balance in different environments. Agric. For. Meteorol. 32:267--288.
Running, S.W. and E.R. Hunt. 1993. Generalization of forest ecosys-tem process models for other biomes, BIOME-BGC, and an appli-cation for global-scale models. In Scaling Physiological Processes: Leaf to Globe. Eds. J.R. Ehleringer and C.B. Field. Academic Press, San Diego, 388 p.
Rutherford, M.C. 1993. Empiricism and the prediction of primary production at the mesoscale: a savanna example. Ecol. Model.
67:129--146.
Schaedle, M. 1975. Tree photosynthesis. Annu. Rev. Plant Physiol. 26:101--115.
Sokal, R.R. and F.J Rohlf. 1981. Biometry: The principles and practice of statistics in biological research. W.H. Freeman and Co., San Francisco, 859 p.
Swank, W.T. and D.A. Crossley. 1988. Introduction and site descrip-tion. In Forest Ecology and Ecology at Coweeta. Eds. W.T. Swank and D.A. Crossley. Springer-Verlag, New York, pp 3--16.
Swift, L.W., G.B. Cunningham and J.E. Douglas. 1988. Introduction and site description. In Forest Ecology and Ecology at Coweeta. Eds. W.T. Swank and D.A. Crossley. Springer-Verlag, New York, pp 35--56.
Valentini, R., G.G. Scarascia Mugnozza, P. DeAngelis and G. Mat-teucci, 1995. Coupling water sources and carbon metabolism of natural vegetation at integrated time and space scales. Agric. For. Meteorol. 73:181--188.
Vose, J.M. and W.T. Swank. 1990. Assessing seasonal leaf area dy-namics and vertical leaf area distribution in eastern white pine (Pinus strobus L.) with a portable light meter. Tree Physiol. 7:125--134.
Vose, J.M., N.H. Sullivan, B.D. Clinton and P.V. Bolstad. 1995. Verti-cal leaf area distribution, light transmittance, and application of the Beer-Lambert Law in four mature hardwood stands in the southern Appalachians. Can. J. For. Res. 25:1036--1043.
Walters, M.B., E.L. Kruger and P.B. Reich. 1993. Growth, biomass distribution and CO2 exchange of northern hardwood seedlings in high and low light: relationships with successional status and shade tolerance. Oecologia 94:7--16.
Walters, M.B. and P.B. Reich. 1989. Response of Ulmus americana
seedlings to varying nitrogen and water status. 1 Photosynthesis and plant growth. Tree Physiol. 5:159--172.
Wang, Y.P. and P.G. Jarvis, 1990. Description and validation of an array model: MAESTRO, Agric. For. Meteorol. 51:257--280. Webb, W.L. 1991. Atmospheric CO2, climate change, and tree growth:
a process model, I. Model structure. Ecol. Model. 56:81--107. Weber, J.A. and D.M. Gates. 1990. Gas exchange in Quercus rubra