FOREIGN DIRECT INVESTMENTS FROM JAPAN AND REPUBLIC OF KOREA AND THEIR ROLE IN TECHNOLOGY TRANSFER THROUGH SUBCONTRACTING TO MANUFACTURING SME IN INDONESIA
Tulus Tambunan
Indonesian Chamber of Commerce and Industry & Center for Industry and SME Studies, University of Trisakti, Jakarta-Indonesia
Visiting Fellow
Center for Northeast Asian Economic Cooperation (CNAEC), Korea Institute for International Economic Policy, Seoul, August 2007
I. Introduction
in the last few years, ASEAN, probably the most ‘living’ trade bloc within the developing world, has expanded their market by establishing bilateral or multilateral free trade areas (FTAs) with many strong economies outside the bloc, including two in Asia, i.e. Japan and the Republic of Korea (ROK).
Since foreign direct investment (FDI) is strongly linked to external trade, it is then generally expected that the economic integration between ASEAN and these two economies will improve not only trade between the two parties but it will also encourage FDI to increase from Japan and ROK into ASEAN, including Indonesia. In Indonesia, it is generally assumed that the increase of FDI inflows from these two countries will bring net benefits, not only in the form of employment creation and export growth but also in the form of transfer of technology,1especially to small and medium enterprises (SMEs), through subcontracting production linkages.
In the literature on development of SMEs in developing countries it is often argued that a key to increasing the competitiveness and productivity of these enterprises is to build their capacities through improved technology. This technology development can take place internally (inside the firm) or can be fostered through access to outside sources, such as transfer of technology from multinational companies (MNCs), technical licensing agreements and imported capital goods. Technology here is defined broadly including product, process, as well as management skills.
The main aim of this study is to examine empirically the role of FDI from Japan and ROK in technology transfer to local manufacturing SME in Indonesia. Specifically, it addresses the following simple question: how important are Indonesian based companies from ROK and Japan in technology transfer to SME in manufacturing industry in Indonesia?
Methodologically, this study is based on: 1) a review of key literature on FDI with respect to its role in transfer of technology; 2) secondary data analysis on the development of FDI from ROK and Japan in Indonesia
with the focus on manufacturing industry; and 3) a field survey in a SME industrial cluster, namely the metalworking industry in Tegal.
With respect to the survey, it used a multi-method approach, i.e. interviews and focus group discussions. Since this study is exploratory, during the survey, the author remained open to less tangible factors that could have an impact on technology transfer from FDI-based companies to local SMEs. So, this study was conducted according to the descriptive and hypothesis-generating approach (Yin, 1989) rather than the hypothesis-testing model. In the clusters, the respondents were selected on the basis of pattern-matching, but on the basis of logistics and willingness of them to participate in the interviewing process. Since factors that may influence the process of technology transfer are possibly numerous, and the data that might help in hypothesizing regarding these factors are rare, not only semi-structured but also in-depth interviews were adopted to get many evidence as much as possible in order not only to have a deeper understanding of the process of technology transfer and their determinant factors, but also to increase the validity of the study (Kirk and Miller, 1986).
II. The Importance of SMEs in Asia
In most Asian economies, SMEs are considered the engine of economic growth by virtue of their sheer number and significant economic and social contributions. The role of these enterprises in industrial development in Asia is more pronounced than in the West. In countries such as Japan, Chinese Taipei, South Korea and China, SMEs are the backbone of the industrial and manufacturing sectors. Their number and contribution to total employment in these economies are well over 95% and 70% respectively (RAM Consultancy Services, 2005).
In developing Asia, SMEs have made significant contributions over the years measured in terms of their share in: (a) number of enterprises; (b) employment; (c) production and value added; (d) GDP; (e) enterprises set up by women entrepreneurs; and (f) regional dispersal of industry, among others. The contribution of SMEs is vital in as much as they, by and large: (a) make up 80-90% of all enterprises; (b) provide over 60% of the private sector jobs; (c) generate 50-80% of total employment; (d) contribute about 50% of sales or value added; (e) share about 30% of direct total exports (Narain, 2003).
competitive in the world markets. SMEs generally account for between 20-40% of total domestic output and they employ an overwhelming proportion (mostly in the 75%-90% cent range) of the domestic workforce, especially adult persons and women.2
[image:3.612.44.504.354.658.2]On the other hand, in spite of the significance of these indicators, the SMEs’ value added contribution to the economy for most ASEAN countries has yet to commensurate with the sector’s size and socioeconomic potential. Wattanapruttipaisan’s (2004) own calculation shows that SME in ASEAN contribute a disproportionately limited share of 20% to 40% to gross sales value or manufacturing value added (VA) and only between 10% and 20% to export earnings3In Singapore, for instance, the VA of SME is only 34.7% of the economy’s total VA and 16% to export earnings (this latter not shown in the table), while their productivity is half that of LEs. Malaysian SME contributed only about 26% to manufacturing VA. In Thailand, commonly cited as a successful model for SME development in ASEAN, its SME contribution is only 47% of total VA (Table 1). Comparatively, SMEs in the developed nations contribute about 50% of total VA in the European Union, or, individually, for instance, SMEs in Germany are responsible for approximately 57% and 30% of the country’s Gross National Product (GNP) and direct exports, respectively; between 40% and 50% of manufacturing output in Japan, ROK and Taipei, China; and in the United States (US), 30% to total sales value.
Table 1: Non-agricultural SMEs in ASEAN and selected countries in East Asia SMEs as a % of
Country No. of non-agricultural SME in 2002 or later or best estimation (‘000)
Percentage of GDP/value
added (VA)/output All Firms Workforce
Brunei Darussalam Cambodia Indonesia Lao PDR Malaysia Myanmar Singapore Thailand Philippines Viet Nam
East Asia1 China
Chinese Taipei Hong Kong, China Japan ROK 302 26 16,0003 224 205 344 60-725 1,640 686 2,7007 8,000 1,050 292 6,140 2,700 - - 57 (total VA)
-
15 (total gross output) 47.3 (total VA) 26 (manufacturing VA)
-
41 (manufacturing output) 34.7 (total VA)
47 (total VA) 32 (total VA) 42 (total VA)
60 (industrial output) -
-
52 (manufacturing output) 55.3 (total VA) 47.5 (total gross output)
50 (total VA)
98 99 99.9 - 99.2 96 97 99.6 99.6 96 99 98.1 98.2 99.7 99.8 92 45 99.6 - 65.1 32.58 78 58 768 99 85 78.8 78.4 60.7 77.6 86.7 2
. A study conducted by the Asia-Pacific Economic Cooperation (APEC) shows that women entrepreneurs own and operate up to 30% of SMEs in such as Indonesia, Philippines and the Republic of Korea (APEC 1999).
3
Notes: 1: best guess for 2000; 2: est. active (2004); 3: includes micro enterprises. Estimated actual SMEs is closer to 700,000 firms; 4 : 1998/9; 5: estimated active; 6: excludes 744,000 micro enterprises/MIEs (2001); 7: excludes 10 million MIEs; 8: manufacturing industry only.
Sources: APEC (2002), RAM Consultancy Services (2005), UNCTAD (2003), Hall (2002), Myint (2000), Regnier (2000), Ministry of Industry, Mines and Energy of the Kingdom of Cambodia, BPS (Indonesia), Census 2005 (Malaysia), JASME Annual Report 2004-2005 (Japan); SMEA (White Paper on SMEs in Taiwan 2005), OSMEP (White Paper on SMEs in Thailand, 2002), National SME Development Agenda 2000/2001 (Philippines).
However, Wattanapruttipaisan (2005).argues that their actual share in total exports is considerably larger because of the participation of many SMEs as subcontractors to export-oriented local LEs and MNCs.4Nevertheless, the range of direct exports from the SME remains typically narrow and their value added relatively limited.5
RAM Consultancy Services’ (2005) report states that various impediments prevent SME in ASEAN from developing to their full potential. One of constraints faced by these enterprises is the lack of access to formal credit to finance their needed working capitals.6With limited working capital, it is hard for them to expand their production and hence to increase their share in total output.
III Overview of SMEs Development in Indonesia
In Indonesia, SMEs have historically been the main player in domestic economic activities, especially as a large provider of employment opportunities, and hence a generator of primary or secondary sources of income for many households. For low income or poor farm households in rural areas, small enterprises (SEs) with less than 20 workers in non-farm activities are especially important. These enterprises have also been an important engine for the development of local economies and communities. However, compared with many others, especially more developed economies, Indonesian SMEs are not yet contributing significant value added to the national economy. Instead, they have been more important as the locus of most employment7.
4
See also Rodriguez and Berry (2002); Wattanapruttipaisan (2000a, 2005), Borrus, et al. (2000); Regnier (2000); Tambunan (2000, 2006), Levy et al. (1999); Liedholm and Mead (1999), Altenburg et al. (1988); and Humphrey (1998).
5
Featuring prominently in SME exports from Indonesia, Philippines, Thailand and Viet Nam are food products, textiles and garments, leather and plastic goods (including toys), furniture items, handicrafts, jewelry and, to a less extent, mature-technology automotive and consumer electronics parts. For further details, see Hill (1995, 2002), Richards and others (2002), Rodriguez and Berry (2002), Steer and Taussig (2002); Regnier (2000), Tambunan (2000, 2006) and Tecson (2000).
6
The RAM Consultancy Services’ report (2005) shows that around 75-90% of ASEAN SMEs rely on internal savings, retained earnings and borrowing from family, friends and money lenders (collectively known as ‘informal sector’) as opposed to the 3-18% which have access to formal sector finance (banks, capital markets, venture capitalists etc). For start-up companies, the rate of funding from the formal bank sector is even lower. For example, only 12% of SMEs in Indonesia had access to bank financing while in Singapore, it is estimated between 20-25% from one source and 49% from another survey source. In Malaysia, 47.3% of SME had access to bank funds compared to 32.4% that relied on internal funds and 11% from family and friends. Wattanapruttipaisan (2004) provides a more complete read on these patterns and characteristics of SMEs financing in ASEAN. Like their counterparts in other developing countries, SMEs in ASEAN generally have not been successful in tapping funds from the formal financial sector. If they did, it is usually at relatively high cost.
7 In Indonesia, there are several definitions of SMEs, depending on which agency provides the definition. As this paper uses data from
SMEs have also been recognized having another important role in Indonesia as an engine for development and the growth of exports of non-oil and gas, particularly in manufacturing. This is in line with evidence in East and Southeast Asian in countries like South Korea, Taiwan, Hong Kong, and Singapore, showing that the most successful cases of SMEs development have directly contributed to trade and the adoption of export-oriented strategies. The experiences of these countries suggest that although in general export-orientation is highly correlated with size, many (if not all) SMEs can compete effectively in both domestic and international (Tambunan, 2006).
Typically, SMEs in Indonesia account for more than 90% of all firms outside the agricultural sector, and thus they are the biggest source of employment, providing livelihood for over 90% of the country’s workforce, especially women and the young. The majority of SMEs, especially the smallest units, generally called micro enterprises (MIEs), are scattered widely throughout the rural area and therefore they may play an important role as a starting point for development of villagers' talents as entrepreneurs, especially those of women. MIEs are dominated by self-employment enterprises without hired paid workers. They are the most traditional enterprises, generally with low levels of productivity, poor quality products, and serving small, localized markets. There is little or no
technological dynamism in this group. The majority of these enterprises eke out bare subsistence. Some of them are
economically viable over the long-term, but a large portion is not. Many MIEs face closure or very difficult upgrading especially with import liberalization, changing technology and the growing demand for higher quality modern products. However, the existence or growth of this type of enterprise can be seen as an early phase of entrepreneurship development.
According to official data from the State Ministry of Cooperative and Small and Medium Enterprises (Menegkop & UKM), SEs in 1997 accounted for more than 39.7 million units, or about 99.8% of the total number of enterprises in the country in that year, and increased to more than 48 million units in 2006 (Table 2). So, generally speaking, this table may indicate that every year new entrepreneurs have been born. Unfortunately, there is no data which can show whether the transformation process or size upgrading has happened within SMEs, with. MIEs become SEs, SEs become MEs, and MEs being transformed into LEs. This transformation process of firms by size may show a better picture about long-term entrepreneurship development.
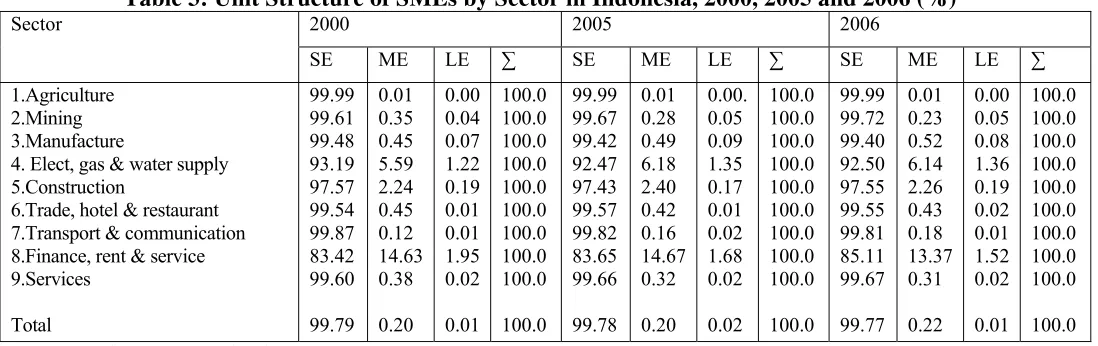
The unit structure of SMEs by sector indicates that the majority of enterprises in all sectors are from the category of SME with almost 100 percent in agriculture (Table 3). Whereas, the distribution of SMEs by sector shows that Indonesian SMEs are concentrated in agriculture, followed by trade, hotel and restaurants as the
second and manufacturing industry as the third largest sector (Table 4). In this latter sector, they are involved mainly in simple traditional manufacturing activities such as wood products, including furniture, textiles, garments, footwear, and food and beverages. Only a small portion of total SMEs are engaged in production of machinery, production tools and automotive components. This is generally carried out through subcontracting systems with several multinational car companies such as Toyota and Honda. This structure of industry reflects the current technological capability of Indonesian SMEs, which are not yet as strong in producing sophisticated technology-embodied products as their counterparts in other countries such as ROK, Japan, and Taiwan.
Table 2: Total Units of Enterprises by Size Category: 1997-2006 (000 units)
Size Category 1997 1998 1999 2000 2001 2003 2004 2005 2006
∑ SEs 39,704.7 36,761.7 37,804.5 39705.2 39883.1 43372.9 44,684.4 47,006.9 48,822.9
∑ MEs 60.5 51.9 51.8 78.8 80.97 87.4 93.04 95.9 106.7
∑ LEs 2.1 1.8 1.8 5.7 5.9 6.5 6.7 6.8 7.2
Total 39,767.3 36,815.4 37,858.1 39789.7 39969.995 43466.8 44,784.14 47,109.6 48,936.8 Source: Menegkop & UKM (various issues).
Table 3: Unit Structure of SMEs by Sector in Indonesia, 2000, 2005 and 2006 (%)
2000 2005 2006 Sector
SE ME LE ∑ SE ME LE ∑ SE ME LE ∑
1.Agriculture 2.Mining 3.Manufacture
4. Elect, gas & water supply 5.Construction
6.Trade, hotel & restaurant 7.Transport & communication 8.Finance, rent & service 9.Services Total 99.99 99.61 99.48 93.19 97.57 99.54 99.87 83.42 99.60 99.79 0.01 0.35 0.45 5.59 2.24 0.45 0.12 14.63 0.38 0.20 0.00 0.04 0.07 1.22 0.19 0.01 0.01 1.95 0.02 0.01 100.0 100.0 100.0 100.0 100.0 100.0 100.0 100.0 100.0 100.0 99.99 99.67 99.42 92.47 97.43 99.57 99.82 83.65 99.66 99.78 0.01 0.28 0.49 6.18 2.40 0.42 0.16 14.67 0.32 0.20 0.00. 0.05 0.09 1.35 0.17 0.01 0.02 1.68 0.02 0.02 100.0 100.0 100.0 100.0 100.0 100.0 100.0 100.0 100.0 100.0 99.99 99.72 99.40 92.50 97.55 99.55 99.81 85.11 99.67 99.77 0.01 0.23 0.52 6.14 2.26 0.43 0.18 13.37 0.31 0.22 0.00 0.05 0.08 1.36 0.19 0.02 0.01 1.52 0.02 0.01 100.0 100.0 100.0 100.0 100.0 100.0 100.0 100.0 100.0 100.0 Source: Menegkop & UKM (various issues).
Table 4: Unit Distribution of SMEs by Sector in Indonesia, 2000, 2005 and 2006 (%)
2000 2005 2006 Sector
SE ME LE ∑ SE ME LE ∑ SE ME LE ∑
1. Agriculture 2. Mining 3. Manufacture
4. Elect., gas & water supply 5. Construction
6. Trade, hotel & restaurant 7. Transport & communic. 8. Finance, rent & service 9. Services Total 59.23 0.38 6.57 0.03 0.31 24.37 4.70 0.13 4.28 100.0 2.22 0.67 14.91 1.02 3.63 55.36 2.89 11.14 8.17 100.0 1.20 1.18 33.57 3.08 4.42 24.95 3.88 20.60 7.12 100.0 59.11 0.38 6.59 0.04 0.32 24.43 4.70 0.15 4.29 100.0 55.86 0.50 5.95 0.03 0.34 25.89 5.54 0.13 5.76 100.0 1.74 0.69 14.30 0.97 4.08 53.38 4.48 11.22 9.13 100.0 0.85 1.60 36.98 2.98 4.30 21.83 4.67 18.06 8.72 100.0 55.75 0.50 5.97 0.03 0.35 25.95 5.53 0.16 5.77 100.0 53.68 0.54 6.56 0.03 0.33 27.13 5.52 0.15 6.06 100.0 1.57 0.58 15.82 0.90 3.52 54.03 4.46 10.51 8.60 100.0 0.74 1.67 35.47 2.96 4.41 24.11 4.47 17.68 8.50 100.0 53.56 0.54 6.58 0.03 0.34 27.19 5.52 0.17 6.06 100.0 Source: Menegkop & UKM (various issues).
[image:6.612.28.580.507.676.2]Although the Indonesian government has been taking many initiatives to support the capacity building, especially in technology and human resource development, in SMEs, ranging from trainings in production technique, general management (MS/MUK), management quality systems ISO-9000, and entrepreneurship; providing total quality control advice; promoting and supporting subcontracting arrangements between SMEs and LEs (including FDI-based companies) as well as linkages between SMEs and R&D institutions and universities; and establishments of Small Business Consultancy Clinics (KKB), and common service facilities, including laboratory (UPT) in clusters.
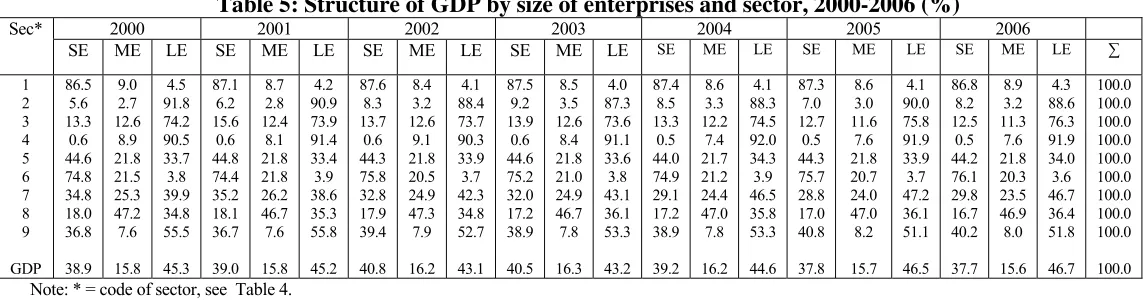
[image:7.612.12.584.313.463.2]The output structure by size of enterprises and sector shows that agriculture has always been the key sector for SEs, as they produce around 86 to 87 percent of total output in the sector. The second important sector for this group of enterprises is trade, hotel and restaurant with their annual share ranging from 74 to 76 percent. MEs, on the other hand has the largest output contribution in finance, rent & servic at around 46 to 47 percent, followed by transportation and communication with a share ranging from the lowest 23.47 per cent in 2006 to the highest 26.22 percent in 2001. In manufacturing industry, both SEs and MEs are traditionally not so strong as compared to LEs (Table 5).
Table 5: Structure of GDP by size of enterprises and sector, 2000-2006 (%)
2000 2001 2002 2003 2004 2005 2006 Sec*
SE ME LE SE ME LE SE ME LE SE ME LE SE ME LE SE ME LE SE ME LE ∑
1 2 3 4 5 6 7 8 9 GDP 86.5 5.6 13.3 0.6 44.6 74.8 34.8 18.0 36.8 38.9 9.0 2.7 12.6 8.9 21.8 21.5 25.3 47.2 7.6 15.8 4.5 91.8 74.2 90.5 33.7 3.8 39.9 34.8 55.5 45.3 87.1 6.2 15.6 0.6 44.8 74.4 35.2 18.1 36.7 39.0 8.7 2.8 12.4 8.1 21.8 21.8 26.2 46.7 7.6 15.8 4.2 90.9 73.9 91.4 33.4 3.9 38.6 35.3 55.8 45.2 87.6 8.3 13.7 0.6 44.3 75.8 32.8 17.9 39.4 40.8 8.4 3.2 12.6 9.1 21.8 20.5 24.9 47.3 7.9 16.2 4.1 88.4 73.7 90.3 33.9 3.7 42.3 34.8 52.7 43.1 87.5 9.2 13.9 0.6 44.6 75.2 32.0 17.2 38.9 40.5 8.5 3.5 12.6 8.4 21.8 21.0 24.9 46.7 7.8 16.3 4.0 87.3 73.6 91.1 33.6 3.8 43.1 36.1 53.3 43.2 87.4 8.5 13.3 0.5 44.0 74.9 29.1 17.2 38.9 39.2 8.6 3.3 12.2 7.4 21.7 21.2 24.4 47.0 7.8 16.2 4.1 88.3 74.5 92.0 34.3 3.9 46.5 35.8 53.3 44.6 87.3 7.0 12.7 0.5 44.3 75.7 28.8 17.0 40.8 37.8 8.6 3.0 11.6 7.6 21.8 20.7 24.0 47.0 8.2 15.7 4.1 90.0 75.8 91.9 33.9 3.7 47.2 36.1 51.1 46.5 86.8 8.2 12.5 0.5 44.2 76.1 29.8 16.7 40.2 37.7 8.9 3.2 11.3 7.6 21.8 20.3 23.5 46.9 8.0 15.6 4.3 88.6 76.3 91.9 34.0 3.6 46.7 36.4 51.8 46.7 100.0 100.0 100.0 100.0 100.0 100.0 100.0 100.0 100.0 100.0
Note: * = code of sector, see Table 4. Source: National Agency for Statistics (BPS)
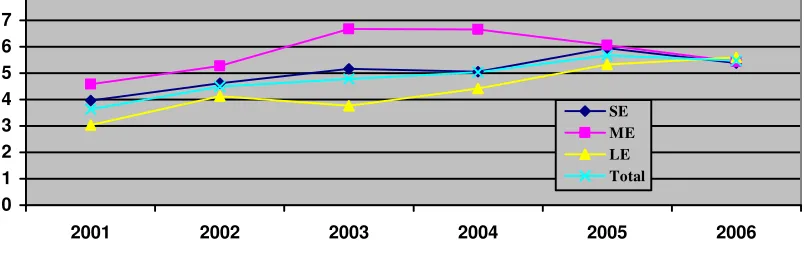
With respect to output growth, the performance of SMEs is relatively good as compared to that of LEs. The output growth of SEs and MEs was respectively 3.96 per cent and 4.59 per cent in 2001 and increased to 5.38 percent and 5.44 percent, respectively in 2006. LEs experienced, on the other hand, a growth rate of 3.04 percent and ended up at 5.60 percent during the same period (Figure 1).
Figure 1: Output Growth Rates of SEs, MEs and LEs, 2001-2006 (%)
0 1 2 3 4 5 6 7 8
2001 2002 2003 2004 2005 2006
SE ME LE Total
Source: Menegkop & UKM (various issues).
Figure 2: GDP growth contribution by size of firms, 2003-2006 (%)
1.88 1.97 2.24 2.15
0.78 0.83 0.94 0.91
2.12 2.22
2.5 2.42
0 1 2 3 4 5 6
2003 2004 2005 2006
LE ME SE
Source: National Agency for Statistics (BPS)
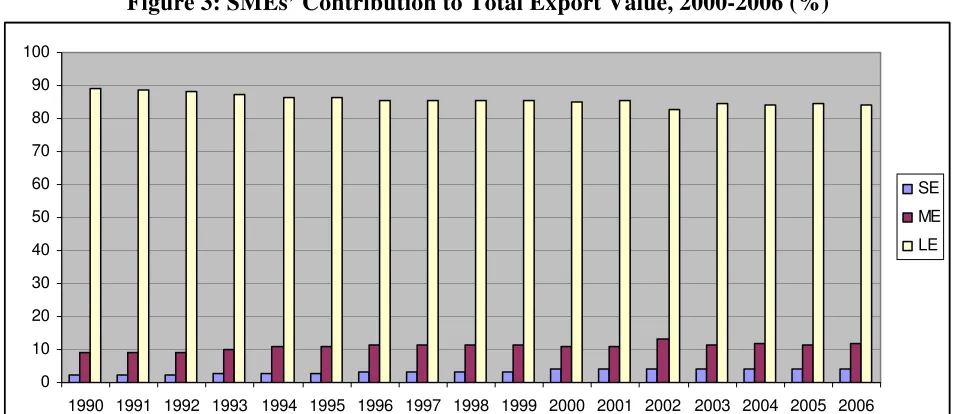
In the last few years, especially since the economic crisis 1997/98, there has been much discussion about the role of SMEs in Indonesia’s non-oil and gas export development, particularly in manufacture. As in many other developing countries, in Indonesia, historically, LEs have been the dominant force not only in domestic sectors but also in export activities, with SMEs, especially the small ones, engaged in exporting in only a very limited way, mainly indirectly through production linkages with LEs or marketing linkages with trading houses/companies or independent exporters. This concern about the export propensity of SMEs in Indonesia has arisen as the government increasingly view export activity as a key source of foreign currencies that together with foreign investment can substitute the country’s foreign debt. Moreover, it is generally believed that the income and job creating potential of SMEs will not be fully exploited unless these enterprises are also involved in exporting (Tambunan, 2006b).8
[image:8.612.106.508.47.174.2]was 11.1 percent, and increased to 15.7 percent in 2006. Within the group of these enterprises, MEs are much stronger than SEs. In 1990, the MEs’ share in total export was 8.9 percent compared to 2.2 percent of SEs, and in 2006 the ratio is 11.81 to 3.89 percent (Figure 3).
In manufacturing industry, the share of SMEs in total export of the sector is very small as compared to their larger counterparts. Within the group, MEs performed much better than their smaller counterparts. As can be seen in Figure 4, the share of SEs never reached 10 percent. In 2000 it was only 3.15 percent and slightly decreased to 3 percent in 2006. While during the same period, the export share of MEs was 12.53 percent and improved to 14.72 percent. Previously, such as Hill (1997, 2001), Tambunan (2006b), and Thee (1993) argue that, although on average per year the export contribution of SMEs in Indonesia’s total manufacturing export is relatively small as compared to that of their larger counterparts, they seem to have shared nicely in the manufactured export boom in the 1980s and 1990s. Thee (1993) concludes that from the point of view of technology and adaptability, export growth of SMEs in manufacturing inudstry has been achieved substantially by finding niche markets and adapting costs and quality to market demand.
Distribution of SMEs’ export by sector shows that the majority of SMEs’ export came from the manufacturing industry (Figures 5A and 5B). Interestingly, the share of MEs’ export originated from this sector is much higher than that of SEs. This significant gap may suggest that in the manufacturing industry, the ability of MEs to export is higher than that of SEs. The difference can be explained by differences in such as access to capital and market information, skills, promotion facilities, and external networks. Naturally, MEs are in a better position than SEs for all these factors, which are crucial in determining the successful of a firm in doing export.
8
Table 6: Exports of SMEs and LEs, 2000-2006 (billion rupiah)
2000 2001 2002 2003 2004 2005 2006
Sector
SME LE SME LE SME LE SME LE SME LE SME LE SME LE
(1) (2) (3) Total
8396.3 657.0 66395.3 75448.6
427.5 74490.8 357135.5 432053.8
9013.6 980.9 70852.1 80846.6
552.7 89811.2 377040.4 467404.3
9771.6 684.7 76833.8 87290.1
962.2 79541.5 339086.3 419590.0
8479.7 583.9 68033.1 77096.7
536.6 77829.2 337773.4 416139.2
8715.3 638.7 86194.2 95548.2
881.8 92822.5 414953.7 508658.0
11535.4 1139.9 97662.7 110338.0
1037.9 132107.3 471249.3 604394.5
12662.7 1621.3 107915.5 122199.5
1078.8 153874.3 501170.5 656123.6
0 10 20 30 40 50 60 70 80 90 100
1990 1991 1992 1993 1994 1995 1996 1997 1998 1999 2000 2001 2002 2003 2004 2005 2006 SE
ME
[image:10.792.193.673.210.417.2]LE
Figure 3: SMEs’ Contribution to Total Export Value, 2000-2006 (%)
Figure 4: Share of SMEs in Total Export Value in Manufacturing Industry, 2000-2006 (%)
0 10 20 30 40 50 60 70 80 90
2000 2001 2002 2003 2004 2005 2006
SE ME LE
[image:11.595.60.538.242.377.2]Source: Menegkop & UKM
Figure 5A: Distribution of SEs’ Export Value by Sector Industry, 2000-2006 (%)
0 20 40 60 80 100 120
2000 2001 2002 2003 2004 2005 2006
Manufacturing Mining Agriculture
Source: Menegkop & UKM
Figure 5B: Distribution of MEs’ Export Value by Sector Industry, 2000-2006 (%)
0 20 40 60 80 100 120
2000 2001 2002 2003 2004 2005 2006
Manufacturing Mining Agriculture
Source: Menegkop & UKM
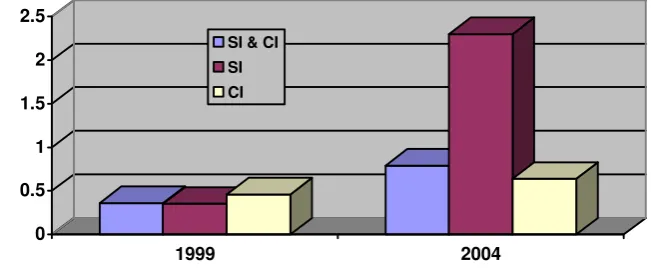
[image:11.595.62.538.424.558.2]Figure 6: Percentage of total number of Manufacturing SEs and MIEs doing Export, 1999 and 2004
0 0.5 1 1.5 2 2.5
1999 2004
SI & CI SI CI
Source: BPS
IV. Technological Capacity and Productivity of Non-Farm SMEs in Indonesia
A number of researchers have attempted to measure the current technological capacity of Indonesian firms in manufacturing industry by examining their productivity. Most of them did by comparing with that of foreign firms, and only a few come with evidence showing that labour productivity in smaller enterprises much lower than that in larger enterprises.9
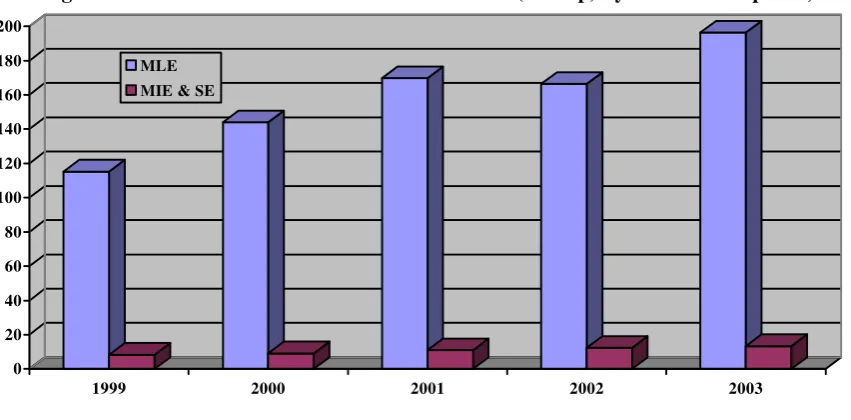
Official data from the National Agency for Statistics (BPS) in manufacturing industry by size category of firms also shows that the value added-number of worker ratio increases by size of enterprises, suggesting that in larger enterprises the level of technology is higher than that in small ones (Figure 7). This is not surprise, since micro enterprises (MIEs; i.e the smallest unit within the SMEs) and SEs in Indonesia (and in many other developing countries) are traditional enterprises using manual production techniques with a low degree of mechanization. By contrast, MEs and especially LEs are usually mechanized and computerized, using advanced technology embodied machines, the production processes are much better managed and organized, and they employ more highly skilled workers. In the food and beverages industry, for instance, MIEs and SEs are very simple, manual processing units supplying mostly to local markets, in very contrast to LEs such as Unilever and Indofood, two giant food companies in Indonesia
However, both the 2006 Rural Investment Climate Survey (World Bank, 2006) and Survey on small scale manufacturing and handicraft data from BPS show that owners of MIEs and SEs do not regard lack of technological capacity as one of their key constraints. Nonetheless, the evidence suggests that in some industries, MIEs are able to improve their technology capabilities. Sandee (1994, 1995, 1996) and Sandee et al. (1994, 2000, 2002), amongst others, show that these smallest and most traditional enterprises are in a position to adopt innovations in products and production process, even without support from the government. Moreover, Sandee (1995) shows that technological capability is a major determinant of firm performance. This suggests that there are substantial benefits from improving technological capabilities.
9 See e.g. Shepherd
Figure 7: Value Added-Number of Workers Ratio (000 Rp) by Size of Enterprises, 1999-2003
0 20 40 60 80 100 120 140 160 180 200
1999 2000 2001 2002 2003
MLE
MIE & SE
Source: BPS
V. FDI
V.1 Source of Technology Transfer
The expected positive effects from the presence of FDI can be distinguished between the macro level or direct effects and the micro level or indirect levels. At the macro level, FDIs are assumed to contribute to the followings: growth in sectoral output, including in manufacturing industry, trade (especially export) growth, employment increases, and hence, overall, economic growth. Whereas, at the micro level, one positive effect of the presence of FDI is transfer of technology or knowledge.
There is a large body of literature on channels through which technology is transferred internationally, and among other channels such as technical licensing agreements between foreign and local firms; imports of intermediate and capital goods; education and training in technologically advanced countries; turnkey plants and project contract; technical consultancies by foreign companies/consultancy firms; and simply through participation in world trade (export), FDI reveals as the most important source of technology transfer to local firms in developing countries.10
Based on his study on the role of FDI in the so-called Newly Industrializing Countries (NICs) such as South Korea, Taiwan, Hong Kong, and Singapore, Soesastro (1998) states the following: there is no doubt that FDI plays an important role in cross-border flows, transfers and the diffusion of technology. The story of technology flows in
the Asia-Pacific region has centred on the dramatic surge in FDI, particularly in the East Asian developing
economies...It is generally believed that FDI brings in more advanced technologies than alternative channels.
This is particularly the case with MNCs, because they play a dominant role in the generation of technology and are
usually associated with new or technologically complex products...(page 312).
This is also supported by many studies evaluating the technology transfer or spillovers from FDI in Indonesia, though not explicitly on local SMEs. For instance, by using cross-sectional data, Sjőholm (1999a,b) and Blomstrőm and Sjőholm (1999) found positive spillovers from FDI in Indonesian manufacturing industry. Their results show that both the level and growth of labour productivity to be higher for locally-owned plants in subsectors with a high foreign share of output. This suggests that foreign firms do play an important role in transfer of technology. Soesastro (1998) also concludes the same: the pattern of inward technology flows for Indonesia seems to be dominated by the use of FDI as the main channel for technology acquisition. In some sense
this has been the country’s implicit ’technology policy’, and the favourable attitude of the government towards FDI
has been based to a large extent on the promise of technology that will be brought in as part of the investment
package (page 319).
Also similar evidence can be found in other Asian developing countries. For instance, Thailand, Tangkitvanich (2004) concludes that linkages between foreign assemblers and domestic suppliers have always been crucial to the competitiveness of the Thai automotive industries. Assemblers have been major sources of
technologies, especially management technology in the areas of quality control and production. The linkages
also enabled domestic suppliers to gain a foothold in the international production network. (page.218).
Thee and Pangestu (1994) assess the technological capability of Indonesian textile, garment and electronics industries to show that in efforts to increase technological capability, Indonesian textile and garment manufacturers established business links with their Japanese counterparts, and that this has been the most important channel of technology transfer. Similarly, business linkages with foreign companies have been a very important channel for the transfer of technology for electronics firms, especially for consumer electronics and electronic components. However, technology transfer in the textile industry was limited to improvements in production capability. Whilst important, more sophisticated activities that might help local firms upgrade their technological capabilities, including activities related to pre-investment, project implementation and technical changes in production or product were conducted by Japanese counterparts.
V.2 Subcontracting as the Most Used Channel
It is generally known that technology transfer from FDI to local firms mostly takes place through subcontracting arrangements (Figure 8). Studies on subcontracting linkages between foreign firms and local SMEs in Indonesia such as by Sato (1998), Iman and Nagata (2002), Tambunan (2007), and Pantjadarma (2004) have one common conclusion that through such production linkages, foreign firms can play an important role for the capacity building, including in technology, in local SMEs.
the developing world, including Indonesia. The sustainability of such inter-firm arrangements naturally is conditional on a durable compliance to exacting requirements for outsourcing and subcontracting.11
Figure 8: Technology Transfer via: Subcontracting
TRANSFER OF TECHN OLOGY
SUBCONTRACTING
FDI SME
In many developing countries, including Indonesia, however, many factors limit the ability of a subcontracting network to perform efficiently: (i) the small industrial sector does not permit production specialisation on any economic scale; (ii) inefficient industrial infrastructure, including raw material supply, makes it difficult for subcontractors to regularly meet the production schedules of the purchasing companies or to compete at cost and quality bases against imports; (iii) the generally weak technology base inhibits subcontracting in that neither side has the necessary technical resources to make the system work; (iv) the purchasing companies tend to be simple assemblers of imported components, usually reluctant to switch to domestic sources of those components; and (v) turnover taxes applied to subcontractors’ products can make it more profitable for potential purchasing companies to keep all manufacture in-house (MoI, 1985).
ROK's experience is of special interest since the rapid development of its subcontracting system allowed the SMEs to greatly expand their role in the manufacture industry (i.e. their contributions to output and exports) in a relatively short period, i.e. the two decades since the mid 1970s. The radical change in industrial size structure during that period was partly a result of the changing composition of industrial output by size groups of enterprises (i.e. SMEs and LEs), and partly due to a policy imperative to spread the fruits of industrial growth more widely (Baek, 1992).12The later shift from low-wage strategy a development model in which inter-firm networks gained importance (Cho, 1995) also played a role.
Differently than in Indonesia, in ROK a dense subcontracting system was built on cultural, economic and policy factors, and on direct incentives. Many linkages rest on mutual trust and interpersonal respect based on social relationships, such as common schooling and regional or family background (Cho, 1995). At the same time, market forces encouraging subcontracting were complemented by government policy and pressure. Some of the new SMEs are spin-offs from the LEs for which they subcontract, while others have a rose independently. Legislation enacted in 1982 specified the SMEs in manufacturing industry to be promoted, excluded LEs from activities reserved for SMEs and promoted subcontracting (Cho, 1995). Since the late 1980s, externalization (transfer of production activities formerly handled within the LEs) to SME subcontractors occurred rapidly (Berry, 1997).
11
See, e.g. Altenburg (1999), Gereffi (1999), and Humphrey (1998).
12 The share of firms with revenue from subcontracting rose from 18.6% in 1968 to 70% in 1990 (Kim and Nugent, 1993). In 1990
ROK has thus been unusually vigorous in its promotion and mandating of SMEs-LEs production linkages, as it has in overall SME support policy, where a wide variety of institutions and programs cater to perceived needs. Kim et al (1995) report that though few of these publicly provided services were given high average ratings for importance by a set of SME exporters in four industrial sectors, virtually all firms reported considerable benefit from one or another of the sources. The support system as a whole thus appears to have a considerable positive impact. The question from the perspective of other countries is the extent to which ROK's policy of mandating and nurturing increased vertical linkages might be replicable (Berry, 1997).
While the transfer of technology in its most dynamic form is a two way process, from manufacturer/ assembler to subcontractor and vice versa, it is a common policy choice of developing countries, including Indonesia, to first encourage transfer downwards from the manufacturer/assembler to the subcontractor, or in this case from LEs/MNCs to local SMEs which are generally without easy access to foreign technology. Indeed, in the literature on SMEs development in developing countries, subcontracting is stated to have an important role as a source of technology transfer to SMEs. For instance, Morcos (2003) argues that subcontracting arrangements act as very efficient mechanisms and tools for the technological enhancement of SMEs. By engaging in an active collaborative agreement with specific customers, suppliers and subcontractors benefit from a large amount of technology transfer. In Dunning’s (1993), technology refers to all forms of physical assets, knowledge and human learning and capabilities that enable the efficient organization of goods and services. So, in order to ensure that the inputs required to complete the production of goods meet some standard level, contractors including MNCs can provide suppliers/subcontractors not just with specifications but sometimes also with assistance in raising their technological capacities. UNCTAD’s 2001(b) World Investment Report indicates that “strong linkages can promote production efficiency, productivity growth, technological and managerial capabilities and market diversification in supplier firms”.
Moreover, according to UNCTAD (2001b), technology transfer through subcontracting can take one of three forms. The first area of technology transfer relates to product technology (UNCTAD, 2001b) which occurs via the following routes: (i) provision of proprietary product know-how; (ii) transfer of product designs and technical specifications; (iii) technical consultations with suppliers to help them master new technologies; and (iv) feed-back on product performance to help suppliers improve performance.
supplier’s premises in order to provide advice on factory layout, installing machinery, production planning, production problems and quality control. Moreover, this could also consist of sending affiliates’ engineers to the supplier’s factory for a specific period.
The third area, contractors can lead to the transfer of organizational and managerial know-how. This can take several forms: (i) assistance with inventory management and the use of just-in-time and other systems; (ii) assistance in implementing quality assurance systems (including ISO certification): Some companies may provide support to their suppliers in designing and implementing quality assurance systems or total quality control techniques; (iii) introduction to new practices such as network-management or financial, purchase and management methods.
According to Hondai (1992) quoted in Hayashi (2002b), subcontracting agreements enables SMEs to reduce information and transaction costs through the easy and cheap acquisition of new technologies, product designs, production processes, management methods, marketing and input materials from LEs. In some cases, this could eventually lead to an ability to conduct research and development activities and hence to develop and innovate in the technology or process involved.
V.3 Indonesian Policy towards Development of Subcontracting
Indonesian government’s efforts to promote subcontracting as a means for technology transfer are reflected by its policies on subcontracting and local content. Legislation regulating local content and subcontracting in the Indonesian engineering industry dates back to 1976 when Ministerial Decree No.307 was announced specifying a 4-year program for the deletion of specified parts from the imported CKD packs for commercial motor vehicles. This decree was soon followed in 1977 by a similar decree applying to motorcycles and scooters. Subcontracting regulations were first introduced in the 1981 motorcycle decree which specified whether each nominated component could be made “in-house” (by the assembler), or must be made “out-house” (by a subcontractor). By January 1985 decrees on the local content of simple types of machine tool were announced. It is therefore not surprising that vertical inter-firm linkages and subcontracting networks in Indonesia have proliferated in the automotive industry, and to a lesser extent in the machinery industry. Generally speaking, the overwhelming emphasis of the deletion program decrees has been on local content, with subcontracting requirements forming only a minor part.
Prior to the first attempt to regulate subcontracting activities in the manufacturing industry as part of the deletion program, a system whereby LEs acted as parent companies in subcontracting arrangements with small and medium scale subcontractors was in operation. By 1980 there were some 30 big companies involved in what had become known as the Foster Parent system. Nine of these companies belonged to the engineering subsector (MoI, 1985):
1. P.T. Krakatau Steel
2. P.T. Astra (Toyota, Daihatsu, Honda, Komatsu) 3. P.T. Kubota Indonesia
4. P.T. Semarang Makmur
5. P.T. Indonesia Steel Tube Works, Ltd. 6. P.T. Boma Bisma Indra, Surabaya 7. P.T. Rheem, Jakarta
8. Perusahaan Galangan Kapal, Palembang 9. P.T. Krama Yudha Tiga Berlian (Mitsubishi).
In the last 5 to 10 years, many studies have been conducted explicitly or implicitly on the importance of subcontracting as a means for LEs/MNCs to transfer technology to SMEs in Indonesia. For instance, IMG Consultants Pty Ltd (Sydney) together with PT. Unecona Agung (Indonesia) conducted a survey on some of the above mentioned big companies and their subcontractors (MoI, 1985). They argued that SMEs can only get involved when the technology embodied in the parts is sufficiently simple to be mastered by an inexperienced and unsophisticated organization. Their findings show two best-developed subcontracting networks, namely those organized by P.T. Agrindo in Surabaya and P.T. Kubota Indonesia in Semarang. The first company manufactures agricultural machinery, mainly rice huskers and millers, in a very crowded factory shared with sister companies which, amongst other things, assemble small Mitsubishi diesel engines. The second company assembles small Kubota diesel engines competitive with the Mitsubishi and Yanmar products.
P.T. Agrindo uses SMEs (mostly SEs) extensively as its subcontractors to machine components for its agricultural machinery. The company provides detailed specifications for each component and trains the owners of these SMEs to produce parts to specification, often providing the necessary materials, and even the machine tools and gauges in some cases. They carry out 100 percent inspection on incoming parts and claim to have almost no assembly problems. The use of subcontractors allows the company to concentrate on its own task in-house and achieve high output from its subcontractors. P.T. Kubota Indonesia has also achieved higher local content than Mitsubishi and Yanmar for similar engines, and most of the local content is attributed to many SMEs as its subcontractors in the Semarang and Klaten areas of Central Java.
understood the manufacturing procedures and specifications, and exercised adequate quality control. In some cases, this included education in the basic concept of tolerances. In one case the assembler rendered assistance in developing jointly the component designs, and in the purchase of capital equipment.13The parent company also provided training in management and related subjects to the managers of subcontracting firms. One assembler company, for example, provided special training to the subcontractor’s technicians in production methods, quality control, and even in machinery layouts.
These findings are also supported by Thee (1985) who reported subcontracting linkages between small-scale metalworking and machinery parts supplier firms and large-scale diesel engine assembler firms in the early 1980s. This case study found that some kinds of assistance were provided to small firms through vertical inter-firm linkages such as QC (quality control) support, credit, supply of raw materials and managerial training. Thee concluded, however, that subcontracting networks remained weak and fluid, and did not sufficiently improve the technical and other capabilities of SMEs.14
Harianto (1996) from his analysis on characteristics of subcontracting transactions in local Indonesian firms in the early 1990s, taking bicycle, pumps for oil and trading of garment products as his cases, shows that a large manufacturer of oil pumps provided its subcontracting SMEs with support in several areas, particularly technology and finance. Similarly, a large bicycle assembler firm extended technical, quality control (QC) and managerial support to small-scale supplier firms through the dispatch of engineers. The parent firm sometimes involved its subcontractors in parts design and organized study tours that took them to foreign bicycle industries in, for example, Taiwan. Through subcontracting, the bicycle assembler firm also gave its parts supplier firms opportunities to negotiate price levels based on the cost plus fee method. He found that the expected benefits from subcontracting transactions prevented both supplier and assembler firms from pursuing short-term gains by behaving opportunistically. The bicycle assembler firm recognized the benefits of subcontracting linkages including information on the technical and managerial reliability of SMEs as parts suppliers, while the parts suppliers perceived gains such as information on the production plans of the assembler firm and large and continuous orders in the longer term. He pointed out that subcontracting linkages in the machinery sector (bicycle and pumps for oil as his specific cases) have been intense because of the nature of the production processes and technologies, the quality standard required in the final markets and the competitiveness of the markets. As with other mentioned studies, this study suggests that vertical inter-firm linkages occur relatively more frequently in the machinery sector than in other sectors.
Sato (1998) traced the development of subcontracting networks in the Indonesian motorcycle industry in the mid-1990s. She examined the subcontracting networks of Honda motorcycles, one of its main subcontractors PT
13
The assembler emphasized, however, that the component assigned to subcontractors were generally non-essential components, while the essential components were still being manufactured in-house or imported.
14
Adhi Wijayacitra, and a suppliers’ grouping, PT Usbersa Mitra Logam.15She observed that lower-layer (second- and third-layer) parts supplier firms had emerged relatively recently and that under multi-strata subcontracting chains, SME support had been extended by both higher-tier supplier firms and assembler firms. In her case study, one large-scale motorcycle manufacturer provided assistance in establishing a first-tier supplier firm owned by an ex-employee. The first-tier parts producer, in turn, assisted its employees to spin out of the firm to establish new enterprises that served it as second- or third-tier supplier firms. It provided these spin-off supplier firms with various forms of assistance including technical, managerial, marketing and financial support.
Supratikno (1998) investigated subcontracting arrangements as a competitive strategy and production organization for assembler firms in the mid-1990s, looking in detail at three assembler firms engaged in the production of motorcycles, diesel engines and brass handicrafts, and he concluded that subcontracting relationships can facilitate the growth of supplier SMEs and help them overcome development constraints such as unstable markets and low quality and technology, although the contribution of subcontracting to the competitiveness of parent firms was not significant.
Urata (2000) found that some assembly makers such as the Astra Foundation provide active support to SME subcontractors in the form of training, etc. Some large foreign enterprises have training facilities not just for their own group enterprise but also for Indonesian enterprises. Some industrial associations also provide training for employees of their member enterprises. Urata’s third recommendation is encouragement of commitment on the part of private enterprises to the development of supporting industries, for example the provision of tax incentives to facilitate the access of SMEs to training facilities established by the private sector.
As explained in Aswicahyono, et al. (2000), much of the official thinking in Indonesia in the 1970s envisaged Japanese-style subcontracting networks, characterized by stable, durable and intense ties between the two groups of firms, and in which the assemblers would be the dynamic agents of technology transfer to SMEs. There are such cases, especially where employees of assembler companies have established their own supplier operation tied exclusively to their former employer. However, in Indonesia such instances are rather rare. From her own observation, Sato (1998b) states that the more common pattern in Indonesia is for both parties to engage in opportunistic behavior: relationships are typically shallow, short term and non-exclusive, quite different from those found in Japan.
15
Aswicahyono, et al. (2000) explain some reasons for these differences: with a highly segmented and small market, supplier firms in Indonesia seeking to achieve scale economies are forced to serve several assemblers.
Assemblers have tended to eschew long-term relationships with Indonesia’s myriad small-scale producers of
low-quality replacement parts, owing to these firms’ high mortality rates and to the difficulties associated with
appropriating the returns from investment in their skill base. As noted, foreign investors who are unable to
secure majority ownership are reluctant to transfer technology. The government’s industrial extension efforts
have also been weak and sporadic. Moreover, many of the assemblers themselves possess limited technological
capacity, and are therefore not in a position to act as agents of technology transfer…..(page 233-234).
Berry et al. (2001) pointed out that the majority of SMEs, especially in less developed countries (LDCs), are generally less able to improve production technology, product design, quality management, and other technology upgrade related areas successfully on their own than their larger counterparts. From their case studies in rattan and wooden furniture, and garment industries, Berry and Levy (1999) pointed out that subcontracting agreements provided SMEs in Indonesia with an important opportunity to improve such areas. Subcontracting is also a prevailing way of channeling SME products into export markets and that it has played an important role in disseminating technologies relevant for export production to SMEs. Also a case study focusing on the wooden furniture industry in Jepara (Central Java) allowed Sandee at al. (2000) to conclude that quality control (QC), standardization and sophisticated finishing provided by LEs through subcontracting ties enabled small-scale furniture producers to participate in export production.
Using a sample of 61 interviews of local metalworking and machinery SMEs in the Indonesian automobile and motorcycle industries, Hayashi (2002b) found that vertical inter-firm cooperation through commercial transactions was perceived as one of the most effective sources of technical and marketing support to SMEs. This finding coincides with the theoretical counterpart of the study which indicates that a positive relationship exists between subcontracting ties and technological and marketing capabilities of SMEs. Hayashi furthered his study of Indonesia based on an interview and questionnaire-based field survey carried out between August 1999 and March 2000 on SMEs in the metalworking and machinery industries which supplied their products or processing services to automobile, motorcycle, agricultural machinery and bicycle producers. The study found that the role of subcontracting linkages in improving labour productivity of SMEs is pivotal. According to the estimated production functions, the subcontracting ratio is a dominant variable in explaining variations in labour productivity. Also, indices of total factor productivities vary in line with the contribution of subcontracting to total factor productivity. His findings indicate that subcontracting linkages are beneficial to SMEs in improving their productivity.
some exceptions such as general machinery. SMEs in automobile parts experienced rapid TFP growth of more than 10 percent annually. SMEs in the Indonesian machinery sector increased TFP to a significant degree during that period. How were these SMEs able to achieve such high rates of TFP change? An increase in TFP can be achieved through the development of technology. Technological upgrading in this context includes not only investment in better machinery and equipment but also improvement in production technology, product design, quality management, workplace organization, inventory management and so on. However, as often stated in the literature (e.g. Berry et al., 2001), the majority of SMEs are generally less able to improve such areas successfully on their own than LEs. From this point of view, Hayashi argues that subcontracting ties with LEs may possibly have been an important source of technological improvement for SMEs. It seems reasonable to hypothesize that the rapid TFP growth of Indonesian machinery SMEs in 1986-96 can be attributed to some extent to the role of subcontracting in providing them with opportunities to acquire knowledge of how to upgrade technological capabilities.
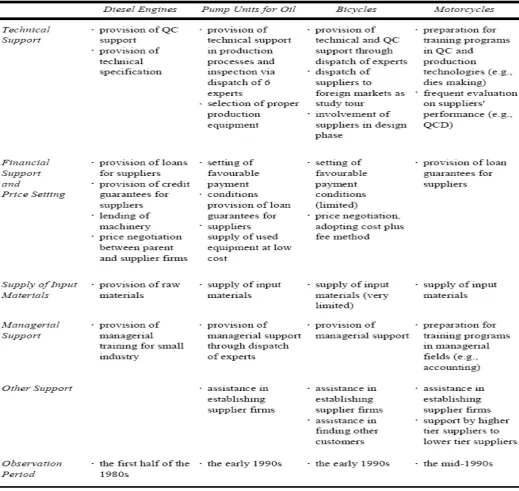
Hayashi (2002c) also made a comprehensive review of case studies on subcontracting between SMEs and LEs (including FDI-based companies) in Indonesia. Many of the case studies on subcontracting linkages in the Indonesian manufacturing industry focused on the machinery sector.16Based on these case studies, he summarizes several types of support for small-medium supplier firms extended by large parent firms through subcontracting transactions in the machinery industry in Indonesia as given in Table 7.
16
Table 7: Support from Parent Firms through Subcontracting Linkages in Indonesia's Machinery Industry
Source: from Table 12 in Hayashi (2002c)
However, industrial development in Indonesia did not follow the same pattern as in Japan. On the contrary, the local content policy resulted in a vertically integrated production system within LEs. The Asia Foundation (TAF, 2000) argues that the lack of success of this policy in creating strong interdependence between SEs, MEs and LEs was largely due to the government’s excessive interference, aimed at replacing the market mechanisms.17Similarly, Thee (1990b, 1997) argues that such production linkages did not develop smoothly during the New Order era because of market distortions and the lack of skills and low technological capabilities of local firms, especially SMEs.18
Although the mandatory deletion programs during the New Order era were largely unsuccessful in developing viable domestic supplier firms, successful private-led subcontracting networks did arise in some industries, with the evidence showing that these arrangements did successfully facilitate technological capacity building. For example is the case of Astra Otoparts, part of the Astra international business group, Indonesia’s largest integrated automotive company. Through Astra Otoparts, Astra international was able to develop several SMEs into efficient and viable suppliers. As a result of the rigorous training which Astra provided to local suppliers with potential, overtime, these suppliers were able to produce a wide range of parts and components for cars and motorcycles according to the strict quality standards set by Astra, and also to meet its strict delivery schedules.
VI. FDI from Japan and ROK in Indonesia VI.1 Recent Development
Indonesia has been a very attractive market for the foreign investors since its time of independence. A number of foreign companies, most of them large MNCs, have invested in the Indonesian market in certain areas. These companies have contributed a lot in the development of the country's resources, building infrastructure, establishing manufacturing facilities for export and/or provide products and services for the domestic market. The Indonesian market is a very hot perspective for investment and there are numerous opportunities available for setting up a company.
The government of Indonesia itself is quiet interested in inviting new foreign companies and attracting more and more investments in the country. This policy had been adopted by the Indonesian government from the very beginning and therefore it has taken several measures in this regard. To encourage the FDI in the country, the Indonesian government introduced the Foreign Investment Law No. 1/1967 in the year 1967. However, this legislation excluded oil and gas, banking, insurance and leasing sectors. This law provided a number of incentives to the investors such as tax exemptions and some guarantees. Though in the beginning, the Indonesian government adopted an open door policy but in later years they changed their strategy. In the year 1970, some of
17
the sectors were closed for foreign direct investments. In the coming years these policies were made further strict because of the protest from the public on the over presence of Japanese investors. After these restrictions the foreign investors were required by law to invest their capital with a local partner in the form of joint venture. The restrictive regulations also had the aim to speed up the process of transfer of shares to the Indonesian partners of investors. However, in the later years the end of oil boom and other crisis forced the Indonesian government to deregulate the economy and to adopt more liberal policies to attract foreign investment, especially FDI, in the country.
Recently, the Investment Coordinating Board of Indonesia (BKPM) has proposed to the government to adopt more effective measures to encourage foreign investments in the country. Their proposal included the suggestion to open all business sectors to foreign investors, except for a few ones which are considered sensitive to the country's security. The Board passed a bill and after some delays, it has been implemented since last year. It is expected that this new foreign investment law will further make more efficient to the process of FDI by shortening the restrictive investments list and leaving only a few sectors, such as religion, culture, environment and small and medium enterprises, prohibited for foreign investments. This law is going to bring a more liberalized attitude in the policies of the Indonesian government. In the past, the government of Indonesia has maintained a very lengthy prohibitive investment list, which had totally or partially closed several business sectors to foreign investment. The most recent list issued by the government was the list released by the administration of the former President Abdurrahman Wahid. This list had even banned the foreign investments in the print media, television and radio sectors. However, it has also awarded the foreign investors with more opportunities in the telecommunications sector, air transportation and port management, power generation, transmission and distribution, shipping, drinking water supply, and atomic power generation. However, even in these sectors the foreign companies or investors were required to enter with the cooperation of the local partners. The argument given by the administration in favor of this policy was that the investment liberalization aimed at by the future law intended to strengthen competition in the country and boost the efficiency of the country's industrial sector. This was supposed to benefit the general public at large as the increase in competition in these "open" sectors will force the companies to operate efficiently and cut prices to win market share.
With the implementation of this new foreign investment law, the government will keep an equal control over the foreign and domestic investors. The government intends to establish certain departments and supportive bodies in order to speed up the investment licensing procedures. The government will also provide some incentives to foreign investors, including tax incentives. With the introduction of the new investment law, the foreign investors will be able to confidently make the investment decisions as it will give them more legal certainty. One more problem is the increase in the level of political disturbances in the country and other security related problems which make a foreign investor more and more hesitant to come to Indonesia.
18
From the introduction of the Foreign Investment law in the year 1967 until today, the level of FDI approved has reached the mark of US$ 234.147,8 million. The number of projects being approved by this time has reached to the point of 9.784 Projects. These projects are mainly established in the sectors of Oil & Gas, Mining, Banking and Financial Services. The major investing partners of the Indonesian economy are Japan, UK, Singapore, Hong Kong, China, Taiwan, USA, Netherlands, ROK, Germany and Australia. The companies from these countries have invested in about 24 major sectors including Trade, Industry, Property, Plantation, Services, Infrastructure, Construction, Fishery, and Franchises. The main hub for foreign direct investors is the island of Java. Though, the islands of Sumatra, Kalimantan, and Sulawesi are also of significant importance but their importance is secondary.
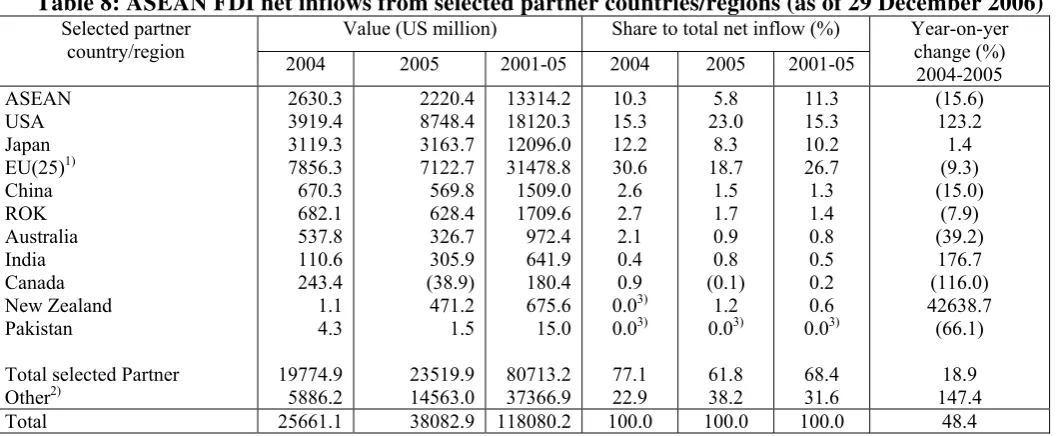
[image:26.595.27.556.304.522.2]Next two tables and figures may give a real picture about the importance o Korean versus Japanese FDI in ASEAN and in Indonesia in particular in recent years. As can be seen, Japanese FDI is still dominant, while FDI from ROK keeps increasing, though at a lower rate that that of Japanese FDI
Table 8: ASEAN FDI net inflows from selected partner countries/regions (as of 29 December 2006) Value (US million) Share to total net inflow (%)
Selected partner country/region
2004 2005 2001-05 2004 2005 2001-05
Year-on-yer change (%) 2004-2005 ASEAN USA Japan EU(25)1) China ROK Australia India Canada New Zealand Pakistan
Total selected Partner Other2) 2630.3 3919.4 3119.3 7856.3 670.3 682.1 537.8 110.6 243.4 1.1 4.3 19774.9 5886.2 2220.4 8748.4 3163.7 7122.7 569.8 628.4 326.7 305.9 (38.9) 471.2 1.5 23519.9 14563.0 13314.2 18120.3 12096.0 31478.8 1509.0 1709.6 972.4 641.9 180.4 675.6 15.0 80713.2 37366.9 10.3 15.3 12.2 30.6 2.6 2.7 2.1 0.4 0.9 0.03) 0.03) 77.1 22.9 5.8 23.0 8.3 18.7 1.5 1.7 0.9 0.8 (0.1) 1.2 0.03) 61.8 38.2 11.3 15.3 10.2 26.7 1.3 1.4 0.8 0.5 0.2 0.6 0.03) 68.4 31.6 (15.6) 123.2 1.4 (9.3) (15.0) (7.9) (39.2) 176.7 (116.0) 42638.7 (66.1) 18.9 147.4
Total 25661.1 38082.9 118080.2 100.0 100.0 100.0 48.4
Notes: 1) includes Austria, Belgium, Cyprus, Czech Rep., Denmark, Estonia, Finland, France, Germany, Greece, Hungary, Ireland, Italy, Latvia, Lithuania, Luxembourg, Malta, the Netherlands, Poland, Portugal, Slovakia, Slovenia, Spain, Sweden, and United Kingdom; 2) included inflow from all other countries, including Russia as well as total reinvested earnings in the Philippines (local banks only) for 2001-2005 and inter-company loans in Singapore for 2005; 3) less than 0.1%.
Figure 9: Japanese and Korean FDI projects approval in Indonesia by year in December*, 1992-2006 (mill. US dollar)
0 200 400 600 800 1000 1200 1400 1600
1992 1993 1994 1995 1996 1997 1998 1999 2000 2001 2002 2003 2004 2005 2006 * Japan
Korea
[image:27.595.23.558.272.476.2]Note: * in 2006 from November. Source: BKPM
Table 9: Top ten sources of ASEAN foreign direct investments inflow (as of 29 December 2006)
Country1) Value (US million) Share to total inflow (%)
2004 2005 2001-05 2004 2005 2001-05
EU(25) USA ASEAN Japan Cayman island Taiwan
Other Central & South America2) Bermuda
ROK China
Total top ten sources Other3) 7856.3 3919.4 2630.3 3119.3 1658.93 305.8 (25.3) 486.3 682.1 670.3 21303.4 4357.7 7122.7 8748.4 2220.4 3163.7 4372.9 306.6 662.9 933.3 628.4 569.8 28729.2 9353.7 31478.8 18120.3 13314.2 12096.0 7333.9 4258.3 3396.0 3160.4 1709.6 1509.0 96378.5 21701.7 30.6 15.3 10.3 12.2 6.5 1.2 (0.1) 1.9 2.7 2.6 83.0 17.0 18.7 23.0 5.8 8.3 11.5 0.8 1.7 2.5 1.7 1.5 75.4 24.6 26.7 15.3 11.3 10.2 6.2 3.6 2.9 2.7 1.4 1.3 81.6 18.4
Total 25661.1 38082.9 118080.2 100.0 100.0 100.0
Notes: 1) identified based on cumulative FDI inflow from 2001-2005; 2) includes countries in the region other than Argentina, Brazil, Mexico and Panama; 3) includes inflow from all other countries, as well as total reinvested in the Philippines (local banks only) for 2001-2005 and inter-company loans in Singapore fro 2001. Ranking is based only on countries where data is available.
Source: see Table 7.
Figure 10: Japanese and Korean Shares in Total FDI projects approval in Indonesia by year (from January to December*), 1992-2006 (%)
0 5 10 15 20 25
1992 1993 1994 1995 1996 1997 1998 1999 2000 2001 2002 2003 2004 2005 2006 Korea
Japan
[image:27.595.66.530.561.722.2]VI.2 Korean Companies in Indonesia
Historically, FDI by ROK companies was for the most part dissuaded for balance-of-payments reasons, except as much as was strictly necessary to secure natural resources and move into export markets. Korean FDI was promoted to the extent that the balance of payments improved and as it became increasingly apparent that such investment was needed to consolidate the international production networks of Korean companies and backstop their efforts to acquire world class R&D.
Korean FDI began to gain momentum in the late 1980s, prompted by changing legal and economic circumstances. By the late 1980s, Korean FDI increased significantly, triggered by the changing domestic and international environment. An important turning point came in 1986 when the country recorded remarkable export growth and enjoyed a sizeable current-account surplus. The success of Korean exports provoked a response in the form of new trade barriers and restrictions in several major export markets; hence, there was a growing need to establish plants in those markets. At the same time, rapid domestic wage increases eroded the cost-competitive advantages of domestic production in foreign markets. These examples suggest that global pull and domestic push factors made it increasingly necessary for Korean firms to internationalize. During the late 1980s, various initiatives were taken to strengthen Korean competitiveness, from relocating production to low-wage countries to relaxing somewhat the existing regulations and restrictions on inward FDI in order to increase competition for Korean companies in their own market (Hee-Jung Suh, 2005).
The globalization strategy of Korean firms in the 1990s drove further an increase in FDI outflows, but, the 1997 financial crisis caused Korean FDI to decline dramatically. In 2003, when the country’s economy emerged from that crisis, Korean FDI began to recover. Notably, 54% of overseas affiliates have been established since 2000, which means that the profile of Korean OFDI is recent and changing rapidly. In effect, Korean FDI started over in a much more considered and cautious manner (Hee-Jung Suh, 2005).
Lee (2004) studied the motivations of Korean FDI. His theoretical background is that there are at least two explanations for the motivations of FDI, one involving trade barriers (horizontal-FDI) and the other factor proportions hypothesis (vertical-FDI). The first view is that MNCs act in order to overcome trade barriers, and the second view is that MNCs arise to take advantages of international factor price differences, mainly regional differences in labor wages. From these two propositions, it can be said that MNCs have no interest or they are not required to subcontract parts of their productions in the host country to local firms. So, using recent, detailed data on a selective sample of Korean MNCs, all in manufacturing industries in many countries, including Indonesia, he investigated to what extent Korean MNCs activity is consistent with the factor proportions theory, and he also studied the market access motivation for Korean MNCs activity
host-country’s economic size and skill-intensity. He also finds evidence of Korean FDI with marketing-seeking motivation or horizontal in nature. Affiliate local sales are higher in countries that have large markets like Indonesia. This suggests that local sales of Korean FDI are more attractive in large market, which is consistent with a marketing-seeking FDI.
As shown by recent report on Korean FDI from the Export-Import Bank of Korea in 2006, one novel feature of the current increase in Korean FDI is that not only are LEs engaging in FDI, but SMEs are doing so as well. Currently there are more than 20,000 Korean firms operating in overseas territories. Although this number is relatively small given the size of the Korean economy, every year around 3,000 Korean FDI firms are setting up overseas, suggesting that many investments are undertaken by SMEs. In 2006, Korean FDI by LEs reached US$ 6.3 billion, while SMEs accounted for US$ 3.4 billion. The proportion of Korean FDI conducted by SMEs increased constantly up to 2005, then dropped off in 2006.
During the period 2000-2006, the manufacturing sector represented the largest portion of Korean FDI, with US$ 21.4 billion (51.8%), followed by services (40.7%) and mining (7%). In Indonesia manufacturing industry, Korean FDI is also important with Samsung Electronics Company (SEC) and LG Electronics (LGE) as the leading companies. These companies have traditionally invested overseas primarily to secure local markets and establish export platforms; and in Indonesia the main motivation of these two companies is market seeking, as Indonesia has a huge domestic market.
<