www.elsevier.com/locate/jinsphys
Nutrient absorption and utilization by wing and flight muscle
morphs of the cricket
Gryllus firmus
: implications for the trade-off
between flight capability and early reproduction
Anthony J. Zera
*, Tammy Brink
School of Biological Sciences, University of Nebraska, Lincoln, NE 68588, USA
Received 21 June 1999; accepted 14 January 2000
Abstract
Absorption efficiency (AD, approximate digestibility, assimilation efficiency) of various macronutrients and conversion of absorbed nutrients to biomass (ECD) were compared among the two types of flightless morph and the flight-capable morph of the cricket,Gryllus firmus. No biologically significant phenotypic or genetic difference in AD for carbohydrate, protein or lipid was observed among morphs fed either a high-nutrient (100%) or a low-nutrient (25%) diet. Thus, previously-documented differences among adult morphs in carbohydrate and lipid content must be caused by processes other than variation in nutrient absorption by morphs during adulthood. Relative absorption efficiency of total dry mass of food by morphs of G. firmusappears to be a valid indicator of relative AD of total calories. Morphs did not differ phenotypically or genetically in the excretion of end products of nitrogen metabolism (uric acid, hypoxanthine plus xanthine) on either the high nutrient or the low nutrient diet. Nutritional indices corrected for excreted nitrogenous metabolites were very similar to uncorrected indices, and the pattern of variation among the morphs was the same for corrected or uncorrected values. Each of the two types of flightless morph converted a greater proportion of absorbed nutrients into body mass, mainly ovaries, and allocated a smaller proportion of assimilated nutrients to respiration than did the flight-capable morph. Moreover, the trade-off between respiration and early reproduction was substantially magnified on the low nutrient diet. These results extend previous findings of a trade-off between flight capability and early reproduction in wing-polymorphicGryllusspecies (1) to diets of very different nutrient quantity, and (2) to flightlessness arising from different causes: blockage of flight muscle development in juveniles vs histolysis of fully-developed flight muscles in adults.2000 Elsevier Science Ltd. All rights reserved.
Keywords:Wing polymorphism; Nutritional indices; Absorption; Assimilation; AD; ECD; Trade-off; Crickets;Gryllus
1. Introduction
Wing polymorphism is a phylogenetically-widespread and ecologically important feature of insects (Harrison, 1980; Roff, 1986; Dingle, 1996; Zera and Denno, 1997). The polymorphism involves discontinuous variation in a wide variety of traits involved in dispersal and repro-duction. One morph has fully developed (long) wings and flight muscles and is capable of dispersal [denoted as “LW(f)”]. Another morph never fully develops wings and flight muscles and is obligately flightless [denoted
* Corresponding author. Tel.:+1-402-472-2768; fax:+ 1-402-472-2083.
E-mail address:[email protected] (A.J. Zera).
0022-1910/00/$ - see front matter2000 Elsevier Science Ltd. All rights reserved. PII: S 0 0 2 2 - 1 9 1 0 ( 0 0 ) 0 0 0 4 1 - X
“SW”]. Finally, in many species, a second flightless morph is derived from long-winged adults by histolysis of the fully-developed flight muscles [denoted “LW(h)”; Zera et al., 1997]. Importantly, in each of the flightless morphs, ovarian growth begins earlier than in the flight-capable, long-winged morph. That is, flight capability is negatively associated with (i.e. trades off with) repro-ductive output (Roff, 1986; Dingle, 1996; Zera and Denno, 1997).
and flight capability in crickets of the genus Gryllus (Mole and Zera, 1993; Zera and Mole, 1994; Zera and Denno, 1997; Zera et al., 1998). The most important finding of these studies is that flightless females, in each of three Gryllus species, converted a greater proportion of absorbed nutrients into biomass (mainly ovaries) dur-ing the first 1–2 weeks of adulthood. This increased degree of nutrient conversion (increased ECD; see Sec-tion 2 for definiSec-tions) by flightless females results from decreased energetic (respiratory) costs associated with that morph. These decreased costs have not been defini-tively identified, but they most likely result from reduced flight muscle maintenance, reduced lipid (flight fuel) biosynthesis, or a reduction in the general activity of flightless individuals (Zera et al., 1998).
In contrast to the consistently elevated ECD of flight-less females of threeGryllusspecies, nutrient absorption (AD, absorption efficiency, approximate digestibility; assimilation efficiency; Waldbauer, 1968; Woodring et al., 1979; van Loon, 1989) differed only modestly or not at all between morphs of these species (Mole and Zera, 1993; Zera and Mole, 1994; Zera et al., 1998; see Sec-tion 4). Hence, increased conversion of absorbed nutri-ents was viewed as being more important than increased absorption of nutrients in providing the material for increased egg production of flightless females during early adulthood (Zera and Denno, 1997; Zera et al., 1998).
As had been done in many nutritional index studies in insects (Waldbauer, 1968; Slansky and Scriber, 1985; van Loon, 1989), nutritional indices were estimated in various Gryllus species by quantifying the dry masses of food consumed and material excreted, coupled with the dry mass gain of individual crickets. Measurement of absorption by this method has several well-known shortcomings (Waldbauer, 1968; Slansky and Scriber, 1985; van Loon, 1989). For example, excreted material consists of end products of nitrogen metabolism (e.g. uric acid), as well as unabsorbed food. The failure to determine the proportion of excreta that results from metabolic end products, as opposed to unabsorbed food, introduces errors into estimates of AD and other indices based on absorption (e.g. ECD). Furthermore, AD, cal-culated from the dry masses of food consumed and material excreted, provides no information on assimi-lation of individual nutrients such as carbohydrate or lipid. The failure to take into account differences between morphs in the absorption of various nutrients could lead to erroneous conclusions about the energetic causes of morph-specific adaptations (see Section 4).
The main purpose of the present study was to obtain information on absorption of various macronutrients and the excretion of end products of nitrogen metabolism by wing and flight muscle morphs of Gryllus. We were especially interested in determining whether wing morphs differ in these features and the effects of any
differences on estimates of nutritional indices. Further-more, we extended our previous nutritional index studies by separately estimating AD and ECD for the two types of flightless morphs [LW(h) and SW], as well as the flight capable LW(f). Like most earlier physiological and ecological studies of wing polymorphism, our previous studies compared nutritional indices of morphs that dif-fer in wing length (LW and SW females) without separ-ating LW individuals into their two component flight-muscle morphs (Zera and Denno, 1997). Recent physio-logical studies indicate that the failure to separate the two types of LW morphs can result in substantial errors in estimates of both fitness and energetic costs of flight-lessness (Zera et al., 1997).
2. Materials and methods
2.1. Stock descriptions, sampling protocol and rearing conditions
2.2. Extractions of macronutrients and metabolites
Protein and carbohydrate were extracted together from excretory material as follows: 25 mg of freeze-dried excreta was powdered and mixed with 1 ml of 0.1 M NaOH. Tubes were rotated at 8°C for 24 h and samples were then centrifuged at 2000 g for 5 min. The
super-natant was removed and the pellet was resuspended in 500µl 0.1 M NaOH, re-centrifuged as described above, and the supernatant was combined with the first super-natant. A background study showed that this procedure removed greater than 95% of the soluble protein and carbohydrate from the excreta. The background study also study showed that there was no degradation of pro-tein during the 24 h extraction period. However, there was some reduction in carbohydrate concentration pre-sumably due to degradation. To compensate for this loss in carbohydrate, the percent loss of glucose (1 mg/ml) after 24 h incubation in 0.1 M NaOH was determined and used to adjust carbohydrate estimates in the excreta. Total lipid was extracted using the method described in Zera et al. (1994). Twenty-five milligrams of powdered excreta were mixed for 24 h with 3 ml of chloroform/methanol (2:1 v/v), containing 0.05% butylated hydroxytoluene. The mixture was centrifuged, the supernatant was removed, and 1 ml of chloroform/methanol was added to the pellet. The pellet was resuspended, centrifuged and the supernatant was removed and combined with the first supernatant. The chloroform/methanol extracts were washed with aqueous KCl as described in Zera et al. (1994). This procedure removed .90% of lipid from the excreta.
Uric acid, hypoxanthine and xanthine were extracted from excretory products of crickets fed the 100% diet using the method of Bhattacharya and Waldbauer (1969). One milliliter 0.6% lithium carbonate was added in each of four consecutive 1-h extractions of excreta followed by a 500 µl wash. Metabolites in the excreta of crickets fed the 25% diet were obtained with three 1-h extractions and a 500 µl wash. A preliminary study showed that these procedures extracted greater than 97% of the uric acid and xanthine+hypoxanthine from the samples.
2.3. Assays of macronutrients and excretory products
Soluble protein was measured using the BCA protein assay (Stoschek, 1990) using bovine serum albumin as a standard. The same extracts used in the BCA protein assay also were used to measure soluble carbohydrate by the anthrone assay (Van Handel, 1985) using glucose as a standard. Total lipid was measured by the vanillin assay using oleic acid as the standard (Van Handel, 1985).
Uric acid was quantified using the spectrophotometric assay of Bhattacharya and Waldbauer (1969) with the
changes denoted below. In this assay, uricase converts uric acid into allantoin which is quantified by measuring the change in absorbance at 292 nm. The total assay volume was 2500 µl. 2400–2420µl of 0.1 M (pH 9.4) glycine buffer was pipetted into a cuvette, and 20 µl (0.03 units) of lyophilized uricase (Sigma Chemical Co.) in water was added. The cuvette was inverted to mix the components and 60–80 µl of lithium carbonate extract of excretion products was added to the cuvette. The cuvette was inverted twice and the absorbance at 292 nm was recorded immediately and after 25 min. Preliminary studies demonstrated that all uric acid was converted to allantoin during this time. Unknown uric acid concen-trations were estimated by comparing absorbances of samples with standard curves derived from samples of known uric acid concentration. Xanthine plus hypoxan-thine were measured in a similar manner using the assay of Bergmeyer (1974).
2.4. Feeding trials
Feeding trials were performed to quantify the amount of food absorbed and converted to biomass by morphs ofG. firmus. The trials were done on two diets to deter-mine the effects of variation in nutrient quantity on nutri-ent absorption and conversion. All experimnutri-ents were performed on unmated females since these females retain their eggs, and thus do not require access to ovi-position material. This feature, together with other characteristics of unmated females described in Zera et al. (1998), greatly simplifies the measurement of nutritional indices. Importantly, mated and unmated Gryllus females exhibit very similar patterns of ovarian growth during the first week of adulthood (G. Cisper and A.J. Zera, unpublished data). Feeding trials were con-ducted over 7 days at 28°C under a 16L:8D photoperiod essentially as described previously (Zera et al., 1998) and were performed on females of the SEL-2 line [i.e. LW(f) and LW(h) females of the block-2 line selected for the LW morph, and SW females of the block-2 line selected for the SW morph; L-2 and S-2 lines of Zera and Huang (1999)]. Briefly, on the day of adult molt (day 0), female crickets were weighed and placed in individual 16 oz. plastic cups. The crickets were fed either the standard 100% diet, or the 25% diet, in which the components of the 100% diet (excluding agar and mold inhibitor) were reduced to 25% of their original mass. The loss in mass was replaced by addition of an equivalent amount ofα-cel, non-nutritive cellulose, such that the 100% and 25% diets had the same dry mass. All juvenile crickets had been raised on the 100% diet during the last two stadia.
crickets were given a fresh piece of food. Excretory pro-ducts (feces and urine) were easily collected since they are produced together as semisolid (100% diet) or solid (25% diet) pellets whose color differed from that of the food. On day 7, uneaten food and excreted matter were again collected and the crickets were weighed. Food and excreta were freeze-dried, weighed, and kept at 280°C for later chemical analyses. The crickets were frozen for later dissection of flight muscles and ovaries. Initial (day 0) and final (day 7) dry masses of theG. firmusused in the feeding trial were estimated from their wet masses by linear regression of wet weights vs dry weights of separate groups of crickets raised under identical con-ditions. The dry mass of food consumed was estimated from the amount of wet diet consumed and standard curves of wet weight vs dry weight of diet obtained by linear regressions of each diet.
2.5. Nutritional indices
Absorption efficiency (AD, approximate digestibility), and efficiency of conversion of digested food into biomass (ECD) were calculated from the feeding trial data using standard formulae (Waldbauer, 1968; Woodr-ing et al., 1979; van Loon, 1989). All calculations were done on dry masses of food, crickets and excreta. AD was estimated as the percentage of consumed food or specific macronutrient that was retained within the cricket during the 7-day feeding trial {[(food con-sumed2material excreted)/food consumed]×100%}. ECD was the percentage of food retained by the cricket during the 7-day feeding trial that was converted into biomass {[(mass gain)/(food consumed2material excreted)]×100%}.
Three types of AD and two types of ECD were calcu-lated. First, uncorrected indices were estimated based on the dry masses of food consumed, excreta produced and mass gain of the cricket during the feeding trial. This is the standard method used to calculate AD and ECD in previous studies (Zera and Mole, 1994; Zera et al., 1998). Second, corrected AD and ECD values were cal-culated in the same manner, except that the total mass of excreted metabolites (uric acid, hypoxanthine, and xanthine) had been subtracted from the total mass of excreted material. Third, AD values for specific nutrients were calculated using the standard formula for AD given above, but using the masses of protein, carbohydrate or lipid in food and excreta.
2.6. Organ masses
Masses of ovaries and flight muscles (dorsolongitudinal and dorsoventral) were obtained as described previously (Mole and Zera, 1993; Zera et al., 1997).
2.7. Statistical analyses
Variation among morphs for excreted metabolites and corrected or uncorrected nutritional indices was analyzed by ANCOVA (Analysis of Covariance), essentially as described in Zera et al. (1998). The independent variable in the ANCOVA of a particular nutritional index was the numerator of that index, while the covariate was the denominator (Raubenheimer and Simpson, 1992; Zera et al., 1998). Similarly, the independent variable for ANCOVA of metabolite excretion was the total amount of that metabolite excreted during the 7-day feeding trial, and the covariate was the total dry mass of excreted material. Because of various covariate×diet or line inter-actions, differences among individual morphs in absorp-tion efficiency of carbohydrate, protein or lipid were ana-lyzed for each line separately on each diet (see Section 2). In addition, a significant morph×covariate interaction, observed for carbohydrate AD for one of the control lines (CON-3), precluded analysis by ANCOVA. Data from this line were analyzed by the non-parametric Kru-skal–Wallis test. A covariate×diet interaction for AD for dry mass of diet was circumvented by analyzing the data from the 100% and 25% diets separately. No covariate×diet or morph interactions were observed for the ECD data, allowing analysis of the entire data set by ANCOVA.
Following the overall ANCOVA of AD (total dry mass of food) or ECD, three planned contrasts were per-formed to identify the specific source of variation among the morphs. These involved pairwise tests of each of the three morphs [LW(f) vs SW, LW(f) vs LW(h), and LW(h) vs SW]. Since these were planned contrasts, probabilities from these tests were not corrected for mul-tiple comparisons. Finally, the amounts of excreted uric acid, hypoxanthine and xanthine were only estimated for a portion of crickets used in the feeding trials. Linear regressions of mass of excreted metabolite vs mass of excreta were undertaken so that metabolite excretion could be estimated for other crickets in these trials so that their corrected ADs and ECDs could be obtained.
3. Results
3.1. Metabolite excretion
Table 1
Mean (±SEM) percentage of nitrogenous metabolites in excreta of wing and flight-muscle morphs ofGryllus firmus
Line Morph Morph
LW(f)a LW(h) SW LW(f) LW(h) SW
100% Diet 25% Diet
Uric acid
SEL-1 3.7±0.8 (4)b 4.0±1.1 (3) 3.7±0.4 (5) 0.52±0.21 (5) 0.32±0.13 (2) 0.24±0.10 (5)
SEL-2 5.6±1.2 (4) 5.2±0.9 (4) 5.4±0.6 (5) 0.82±0.19 (5) 0.71±0.13 (5) 0.60±0.07 (4) CON-3 6.3±1.0 (5) 5.4±0.4 (4) 5.5±0.1 (5) 0.54±0.09 (5) 0.74±0.31 (4) 0.57±0.20 (5) Grand meanc 5.2±0.7 (3) 4.8±0.4 (3) 4.9±0.5 (3) 0.62±0.10 (3) 0.59±0.14 (3) 0.47±0.11 (3)
Xanthine plus hypoxanthine
SEL-1 0.96±0.14 (5) 0.84±0.12 (3) 0.85±0.06 (5) 0.38±0.07 (5) 0.33±0.03 (2) 0.27±0.06 (5) SEL-2 1.16±0.08 (6) 1.05±0.21 (3) 0.85±0.06 (5) 0.37±0.04 (5) 0.31±0.02 (4) 0.37±0.03 (5) CON-3 1.20±0.08 (5) 1.14±0.08 (3) 1.35±0.08 (5) 0.27±0.03 (5) 0.31±0.06 (4) 0.27±0.05 (5) Grand mean 1.11±0.07 (3) 1.01±0.09 (3) 1.01±0.17 (3) 0.34±0.03 (3) 0.31±0.01 (3) 0.30±0.03
aLW(f)=long wings with fully developed flight muscles; LW(h)=long wings with histolyzed flight muscles; SW=short wings with underdeveloped
flight muscles (see Section 2).
b Values are means±standard errors; sample sizes (number of crickets analyzed) are in parentheses. cMean of line means.
addition, values for individual morphs were typically very similar in control vs selected lines.
3.2. Absorption efficiency (AD) of macronutrients
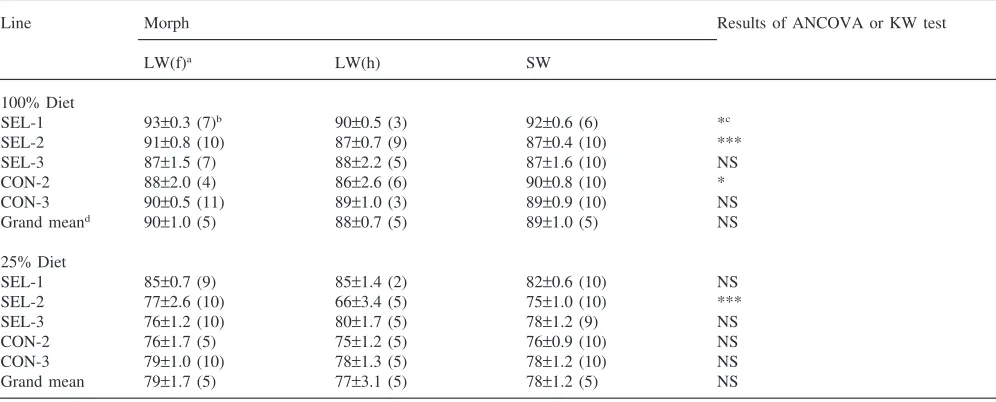
On the high diet, ADs were the highest for total soluble carbohydrate (86–93%), followed by total lipid (73–79%), and total protein (61–73%) (Tables 2– 4). The same rank order of ADs was observed on the
Table 2
Absorption efficiency (AD) of soluble carbohydrate for wing and flight muscle morphs ofGryllus firmusfed various diets
Line Morph Results of ANCOVA or KW test
LW(f)a LW(h) SW
100% Diet
SEL-1 93±0.3 (7)b 90±0.5 (3) 92±0.6 (6) *c
SEL-2 91±0.8 (10) 87±0.7 (9) 87±0.4 (10) ***
SEL-3 87±1.5 (7) 88±2.2 (5) 87±1.6 (10) NS
CON-2 88±2.0 (4) 86±2.6 (6) 90±0.8 (10) *
CON-3 90±0.5 (11) 89±1.0 (3) 89±0.9 (10) NS
Grand meand 90±1.0 (5) 88±0.7 (5) 89±1.0 (5) NS
25% Diet
SEL-1 85±0.7 (9) 85±1.4 (2) 82±0.6 (10) NS
SEL-2 77±2.6 (10) 66±3.4 (5) 75±1.0 (10) ***
SEL-3 76±1.2 (10) 80±1.7 (5) 78±1.2 (9) NS
CON-2 76±1.7 (5) 75±1.2 (5) 76±0.9 (10) NS
CON-3 79±1.0 (10) 78±1.3 (5) 78±1.2 (10) NS
Grand mean 79±1.7 (5) 77±3.1 (5) 78±1.2 (5) NS
aLW(f)=long wings with fully developed flight muscles; LW(h)=long wings with histolyzed flight muscles; SW=short wings with underdeveloped
flight muscles (see Section 2).
b Values are mean percentage±SEM; sample sizes are in parentheses; see Section 2 for calculation of AD. cNS=non-significant (P
.0.1); *P,0.05; ***P,0.005.
d Average of line means.
Table 3
Absorption efficiency (AD) of soluble protein for wing and flight muscle morphs ofGryllus firmusfed various diets
Line Morph Results of ANCOVA or KW test
LW(f)a LW(h) SW
100% Diet
SEL-1 73±2.8 (7)b 71±2.7 (3) 66±1.8 (6) NSc
SEL-2 65±2.4 (10) 66±2.4 (9) 65±1.7 (10) NS
SEL-3 65±0.4 (10) 66±3.7 (5) 61±3.5 (9) NS
CON-2 61±2.2 (4) 65±3.4 (6) 63±0.9 (10) ***
CON-3 68±1.9 (11) 69±0.6 (3) 64±2.3 (10) NS
Grand meand 66±1.9 (5) 67±1.2 (5) 64±0.8 (5) NS
25% Diet
SEL-1 45±3.5 (7) 54±3.7 (2) 49±4.2 (9) NS
SEL-2 23±3.7 (6) 27±3.1 (5) 29±3.2 (7) NS
SEL-3 43±7.5 (4) 47±5.8 (5) 40±4.0 (8) NS
CON-2 30±3.2 (5) 41±4.2 (5) 32±3.7 (10) NS
CON-3 27±3.5 (4) 33±2.7 (4) 37±3.2 (9) NS
Grand mean 34±4.3 (5) 40±4.8 (5) 37±3.6 (5) NS
aLW(f)=long wings with fully developed flight muscles; LW(h)=long wings with histolyzed flight muscles; SW=short wings with underdeveloped
flight muscles (see Section 2).
b Values are mean percentage±SEM; sample sizes are in parentheses; see Section 2 for calculation of AD. cNS=non-significant (P
.0.1); ***P,0.005.
d Average of line means.
Table 4
Absorption efficiency (AD) of total lipid for wing and flight muscle morphs ofGryllus firmusfed various diets
Line Morph Results of ANCOVA or KW test
LW(f)a LW(h)* SW
100% Diet
SEL-2 77±3.2 (7)b 75±2.2 (10) 77±2.8 (6) NSc
SEL-3 79±1.2 (10) 79±3.3 (5) 78±1.7 (10) NS
CON-2 73±3.6 (4) 75±1.9 (6) 73±2.9 (10) NS
Grand mean 76±2.1 (3) 73±1.6 (3) 76±1.9 (3) NS
25% Diet
SEL-2 63±1.5 (7) 62±4.4 (4) 62±2.3 (7) NS
SEL-3 59±2.4 (8) 55±4.9 (3) 60±2.6 (7) NS
CON-2 64±3.3 (5) 58±4.1 (3) 56±2.6 (10) NS
Grand mean 62±1.9 (3) 58±2.5 (3) 59±2.2 (3) NS
aLW(f)=long wings with fully developed flight muscles; LW(h)=long wings with histolyzed flight muscles; SW=short wings with underdeveloped
flight muscles (see Section 2).
b Values are mean percentage±SEM; sample sizes are in parentheses; see Section 2 for calculation of AD. cNS=non-significant (P
.0.1).
3.3. Uncorrected and corrected AD and ECD
Uncorrected absorption efficiencies of total dry mass of food for the three morphs from one pair of selected lines (SEL-2) fed the high or low diets, and ADs cor-rected for metabolite excretion, are given in Table 5. An overall comparison of uncorrected vs corrected ADs could not be performed for the entire data set due to various covariate×treatment interactions. Hence cor-rected vs uncorcor-rected values were compared separately for each morph on each diet. For the high diet, the cor-rected AD was significantly higher than the uncorcor-rected
AD for the LW(f) morph (P,0.025), the SW morph (P,0.025) and was nearly significantly higher for the LW(h) morph (P=0.06). While statistically significant, differences between corrected and uncorrected values were small (,5%). For the low diet, none of the cor-rected ADs differed from the corresponding AD of the same morph (P.0.25 in each ANCOVA). The absence of differences on the low diet was likely due to the low concentration of excreted metabolites (see above).
Table 5
Corrected (C) and uncorrected (U) ECD and AD values for wing and flight muscle morphs ofGryllus firmusfed either the 100% or 25% diets
Diet/C or U Index
ECD ADa
Morph Morph
LW(f)b LW(h) SW LW(f) LW(h) SW
100% C 31±1c 41±2 35±1 68±1 63±1 64±1
100% U 32±1 43±2 36±1 65±1 60±1 61±1
25% C 236±8 12±4 8±4 23±2 18±1 18±1
25% U 239±10 13±5 9±4 22±2 18±1 17±1
aAbsorption efficiency of total dry mass of diet.
b LW(f)=long wings with fully developed flight muscles; LW(h)=long wings with histolyzed flight muscles; SW=short wings with underdeveloped
flight muscles (see Section 2).
cValues are mean percentage±standard error; sample sizes ranged from 36–38, 5–10 and 21–25, for LW(f), LW(h), and SW individuals,
respectively; results of statistical analyses of these data are in Tables 6 and 7.
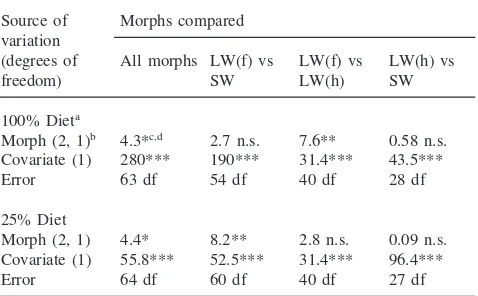
uncorrected values were essentially identical and only the results of analyses of corrected ADs will be presented here. Preliminary analyses of the ADs demon-strated a significant interaction between the covariate (total food consumed) and diet, thus precluding an over-all ANCOVA of ADs on both diets. Hence, the ADs from each diet were analyzed separately. Corrected ADs differed significantly among the morphs fed either the high or low diets (Table 6). Pairwise comparisons of the three morphs indicated that all of the significant variation in AD was due to differences between the flight-capable, LW(f) morph, and either flightless morph [LW(h) or SW]. LW(f) vs SW did not differ in AD on the high diet but differed on the low diet (Table 6). The AD of LW(f) differed from LW(h) on the high diet but not on the low
Table 6
Results of ANCOVAs of AD for wing and flight muscle morphs fed either a high nutrient (100%) or low nutrient (25%) diet
Source of Morphs compared variation
(degrees of All morphs LW(f) vs LW(f) vs LW(h) vs
freedom) SW LW(h) SW
100% Dieta
Morph (2, 1)b 4.3*c,d 2.7 n.s. 7.6** 0.58 n.s.
Covariate (1) 280*** 190*** 31.4*** 43.5***
Error 63 df 54 df 40 df 28 df
25% Diet
Morph (2, 1) 4.4* 8.2** 2.8 n.s. 0.09 n.s. Covariate (1) 55.8*** 52.5*** 31.4*** 96.4***
Error 64 df 60 df 40 df 27 df
aBecause of significant Diet×Covariate interactions, ADs were
ana-lyzed separately on each diet by ANCOVA.
b Two df for tests of all (three) morphs, and one df for tests of
two morphs.
cValues are F-ratios except for the Error term where values are
degrees of freedom.
d ***P
,0.005, **P,0.01, *P,0.05; n.s.=non-significant.
diet (Table 6). Finally, LW(h) vs SW did not differ in AD on either diet (Table 4). The difference in AD between morphs was magnified on the low (25% difference) relative to the high diet (,10% difference) (Table 5).
Corrected and uncorrected ECDs differed on average by,7% (Table 5). In no case did corrected and uncor-rected values differ significantly for a particular morph fed a particular diet. As was the case for AD, results of statistical analyses of ECD were identical for uncor-rected or coruncor-rected values. Hence, only the results of analyses of corrected ECDs are presented. Preliminary analysis of ECDs showed no significant interactions between covariate and treatment. Therefore an overall ANCOVA (all three morphs and both diets) was perfor-med. Significant effects due to both diet and morph were observed (Table 7), and no significant interaction was observed between these two factors (Table 7). Signifi-cant variation was due to an elevated ECD (1) in all morphs fed the high vs low diet and (2) in the flightless SW and LW(h) morphs vs the flight-capable LW(f) morph (Tables 5 and 7).
Table 7
Results of ANCOVAs of ECD for wing and flight muscle morphs fed either a high-nutrient (100%) or low-nutrient (25%) die
Source of Morphs compared variation
(degrees of All LW(f) vs LW(f) vs LW(h) vs
freedom) MORPHS SW LW(h) SW
Morph (2, 1)a 26.7***b,c 32.7*** 30.9*** 6.5***
Diet (1) 26.4*** 33.6*** 29.2*** 1.6 n.s. M×D (2, 1) 2.7 n.s. 4.1* 0.0 n.s. 2.9 n.s. Covariate (1) 53.6*** 30.4*** 32.9*** 49.3*** Error 131 df 115 df 86 df 58 df
LW(f) vs SWd
100% diet 25% diet Morph (1) 4.4* 36.0*** Covariate (1) 25.6*** 14.3***
Error 54 df 60 df
aTwo df for tests of all (three) morphs and one df for comparisons
between pairs of morphs.
b Values are F-ratios except for the Error term, where values are
degrees of freedom.
c****P
,0.005, *P,0.05, n.s.=non-significant (P.0.1).
d Because of the significant M×D interaction, ECDs were also
ana-lyzed separately for each diet.
likely due to the small sample size of LW(h) individuals in this study (see footnote of Table 5). Finally, ECDs also differed significantly between LW(h) and SW morphs (Table 5). However, ECDs were much more similar between these two flightless morphs than between either of these morphs and LW(f) when aver-aged over both diets [least-squared means(±SEM) over both diets: LW(h)=0.27±0.04, SW=0.22±0.02, LW(f)=20.03±0.04] or on the low diet (Table 5 and Table 7). On the high diet, ECD for the SW morph was intermediate between the ECDs of the LW(f) and LW(h) morphs.
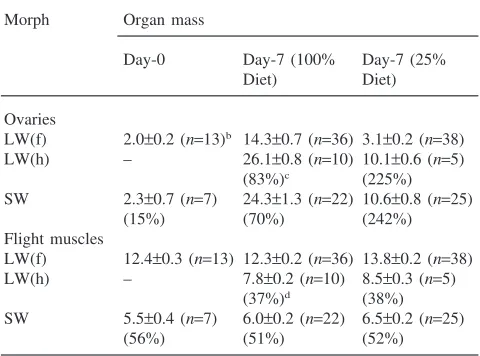
Mass of flight muscles and ovaries for the various morphs fed the 100% or 25% diets are given in Table 8. Ovaries were small and similar in the morphs at adult emergence. However, ovaries were substantially greater in either flightless morph compared with the flight cap-able LW(f) morph by the end of the experiment (day 7). Moreover, the degree of elevation in ovarian growth in the flightless morph [either SW or LW(h)], relative to the flight-capable LW(f) morph, was magnified three-fold on the low nutrient (242–225%) compared with the high nutrient (70–83%) diet. Flight muscles were reduced in the flightless morph by 37–56%. Flight mus-cle reduction was similar at all ages and on all diets.
4. Discussion
4.1. Expression of morph-specific traits
The degree of flight muscle reduction and enlargement of ovaries in flightless relative to flight-capable G.
Table 8
Ovarian and flight muscle mass (as % whole-body wet mass) for wing and flight-muscle morphs ofGryllus firmusfed the 100% or 25% dietsa
Morph Organ mass
Day-0 Day-7 (100% Day-7 (25%
Diet) Diet)
Ovaries
LW(f) 2.0±0.2 (n=13)b 14.3±0.7 (n=36) 3.1±0.2 (n=38)
LW(h) – 26.1±0.8 (n=10) 10.1±0.6 (n=5) (83%)c (225%)
SW 2.3±0.7 (n=7) 24.3±1.3 (n=22) 10.6±0.8 (n=25)
(15%) (70%) (242%)
Flight muscles
LW(f) 12.4±0.3 (n=13) 12.3±0.2 (n=36) 13.8±0.2 (n=38) LW(h) – 7.8±0.2 (n=10) 8.5±0.3 (n=5)
(37%)d (38%)
SW 5.5±0.4 (n=7) 6.0±0.2 (n=22) 6.5±0.2 (n=25)
(56%) (51%) (52%)
a Crickets were fed either the 100% or 25% diet starting on day 0
of adulthood. Prior to this time all crickets had been fed the 100% diet.
b Mean (±SEM) percent ovarian or flight-muscle mass (n=sample
size).
c Percentincreasein ovarian mass relative to LW(f). d Percentdecreasein flight-muscle mass relative to LW(f).
firmus, observed in the present study (Table 8), is similar to data reported in previous studies of naturally-occur-ring or hormonally-induced dispersal polymorphism (Tanaka, 1993; Mole and Zera, 1993; Zera et al. 1997, 1998; Zera and Denno, 1997). These results indicate that nutrient absorption and utilization were measured under experimental conditions in which the typical trade-off between flight capability and early reproduction is seen.
4.2. Efficiency of absorption of macronutrients by morphs
Nutrient absorption (AD) by wing and flight muscle morphs of G. firmus is relevant to two key trade-off issues. The first concerns the physiological processes responsible for functionally-important variation in chemical constituents between adult morphs. For example, the flight-capable morph of twoGryllusspecies has higher triglyceride/total lipid content than the flight-less morph (Zera et al. 1994, 1998), which appears to be an important adaptation for flight (Zera et al., 1999). However, the physiological processes responsible for these lipid differences are unknown. The key issue is whether variation among morphs arises from differential absorption of lipid from the diet (no trade-off), or from differential allocation of assimilated nutrients to lipid biosynthesis or catabolism (trade-off).
in chemical composition between wing morphs, described above, appears to result from variation in some process other than absorption of specific macronutrients per unit mass of food consumed by adults. We are cur-rently investigating the potential role of differential lipid and carbohydrate biosynthesis or catabolism in produc-ing morph-specific differences in the concentration of these macromolecules. Carbohydrate and protein ADs for G. firmus fed the 100% diet were similar to values for two other orthopterans: adult female Acheta dom-esticusfed an artificial diet (Woodring et al., 1979) and last stadium Locusta migratoria fed wheat seedlings (Simpson, 1982). Total lipid ADs forG. firmusalso were similar to values for adult femaleA. domesticusand were higher than values for juvenileL. migratoria(Woodring et al., 1979; Simpson, 1982).
Data on morph-specific absorption of specific mac-ronutrients are also important in assessing the signifi-cance of variation in AD among morphs for total dry mass of food. Previous studies have shown that wing or flight muscle morphs absorb an equivalent proportion of consumed food (G. rubens, Mole and Zera, 1993; G. assimilis, Zera et al., 1998), or that the long-winged morph absorbs a slightly (14%) greater proportion of dry mass of consumed food (G. firmus; Zera and Mole, 1994; present study). On the other hand, conversion of assimilated nutrients to biomass (ECD) was elevated by 45–100% in the flightless vs flight-capable or LW morph in each of these species [LW(f) and LW(h) morphs were not distinguished in previous studies of G. rubens and G. firmus]. Hence, increased nutrient conversion was viewed as being more important than increased nutrient absorption in providing additional nutrients for enhanced egg production of flightless females. This argument is based on the assumption that adult morphs do not differ-entially absorb nutrients from the diet and hence the rela-tive amount of dry food absorbed is a measure of the relative amount of calories absorbed by each morph. Results of the present study support this assumption. Despite the voluminous literature on insect nutritional ecology (Waldbauer, 1968; Slansky and Scriber, 1985; van Loon, 1989; Bernays, 1989; Woodring et al., 1979; Simpson, 1982; Simpson and Simpson, 1989), the present and earlier studies of Gryllus morphs represent the first studies of polymorphic and genetic variation for nutritional indices.
4.3. Metabolite excretion and nutritional indices
Studies of metabolism and energetics of organisms such as insects (and birds) are complicated by the excretion of feces and urine together. Measurement of absorption efficiency requires that the mass of end pro-ducts of metabolism be distinguished from unabsorbed food in the combined feces and urine (Waldbauer, 1968; Slansky and Scriber, 1985; van Loon, 1989). The present
study focused on the excretion of uric acid, hypoxan-thine and xanhypoxan-thine by morphs of G. firmus. Uric acid is the end product of nitrogen metabolism that is most commonly excreted by insects as a group and by the cricket, A. domesticus (Bursell, 1967; Cochran, 1985). Recent studies also have shown that xanthine and hypox-anthine can account for a significant amount of total purine excreted by some species (Bursell, 1967; Bhatta-charya and Waldbauer, 1972; Cockran, 1985). Percent-ages of uric acid, hypoxanthine and xanthine in dry mass of excreta ofG. firmusfed the 100% or 25% diets (Table 1) were roughly similar to values for other insects fed artificial diets (Waldbauer, 1968; Bhattacharya and Waldbauer, 1972; Woodring et al., 1979).
End products of nitrogen metabolism comprised only a small proportion of the dry mass of excreta (,8% for the 100% diet and,2% for the 25% diet). The concen-tration of these end products did not differ between morphs, had only a minor effect on the absolute values of AD or ECD for a particular morph, and had no sig-nificant influence on the pattern of variation among morphs for these indices (Table 5; Section 3). Thus, con-clusions drawn from previous comparisons of nutritional indices among morphs (Zera and Denno, 1997; Zera et al., 1998) were likely unaffected by the fact that indices were not corrected for excretion of nitrogenous metab-olites.
4.4. Morph-specific variation in nutrient absorption and utilization
of threeGryllusspecies (Mole and Zera, 1993; Zera and Denno, 1997; Zera et al., 1998) indicates that a greater proportion of assimilated nutrients are allocated to biomass gain vs respiration in the flightless morph of each of these species. A large proportion of biomass gain (.75%) in adult Gryllus species and in the phylogen-etically related A. domesticus is due to ovarian growth (Woodring et al., 1979; Zera et al., 1998; A. Zera, unpublished data). Thus elevated ECD in the flightless morph, to a large extent, reflects the increased allocation of nutrients to ovarian growth vs whole organism respir-ation (Zera and Denno, 1997; Zera et al., 1998). That is, ovarian growth trades-off with whole-organism respir-ation.
Previous estimates of ECD, AD and other nutritional indices (e.g. consumption and growth) in naturally-occurring wing morphs (Mole and Zera 1993, 1994) had several limitations. First, since only a single diet (100% diet) was used in these studies, the extent to which observed nutritional index variation between morphs was dependent upon that diet was unknown. In addition, LW morphs with functional vs histolyzed flight muscles [LW(f) vs LW(h)] were not distinguished. This poten-tially masked physiological differences between flight-less and flight-capable individuals because the LW “flight-capable” group was a mixture of individuals some of which were flightless.
In the present study, nutritional indices were estimated for each of three wing- and flight-muscle morphs that were raised on diets of high or low nutrient quantities. An important finding was that ECD was significantly elevated in each type of flightless morph [LW(h) or SW] relative to the long-winged, flight-capable morph [LW(f)] over all diets, and on each diet considered separ-ately (Section 3, Tables 5 and 7). Similarly, AD was moderately reduced in each flightless morph, relative to the flight-capable morph, on either the 25% or 100% diet (Table 5). These results corroborate our previous find-ings on morph-specific variation in nutritional indices in G. firmusdiscussed above. Results also show that flight-less morphs that are produced by modification of differ-ent developmdiffer-ental pathways (blockage of muscle devel-opment vs histolysis of developed muscles) during different times of the life cycle (juveniles vs adults), in general, assimilate and convert nutrients in a similar manner. These results strengthen our previous con-clusions that physiological and reproductive features are more similar between flight muscle morphs that differ in wing length [LW(h) and SW] than between wing length morphs that differ in flight muscles [LW(f) and LW(h)] (Zera et al., 1997, 1999).
Another important finding of the present study was that ECD was elevated in flightless vs flight-capable morphs to a much greater degree on the low nutrient (25%) compared with the high nutrient (100%) diet (Tables 5 and 7). Moreover, ECD was negative for the
LW(f) morph on the 25% diet (Table 5), indicating that nutrient intake was not sufficient to meet the energetic requirements of maintenance metabolism and activity. Thus the LW(f) morph used body reserves to fuel respir-ation and lost weight on the 25% diet during the experi-ment. A similar magnification of ECD between (a hor-monally-induced) flightless and flight-capable morphs was observed on a low nutrient diet in the congener,G. assimilis (Zera et al., 1998). In both the study of Zera et al. (1998) and the present study, the greater magnifi-cation of ECD between morphs on the low nutrient diet was associated with a greater magnification of ovarian growth (Table 8). These studies clearly show that trade-offs of internal resources and resulting fecundity vari-ation can be strongly affected by nutrient availability.
The validity of our conclusions on trade-offs in G. firmus and other Gryllus species is contingent upon the reliability of nutritional indices as indicators of nutrient allocation to respiration. Recently, Tanaka and Suzuki (1998, p. 128) have questioned the use of nutritional indices for this purpose, claiming that these indices only provide an indirect measure of respiration and are inferior to direct measures of oxygen (O2) consumption. This claim is based on a misunderstanding of the bioenergetic definition of respiration, and the relation-ship between O2 consumption and respiration. In bioenergetics, respiration is defined as the amount of cal-ories devoted to metabolism that is lost from the organ-ism (i.e. respiratory metabolorgan-ism), and is not the quantity of O2consumed or CO2expired (Withers, 1992, pp. 83– 88). Both respirometry (e.g. quantifying O2 consumption) and nutritional indices are indirect meas-ures of respiration. Estimation of respiratory metabolism from the energy contents or masses of food consumed and material excreted is considered preferable by many to estimates based on respirometry, and the estimation of respiration from dry mass or caloric content of food assimilation is a standard practice in energetics (Muthukrishnan and Pandain, 1987; Wrightman, 1981). Ironically, closed-vessel respirometry, the method used by Tanka and co-workers (e.g. Tanaka and Okuda, 1996), is especially prone to experimental artifacts (“flask effects”; Wightman, 1981; McEvoy, 1985; Muthukrishnan and Pandain, 1987), which is why we did not use this method. We emphasize that we have thus far quantified the trade-off between respiration and ovarian growth in terms of dry mass of assimilated food. We are currently estimating energy budgets for each morph to quantify the trade-off in units of energy. Our preliminary results indicate that the pattern of trade-offs between the morphs is very similar whether determined gravimetrically (Table 5) or in units of energy.
4.5. The importance of absorption efficiency (AD) in trade-off studies
(Muthukrishnan and Pandian, 1987; Withers, 1992). By contrast, the importance of this measure in life history trade-off studies has been much less appreciated, and this index often has not been quantified. However, phenotypic differences in the allocation of internal nutri-ents to various organismal features (i.e. a nutrient-based trade-off) can only be rigorously documented if the quantity of absorbed nutrients is quantified for the phenotypes whose allocation patterns are being com-pared (Mole and Zera, 1993; Zera and Denno, 1997). Thus, claims of internal trade-offs in studies where absorption efficiency has not been estimated (e.g. Djaw-dan et al., 1996; some experiments in Tanaka, 1993) should be viewed with caution. As an alternate approach, Tanka and co-workers (Tanaka, 1993; Tanaka and Suzuki, 1998) have attempted to eliminate nutrient assimilation from consideration by conducting trade-off studies on starved insects. However, this approach limits trade-off studies to a single highly restrictive condition: total starvation. By contrast, a nutritional index approach allows nutrient allocation to be scaled to amount of food absorbed. Hence trade-offs of internal resources can be quantified under any degree of nutrient intake. This allows trade-offs to be quantified under a range of nutri-ent conditions that might be encountered by the organ-ism in the field. Moreover, this approach allows the investigator to quantify the relative importance of con-sumption, assimilation and allocation to some organ-ismal feature (e.g. increased ovarian growth in the flightless morph). Alteration of nutrient intake is an exceedingly important adaptation of insects for dealing with variation in nutrient quantity and quality (Simpson and Simpson, 1989; Zanotto et al., 1993). Variation in nutrient intake can strongly influence the magnitude of internal trade-offs (Tables 5 and 8; Zera and Denno, 1997; Zera et al., 1998). Thus, any comprehensive study of a trade-off should investigate how variation in absorp-tion or consumpabsorp-tion influences allocaabsorp-tion. While nutritional indices certainly do not provide all the neces-sary information on internal trade-offs (Mole and Zera, 1993), they are indispensable tools in such studies.
Acknowledgements
This study was supported by grants IBN 9507388 and IBN 9808249 from the National Science Foundation to AJZ. T. Brink was supported by funds from a Howard Hughes Grant to the School of Biological Sciences, Uni-versity of Nebraska and by a Research Experience for Undergraduates (REU) supplement to the NSF grant IBN-9507388. Data reported in this study are from an Honors Thesis submitted by T. Brink to the University of Nebraska as partial fulfillment for a Bachelor of Science Degree with Highest Distinction. We thank T. Rooneem for help in the chemical analyses.
References
Bergmeyer, H.L., 1974. Methods of Enzymatic Analysis, vol. 1. Aca-demic Press, New York.
Bernays, E.A. (Ed.), 1989. Insect–Plant Interactions, vol. II. CRC Press, Boca Raton, FL.
Bhattacharya, A.K., Waldbauer, G.P., 1969. Quantitative determination of uric acid in insect feces by lithium carbonate extraction and the enzymatic spectrophotometric method. Annals of the Entomologi-cal Society of America 62, 925–927.
Bhattacharya, A.K., Waldbauer, G.P., 1972. The effect of diet on the nitrogenous end products excreted by larvalTribolium confusum: with notes on correction of A.D. and E.C.D. for fecal urine. Entom-ologia Experimentalis et Applicata 15, 238–247.
Bursell, E., 1967. The excretion of nitrogen in insects. Advances in Insect Physiology 4, 33–67.
Cochran, D.G., 1985. Nitrogenous excretion. In: Kerkut, G.A., Gilbert, L.I. (Eds.), Comprehensive Insect Biochemistry, Physiology and Pharmacology, vol. 4. Pergamon Press, Oxford, pp. 467–506. Dingle, H., 1996. Migration: the Biology of Life on the Move. Oxford
University Press, Oxford.
Djawdan, M., Sugiyama, T.T., Schlaeger, L.K., Bradley, T.J., Rose, M.R., 1996. Metabolic aspects of the trade-off between fecundity an longevity inDrosophila melanogaster. Physiological Zoology 69, 1176–1195.
Hardie, J., Lees, A.D., 1985. Endocrine control of polymorphism and polyphenism. In: Kerkut, G.A., Gilbert, L.I. (Eds.), Comprehensive Insect Biochemistry, Physiology and Pharmacology, vol. 8. Perga-mon Press, Oxford, pp. 441–490.
Harrison, R.G., 1980. Dispersal polymorphisms in insects. Annual Review of Ecology and Systematics 11, 95–118.
McEvoy, P.B., 1985. Balancing insect energy budgets. Oecologia 66, 154–156.
Mole, S., Zera, A.J., 1993. Differential allocation of resources under-lies the dispersal-reproduction trade-off in the wing-dimorphic cricketGryllus rubens. Oecologia 93, 121–127.
Mole, S., Zera, A.J., 1994. Differential resource consumption obviates a potential flight-fecundity trade-off in the sand cricket (Gryllus firmus). Functional Ecology 8, 573–580.
Muthukrishnan, J., Pandian, T.J., 1987. Insecta. In: Pandian, T.J., Vernberg, F.J. (Eds.), Animal Energetics, vol. 1. Academic Press, San Diego, CA, pp. 373–511.
Nijhout, H.F., 1999. Control mechanisms of polyphenic development in insects. Bioscience 49, 181–192.
Raubenheimer, D., Simpson, S.J., 1992. Analysis of covariance: an alternate to nutritional indices. Entomologia Experimentalis et Applicata 62, 221–231.
Roff, D.A., 1986. The evolution of wing dimorphism in insects. Evol-ution 40, 1009–1020.
Simpson, S.J., 1982. Changes in the efficiency of utilization of food throughout the fifth-instar nymphs ofLocusta migratoria. Entomol-ogia Experimentalis et Applicata 31, 265–275.
Simpson, S.J., Simpson, C.L., 1989. The mechanisms of nutritional compensation by phytophagous insects. In: Bernays, E.A. (Ed.), Insect–Plant Interactions, vol. II. CRC Press, Boca Raton, FL, pp. 111–160.
Slansky, F.J., Scriber, J.M., 1985. Food consumption and utilization. In: Kerkut, G.A., Gilbert, L.I. (Eds.), Comprehensive Insect Bio-chemistry, Physiology and Pharmacology, vol. 4. Pergamon Press, Oxford, pp. 87–163.
Stoschek, C.M., 1990. Quantitation of protein. Methods in Enzy-mology 182, 50–68.
Tanaka, S., 1993. Allocation of resources to egg production and flight muscle development in a wing dimorphic cricket Modicogryllus confirmatus. Journal of Insect Physiology 39, 493–498.
matu-ration, fat content and respiration rate in adultLocusta migratoria. Japanese Journal of Entomology 64, 420–428.
Tanaka, S., Suzuki, Y., 1998. Physiological trade-off between repro-duction, flight capability and longevity in a wing-dimorphic cricket
Modicogryllus confirmatus. Journal of Insect Physiology 44, 121–129.
Van Handel, E., 1985. Rapid determination of glycogen and sugars in mosquitoes. Journal of the American Mosquito Control Association 1, 299–301.
van Loon, J.J.A., 1989. Measuring food utilization in plant-feeding insects—toward a metabolic dynamic approach. In: Bernays, E.A. (Ed.), Insect–Plant Interactions, vol. 3. CRC Press, Boca Raton, FL, pp. 79–124.
Veazy, J.N., Kay, C.A.R., Walker, T.J., Whitcomb, W.H., 1976. Sea-sonal abundance, sex ratio, and macroptery of field crickets in northern Florida. Annals of the Entomological Society of America 69, 374–380.
Waldbauer, G.P., 1968. The consumption and utilization of food by insects. Advances in Insect Physiology 5, 229–288.
Wightman, J.A., 1981. Why insect energy budgets do not balance. Oecologia 50, 166–169.
Withers, P.C., 1992. Comparative Animal Physiology. Saunders Col-lege, Forth Worth, TX.
Woodring, J.P., Clifford, C.W., Beckman, B.R., 1979. Food utilization and metabolic efficiency in larval and adult house crickets. Journal of Insect Physiology 25, 903–912.
Zanotto, E.P., Simpson, S.J., Raubenheimer, D., 1993. The regulation
of growth by locusts through post-ingestive compensation for vari-ation in the levels of dietary protein and carbohydrate. Physiologi-cal Entomology 18, 425–434.
Zera, A.J., Denno, R.F., 1997. Physiology and ecology of dispersal polymorphism in insects. Annual Review of Entomology 42, 207–231.
Zera, A.J., Huang, Y., 1999. Evolutionary endocrinology of juvenile hormone esterase: functional relationship with wing polymorphism in the cricketGryllus firmus. Evolution 53, 837–847.
Zera, A.J., Mole, S., 1994. The physiological costs of flight capability in wing-dimorphic crickets. Researches on Population Ecology (Kyoto) 36, 151–156.
Zera, A.J., Mole, S., Rokke, K., 1994. Lipid, carbohydrate and nitrogen content of long- and short-wingedGryllus firmus: implications for the physiological cost of flight capability. Journal of Insect Physi-ology 40, 1037–1044.
Zera, A.J., Sall, J., Grudzinski, K., 1997. Flight-muscle polymorphism in the cricketGryllus firmus: muscle characteristics and their influ-ence on the evolution of flightlessness. Physiological Zoology 70, 519–529.