Comparative Analysis of K-Means and Fuzzy
C-Means Algorithms
Soumi Ghosh
Department of Computer Science and Engineering, Amity University, Uttar Pradesh
Noida, India
Sanjay Kumar Dubey
Department of Computer Science and Engineering, Amity University, Uttar Pradesh
Noida, India
Abstract—In the arena of software, data mining technology has been considered as useful means for identifying patterns and trends of large volume of data. This approach is basically used to extract the unknown pattern from the large set of data for business as well as real time applications. It is a computational intelligence discipline which has emerged as a valuable tool for data analysis, new knowledge discovery and autonomous decision making. The raw, unlabeled data from the large volume of dataset can be classified initially in an unsupervised fashion by using cluster analysis i.e. clustering the assignment of a set of observations into clusters so that observations in the same cluster may be in some sense be treated as similar. The outcome of the clustering process and efficiency of its domain application are generally determined through algorithms. There are various algorithms which are used to solve this problem. In this research work two important clustering algorithms namely centroid based K-Means and representative object based FCM (Fuzzy C-Means) clustering algorithms are compared. These algorithms are applied and performance is evaluated on the basis of the efficiency of clustering output. The numbers of data points as well as the number of clusters are the factors upon which the behaviour patterns of both the algorithms are analyzed. FCM produces close results to K-Means clustering but it still requires more computation time than K-Means clustering.
Keywords—clustering; k-means; fuzzy c-means; time complexity
I. INTRODUCTION
In the field of software data analysis is considered as a very useful and important tool as the task of processing large volume of data is rather tough and it has accelerated the interest of application of such analysis. To be precise data mining is the analysis of datasets that are observational, aiming at finding out unsuspected relationships among datasets and summarizing the data in such a noble fashion that are both understandable and useful to the data users [9].
It also makes data description possible by means of clustering visualization, association and sequential analysis. Data clustering is primarily a method of data description which is used as a common technique for data analysis in various fields like machine learning, data mining, pattern recognization, image analysis and bio-informatics. Cluster analysis is also recognised as an important technique for classifying data, finding clusters of a dataset based on similarities in the same cluster and dissimilarities between different clusters [13]. Putting each point of the dataset to
exactly one cluster is the basic of the conventional clustering method where as clustering algorithm actually partitions unlabeled set of data into different groups according to the similarity. As compare to data classification, data clustering is considered as an unsupervised learning process which does not require any labelled dataset as training data and the performance of data clustering algorithm is generally considered as much poorer. Although data classification is better performance oriented but it requires a labelled dataset as training data and practically classification of labelled data is generally very difficult as well as expensive. As such there are many algorithms that are proposed to improve the clustering performance. Clustering is basically considered as classification of similar objects or in other words, it is precisely partitioning of datasets into clusters so that data in each cluster shares some common trait. The hierarchical, partitioning and mixture model methods are the three major types of clustering processes that are applied for organising data. The choice of application of a particular method generally depends on the type of output desired, the known performance of the method with particular type of data, available hardware and software facilities and size of the dataset [13].
In this research paper, K-Means and Fuzzy C-Means clustering algorithms are analyzed based on their clustering efficiency.
II. K-MEANS CLUSTERING
K-Means or Hard C-Means clustering is basically a partitioning method applied to analyze data and treats observations of the data as objects based on locations and distance between various input data points. Partitioning the objects into mutually exclusive clusters (K) is done by it in such a fashion that objects within each cluster remain as close as possible to each other but as far as possible from objects in other clusters.
co-ordinates are obtained by means of computing the average of each of the co-ordinates of the points of samples assigned to the clusters.
Algorithmic steps for K-Means clustering [12]
1) Set K – To choose a number of desired clusters, K. 2) Initialization – To choose k starting points which are used as initial estimates of the cluster centroids. They are taken as the initial starting values.
3) Classification – To examine each point in the dataset and assign it to the cluster whose centroid is nearest to it.
4) Centroid calculation – When each point in the data set is assigned to a cluster, it is needed to recalculate the new k centroids.
5) Convergence criteria – The steps of (iii) and (iv) require to be repeated until no point changes its cluster assignment or until the centroids no longer move.
The actual data samples are to be collected before the application of the clustering algorithm. Priority has to be given to the features that describe each data sample in the database [3, 10]. The values of these features make up a feature vector (Fi1, Fi2, Fi3,……….., Fim) where Fim is the value of the M- dimensional space [12]. As in the other clustering algorithms, k- means requires that a distance metric between points is to be defined. This distance metric is used in the above mentioned step (iii) of the algorithm. A common distance metric is the Euclidean distance. In case, the different features used in the feature vector have different relative values and ranges then the distance computation may be distorted and so may be scaled.
The input parameters of the clustering algorithm are the number of clusters that are to be found along with the initial starting point values. When the initial starting values are given, the distance from each sample data point to each initial starting value is found using equation. Then each data point is placed in the cluster associated with the nearest starting point. After all the data points are assigned to a cluster, the new cluster centroids are calculated. For each factor in each cluster, the new centroid value is then calculated. The new centroids are then considered as the new initial starting values and steps (iii) and (iv) of the algorithm are repeated. This process continues until no more data point changes or until the centroids no longer move.
III. FUZZY C-MEANS CLUSTERING
Bezdek [5] introduced Fuzzy C-Means clustering method in 1981, extend from Hard C-Mean clustering method. FCM is an unsupervised clustering algorithm that is applied to wide range of problems connected with feature analysis, clustering and classifier design. FCM is widely applied in agricultural engineering, astronomy, chemistry, geology, image analysis, medical diagnosis, shape analysis and target recognition [16].
With the development of the fuzzy theory, the FCM clustering algorithm which is actually based on Ruspini Fuzzy clustering theory was proposed in 1980’s. This algorithm is used for analysis based on distance between various input data points. The clusters are formed according to the distance between data points and the cluster centers are formed for each cluster.
Infact, FCM is a data clustering technique [11, 7] in which a data set is grouped into n clusters with every data point in the dataset related to every cluster and it will have a high degree of belonging (connection) to that cluster and another data point that lies far away from the center of a cluster which will have a low degree of belonging to that cluster.
Algorithmic steps for Fuzzy C-Means clustering [13]
We are to fix c where c is (2<=c<n) and then select a value for parameter ‘m’ and there after initialize the partition matrix U(0). Each step in this algorithm will be labelled as ‘r’ where r =
2) Calculate the distance matrix D[c,n].
2 also the membership grades for data point [13].
FCM iteratively moves the cluster centers to the right location within a dataset. To be specific introducing the fuzzy logic in K-Means clustering algorithm is the Fuzzy C-Means algorithm in general. Infact, FCM clustering techniques are based on fuzzy behaviour and they provide a technique which is natural for producing a clustering where membership weights have a natural interpretation but not probabilistic at all. This algorithm is basically similar in structure to K-Means algorithm and it also behaves in a similar fashion.
IV. IMPLEMENTATION METHODOLOGY
A. Implementation of K-Means Clustering
The matlab function kmeans used for K-Means clustering to partitions the points in the n-by-p data matrix data into k clusters [8]. This iterative partitioning minimises the overall sum of clusters, within cluster sums of point- to cluster centroid distances. Rows of data correspond to points, columns correspond to variables and kmeans return an n-by-1 vector idx containing the cluster indices of each point. By default, k-means uses squared Euclidean distances. When data is a vector, k-means treats it as an n-by-1 data matrix, regardless of its orientation.The iris dataset for three clusters, five ‘replicates’ have been specified and the ‘display’ parameters are used to print out the final sum of distances for each of the solutions. The sum total of distances covering 13 iterations that have taken into considerations in this paper comes to 7897.88. The total elapsed time is 0.443755 seconds. Following scattered K-Means graph for iris data set (sepal length, sepal width and petal length) represents three clusters.
Fig.1. Scattered K-Means graph of iris dataset for three clusters
B. Implementation of Fuzzy C-MeansClustering
The mat lab function fcm performs FCM clustering [8]. The function fcm takes a data set and a desired number of clusters and returns optimal cluster centers and membership grades for each data point. It starts with an initial guess for the cluster centers, which are intended to mark the mean location of each cluster. The initial guess for these cluster centers is most likely incorrect. Next, fcm assigns every data point a membership grade for each cluster.
By iteratively updating the cluster centers and the membership grades for each data point, fcm iteratively moves the cluster centers to the right location within a data set. This iteration is based on minimizing an objective function that represents the distance from any given data point to a cluster center weighted by that data point's membership grade. The dataset is obtained from the data file 'iris.dat'[1]. From each of the three groups (setosa, versicolor and virginica), two characteristics (for example, sepal length vs. sepal width) of the flowers are plotted in a 2-dimensional plot.
Fig.2. Scattered Fuzzy C-Means graph of iris dataset for three clusters
FCM clustering is an iterative process. The process stops when the maximum number of iterations is reached, or when the objective function improvement between two consecutive iterations is less than the minimum amount of improvement specified. For iris dataset comprising of 30 total iteration count results a total objective function equals to 6058.689983. The total elapsed time is 0.781679 seconds. The figure shows the initial and final fuzzy cluster centers. The bold numbers represent the final fuzzy cluster centers obtained by updating them iteratively.
Fig.3. Scattered Fuzzy C-Means graph with initial and final fuzzy cluster centers
V. EXPERIMENTAL RESULTS
safely stated that K-Means clustering algorithm less time consuming than FCM algorithm and hence superior.
A. Comparison of Time Complexity of K-Means and FCM
The time complexity of K-means [15] is O(ncdi) and time complexity of FCM [4] is O(ndc2i). Keeping the number of data points constant we may assume that n = 100, d = 3, i = 20 and varying number of clusters where n = number of data points, c = number of cluster, d = number of dimension and i = number of iterations. The following table and graph represents the comparison in details.
TABLE I. COMPARATIVE ANALYSIS OF K-MEANS AND FCM
Algorithm Time Complexity Elapsed Time (Seconds)
K-Means O(ncdi) 0.443755
FCM O(ndc2i) 0.781679
TABLE II. TIME COMPLEXITY OF K-MEANS AND FCM WHEN NUMBER OF CLUSTERS VARYING
Fig.4. Time complexity of K-Means and FCM by varying number of clusters
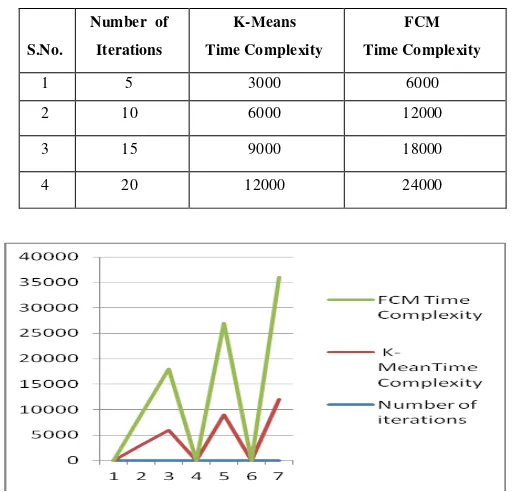
Now keeping no. of cluster constant, lets assume n=150, d=2, c=2 and varying no. of iteration, we obtain the following table and graph.
TABLE III. TIME COMPLEXITY OF K-MEANS AND FCM WHEN NUMBER OF ITERATIONS VARYING
Fig.5. Time complexity of K-Means and FCM by varying number of iterations
VI. CONCLUSION
K-Means partitioning based clustering algorithm required to define the number of final cluster (k) beforehand. Such algorithms are also having problems like susceptibility to local optima, sensitivity to outliers, memory space and unknown number of iteration steps that are required to cluster. The time complexity of the K-Means algorithm is O(ncdi) and the time complexity of FCM algorithm is O(ndc2i). From the obtained results we may conclude that K-Means algorithm is better than FCM algorithm. FCM produces close results to K-Means clustering but it still requires more computation time than K-Means because of the fuzzy measures calculations involvement in the algorithm. Infact, FCM clustering which constitute the oldest component of software computing, are really suitable for handling the issues related to understand ability of patterns, incomplete/noisy data, mixed media information, human interaction and it can provide approximate solutions faster. They have been mainly used for discovering association rules and functional dependencies as well as image retrieval. So, overall conclusion is that K-Means algorithm seems to be superior than Fuzzy C-Means algorithm.
REFERENCES
[1] A. Asuncion and D. J. Newman, UCI Machine Learning Repository Irvine, CA: University of California, School of Information and Computer Science, 2013.
[2] A. K. Jain, M. N. Murty and P. J. Flynn, “Data Clustering: A review”, ACM Computing Surveys, vol. 31, no. 3, 1999.
[3] A. Rakhlin and A. Caponnetto, “Stability of K-Means clustering”, Advances in Neural Information Processing Systems, MIT Press, Cambridge, MA, 2007, pp. 216–222.
S.No.
Number of Clusters
K-Means Time Complexity
FCM Time Complexity
1 1 6000 6000
2 2 12000 24000
3 3 18000 54000
4 4 24000 96000
S.No.
Number of Iterations
K-Means Time Complexity
FCM Time Complexity
1 5 3000 6000
2 10 6000 12000
3 15 9000 18000
[4] A. Rui and J. M. C. Sousa, “Comparison of fuzzy clustering algorithms for Classification”, International Symposium on Evolving Fuzzy Systems, 2006 , pp. 112-117.
[5] J. C. Bezdek, “Pattern Recognition with Fuzzy Objective Function Algorithms”, New York: Plenum Press, 1981.
[6] J. Han and M. Kamber, “Data Mining: Concepts and Techniques”, Morgan Kaufmann Publishers, 2nd ed., New Delhi, 2006.
[7] L. Hui, “Method of image segmentation on high-resolution image and classification for land covers”, Fourth International Conference on Natural Computation, vol. 5, 2008, pp. 563-566.
[8] Mathworks. http: //www.mathworks.com
[9] R. Mosley, “The Use of Predictive Modeling in the Insurance Industry”, Pinnacle actuarial resources, 2005.
[10] S. Borah and M. K. Ghose, “Performance analysis of AIM-K-Means and K-Means in quality cluster generation”, Journal of Computing, vol. 1, Issue-1, 2009.
[11] S. Chen and D. Zhang, “Robust image segmentation using FCM with spatial constraints based on new kernel-induced distance measure”, IEEE Transactions on Systems, Man and Cybernetics, vol. 34, 1998, pp. 1907-1916,.
[12] T. Kanungo and D. M. Mount, “An Efficient K-means Clustering Algorithm: Analysis and Implementation”, Pattern Analysis and Machine Intelligence, IEEE Transactions on Pattern Analysis and Machine Intelligence. vol. 24, no. 7, 2002.
[13] V. S. Rao and Dr. S. Vidyavathi, “Comparative Investigations and Performance Analysis of FCM and MFPCM Algorithms on Iris data”, Indian Journal of Computer Science and Engineering, vol.1, no.2, 2010 pp. 145-151.
[14] X. Hui, J. Wu and C. Jian, “K-Means clustering versus validation measures: A data distribution perspective”, IEEE Transactions on Systems, Man, and cybernetics, vol. 39, Issue-2, 2009 , pp.319-331. [15] X. Rui, D. Wunsch II, “Survey of Clustering Algorithms”, IEEE
Transactions on Neural Networks, vol.16, no.3, 2005.
[16] Y. Yong, Z. Chongxun and L. Pan, “A Novel Fuzzy C-Means Clustering Algorithm for Image Thresholding”, Measurement Science Review, vol. 4, no.1, 2004.
AUTHORS PROFILE
Soumi Ghosh is pursuing M. Tech (CS&E) at Amity University, Uttar Pradesh, India. Her research areas include Software Engineering and Fuzzy Logic.