92.01%
Originality
7.99%
Similarity
175
Sources
Doc vs Internet + Library
Web sources: 145 sources found
1. https://www.deepdyve.com/lp/de-gruyter/heat-transfer-during-steaming-of-bread-gQhjtWRnCt
3.05%
2. https://core.ac.uk/display/41383651
3.05%
3. https://www.european-mrs.com/2014-spring-symposium-f-european-materials-research-society
0.71%
4. https://www.pubfacts.com/search/zirconium%20tetratert-butoxide/2
0.59%
5. https://docplayer.nl/50496718-Vlaanderen-is-open-ruimte-mestrapport-2016-vlaamse-land-maatsch…
0.29%
6. https://www.slideshare.net/rmakaha/ms-office-package-practical-questions
0.29%
7. https://www.deepdyve.com/lp/elsevier/two-dimensional-cfd-modelling-and-simulation-of-an-industria…
0.24%
8. http://www.villaalbadetormes.com/registros/perfil_contratante/Proyecto%20Renov.%20y%20Mejor…
0.2%
9. http://foodhaccp.com/memberonly/newsletter761.html
0.18%
10. https://www.scribd.com/document/362923622/Baking
0.18%
11. http://khotib-makalahti.blogspot.com/2009/10/pengujian-performansi-voip-pada.html
0.16%
12. http://media.collegeboard.com/digitalServices/pdf/ap/bio-manual/Bio_Lab13-EnzymeActivity.pdf
0.16%
13. https://searchworks.stanford.edu/?per_page=100&q=Schofield+reference+collection.&search_fie…
0.16%
14. http://www.readbag.com/rdi-ku-ac-th-ku-journal-sciences-doc-ku422
0.16%
15. https://www.uts.edu.au/staff/wenshan.guo-1
0.16%
16. http://www.asturias.es/Astursalud/Ficheros/AS_Salud%20Publica/As_Vigilancia/Informes%20epi…
0.16%
17. http://onlinelibrary.wiley.com/doi/10.1111/1574-6968.12151/full?globalMessage=0
0.16%
18. http://minds.jacobs-university.de/uploads/papers/Mantas_Lukosevicius_PhD_thesis.pdf
0.16%
19. https://www.bbvaresearch.com/KETD/fbin/mult/WP_1130_tcm346-270043.pdf
0.15%
20. https://www.esrl.noaa.gov/gmd/publications/browse.php?year=2014
0.15%
21. http://www.public.asu.edu/~etcamach/AMSSI/reports/neuron.pdf
0.15%
22. http://salis.org/resources/newbooks_archive_current.htm
0.15%
23. https://www.containerstore.com/s/closet/shoe-storage/view-all-shoe-storage/12-pair-shoe-organiz…
0.15%
24. https://nepis.epa.gov/Exe/ZyPURL.cgi?Dockey=P1006YOO.TXT
0.15%
25. https://library.umd.umich.edu/newbooks/2007/july.php
0.15%
26. http://www.niisk.com/spezrada/Dissertacija.pdf
0.15%
27. https://nepis.epa.gov/Exe/ZyPURL.cgi?Dockey=91024W54.TXT
0.15%
28. https://en.wikibooks.org/wiki/Chemical_Principles/Gas_Laws_and_the_Kinetic_Theory
0.15%
29. http://www.euskadi.eus/contenidos/informacion/escuela_vasca_deporte/es_9258/adjuntos/Mikel%…
0.15%
30. http://wiener.math.csi.cuny.edu/~verzani/Projects/Tutorials/simpleR/stat.html
0.15%
31. https://www.slideshare.net/schcherban/c-44312280
0.15%
32. http://www.diva-portal.org/smash/get/diva2:901740/FULLTEXT01.pdf
0.15%
33. https://latierrayelhombre.files.wordpress.com/2012/11/cuadernillo-de-pruebas-saber-111.pdf
0.15%
35. https://www.swmich.edu/webed/syllabi/201420/201420-1496-syllabus.doc
0.15%
36. https://en.wikipedia.org/wiki/Compassion_fatigue
0.15%
37. http://www.povray.org/documentation/3.7.0/r3_4.html
0.15%
38. https://www.childwelfare.gov/pubPDFs/braindevtrauma.pdf
0.15%
39. http://www.futureacademy.org.uk/files/menu_items/other/2_icc_2876_4078_fullText_0_2400.pdf
0.15%
40. https://searchworks.stanford.edu/?f%5Bbuilding_facet%5D%5B%5D=Marine+Biology+(Miller)&pa…
0.15%
41. http://www.aurora-schools.org/userfiles/140/Classes/1203/A%20Brief%20History%20of%20the%…
0.15%
42. http://www.kyrene.org/cms/lib2/AZ01001083/Centricity/Domain/971/2013-2014%20Tips%20and%…
0.15%
43. http://meetings.aps.org/Meeting/MAR08/SessionIndex3/%3FSessionEventID%3D76699/?VirtualS…
0.15%
44. http://www.who.int/patientsafety/events/04/4_Timmons.pdf
0.15%
45. https://www.suse.com/documentation/sled-12/singlehtml/book_sle_tuning/book_sle_tuning.html
0.15%
46. https://www.slideshare.net/lecressini13/g8-healthq4lmcigarettes
0.15%
47. http://www.dartmouth.edu/~chance/teaching_aids/books_articles/probability_book/Chapter3.pdf
0.15%
48. https://pubchem.ncbi.nlm.nih.gov/rest/pug_view/data/compound/1118/JSON/?response_type=dis…
0.15%
49. http://cul.colgate.edu/content/new-acquisitions-may-2017
0.15%
50. https://searchworks.stanford.edu/?per_page=100&q=%22Mathematics+Textbooks.%22&search_…
0.15%
51. https://www3.nd.edu/~lawlib/innopac/acqspring11.html
0.15%
52. http://research.gold.ac.uk/view/year/2009.type.html
0.15%
53. https://es.slideshare.net/jaimeblancodeblas/hbitos-de-compra-offline-y-online-del-consumidor-esp…
0.15%
54. https://vdocuments.site/documents/quimica-analitica-baeza-teoria-y-problemas-2005-5707bb4745…
0.15%
55. https://moodle.capilanou.ca/mod/book/tool/print/index.php?id=328667
0.15%
56. http://povray.org/documentation/current/r3_4.html
0.15%
57. https://patents.google.com/patent/US6204248B1/en
0.15%
58. https://www.treasury.gov/press-center/press-releases/Documents/TBAC%20Discussion%20Char…
0.15%
59. https://viisaselama.fi/lahteet/kuinka-elaa-kuolematta
0.15%
60. http://duqueteaches.blogspot.com/2009/12/earth-space-review.html
0.15%
61. https://en.wikibooks.org/wiki/Microsoft_Office/Create_a_basic_two_table_database_with_reports
0.15%
62. http://norient.com/posts/page/3
0.15%
63. https://assets.kpmg.com/content/dam/kpmg/es/pdf/2017/06/la-realidad-de-consumidores-online.pdf
0.15%
64. https://atpw.files.wordpress.com/2013/03/i-geotek.pdf
0.15%
65. http://news.nhk-book.co.jp/archives/5467
0.15%
66. https://www.kidsnewtocanada.ca/mental-health/developmental-disability
0.15%
67. https://www.airbnb.ca/s/Niverville--NY
0.15%
68. https://digitum.um.es/jspui/bitstream/10201/4413/3/DiazMolins.pdf.txt
0.15%
69. https://cul.colgate.edu/content/new-acquisitions-july2017
0.15%
70. http://web.mit.edu/povray_v3.7.0a/share/doc/povray-3.7/html/r3_4.html
0.15%
71. https://www.slideshare.net/nandakishore58555941/numerical-methods-for-engineers-solution-man…
0.15%
72. http://msvanwoerkom.weebly.com/uploads/3/6/7/5/3675744/a_brief_history_of_the_united_states…
0.15%
73. https://en.wikibooks.org/wiki/Microsoft_Office/MLA_format
0.15%
74. http://duqueteaches.blogspot.com/2009_12_01_archive.html
0.15%
75. http://duqueteaches.blogspot.com
0.15%
76. http://teacher.pas.rochester.edu/phy121/LectureNotes/Chapter18/Chapter18.html
0.15%
77. http://wardamericanrevolution.weebly.com/uploads/1/4/9/1/14911572/unit_2_lesson_1_5e.pdf
0.15%
78. https://wikivisually.com/wiki/Mongoloid
0.15%
79. http://www.pi-schools.gr/special_education_new/ftp/books/a_gymnasiou/18_arial/a_maths_arial_1…
0.15%
81. https://www.lca.gov/data/Data1/Volume%20III%20Atchafalaya%20Final/appendices/Appendix%2…
0.15%
82. https://nepis.epa.gov/Exe/ZyPURL.cgi?Dockey=2000D2C2.TXT
0.15%
83. https://www.acmeintellects.org/images/AIIJRMSST/Jan2013/9-1-13.pdf
0.15%
84. http://www.worldcat.org/title/global-supply-chain-quality-management-product-recalls-and-their-imp…
0.15%
85. http://ijbsm.zbmu.ac.ir/FullHtml/IJBSM-5-20160716131206
0.15%
86. http://www.essaydocs.org/ethics-for-the-safety-and-health-professional-approaches-and-c.html?pa…
0.15%
87. https://www.slideshare.net/csandau/demystifying-the-chain-of-custody-forensic-arson-analysis-iaa…
0.15%
88. http://standardbearers.net/uploads/The_Chicago_Statement_on_Biblical_Inerrancy_1978.pdf
0.15%
89. https://vdocuments.mx/documents/springerbriefs-in-food-health-and-nutrition-food-freezing-and-th…
0.15%
90. https://www.studymode.com/subjects/describe-a-time-when-your-moral-values-influenced-the-way…
0.15%
91. http://www.tcmb.gov.tr/wps/wcm/connect/fd8ab222-1261-4344-a5bb-73c8e55b9af9/Full_text-26.p…
0.15%
92. https://www.citi.com/commercialbank/insights/assets/docs/2018/The-Bank-of-the-Future/files/ass…
0.15%
93. http://repository.uksw.edu/bitstream/123456789/8736/3/T1_672010050_Full%20text.pdf
0.15%
94. http://www.tandfonline.com/doi/ref/10.1080/23742917.2016.1252211?scroll=top
0.15%
95. https://www.adb.org/sites/default/files/publication/434731/pem-july-2018.pdf
0.15%
96. https://www.math.csi.cuny.edu/Statistics/R/simpleR/printable/simpleR.pdf
0.15%
97. https://ir.library.oregonstate.edu/downloads/jh343x732
0.15%
98. https://spire.ee.iisc.ac.in/spire/papers_pdf/Pattem_CSL_2017.pdf
0.15%
99. https://lifeafterministry.com/2011/01/12/how-to-witness-to-a-mormon
0.15%
100. https://www.frontiersin.org/articles/10.3389/fnagi.2018.00076/full
0.15%
101. http://intelligentsystemsmonitoring.com/community/security-community/journal-volume-1-2017-c…
0.15%
102. https://vdocuments.site/documents/iteaccion-estanque-liquido.html
0.15%
103. https://previa.uclm.es/profesorado/porrasysoriano/elementos/Tema03.PDF
0.15%
104. https://vdocuments.site/documents/pensamiento-variacional.html
0.15%
105. http://www.science.gov/topicpages/t/traditional+acj+tests.html
0.15%
106. https://www.frontiersin.org/articles/10.3389/fcimb.2018.00060/full
0.15%
107. https://library.hsmc.edu.hk/new-additions-list/?year=2017&month=09
0.15%
108. https://www.science.gov/topicpages/f/feng+zhou+nicolae.html
0.15%
109. https://www.frontiersin.org/articles/10.3389/fnhum.2017.00182/full
0.15%
110. http://ftp.povray.org/documentation/3.7.0/r3_4.html
0.15%
111. https://thesis.eur.nl/pub/6238/De%20Vries.doc
0.15%
112. http://www.nber.org/papers/w14621.pdf
0.15%
113. http://www.research.lancs.ac.uk/portal/services/downloadRegister/243529870/2018rodriguesfilho…
0.15%
114. https://www2.ed.gov/policy/eseaflex/approved-requests/riamendreq2014.doc
0.15%
115. http://www.ti.com/lit/ds/symlink/lm35.pdf
0.15%
116. http://www.hhs.iup.edu/rlct/SAFE806HPf13/Ethics%20-%20Wachter%20book%20draft.docx
0.15%
117. http://www.math.vt.edu/people/mcquain/csps.pdf
0.15%
118. http://www.ihst.org/Portals/54/presentations/Helitech2013/Sheffield_Culture_Survey_Assessme…
0.15%
119. http://cul.colgate.edu/content/new-acquisitions-list-september-2016-l-z
0.15%
120. http://home.portervillecollege.edu/eKeele/Nursing%20Fundamentals/General%20information/Cla…
0.15%
121. http://www.cod.edu/people/faculty/jarman/richenda/1551_hons_materials/gases_1551.pdf
0.15%
122. http://www.rodoconnorassoc.com/issues_in_the_measurement_of_qua.htm
0.15%
123. http://www.sagepub.com/sites/default/files/upm-binaries/57732_Chapter_8.pdf
0.15%
124. http://krikjecijferop.blogspot.com/2006/11/wiskunde-havovwo-deel-en-b-jaar-1.html
0.15%
125. https://www.unicef.org/honduras/Sitan_-_Analisis_de_Situacion-_Honduras_2010_2.pdf
0.15%
127. http://www.imf.org/external/pubs/ft/sdn/2015/sdn1515.pdf
0.15%
128. http://www.cdsd.k12.pa.us/cms/lib04/PA09000075/Centricity/Domain/262/Chp%201%20SG%20…
0.15%
129. http://www.oecd.org/economy/surveys/Mexico-Overview-2015%20Spanish.pdf
0.15%
130. https://www.smu.edu/~/media/Site/Simmons/Research/IEBE/2010%20CEC%20Presentation.ashx
0.15%
131. https://www.deepdyve.com/lp/elsevier/heat-transfer-a-review-of-2003-literature-tAyenNQw7u
0.15%
132. https://www.chegg.com/homework-help/questions-and-answers/physics-archive-2016-october-20…
0.15%
133. https://cimar.mae.ufl.edu/cimar/pages/thesis/tobler_MS.pdf
0.15%
134. https://www.slideshare.net/Tracxn/tracxn-research-smart-homes-landscape-november-2016-681…
0.15%
135. https://www.sprep.org/attachments/VirLib/PNG/medium-term-development-plan-2011-2015.pdf
0.15%
136. https://www.slideshare.net/DutchEmbassy/final-report-24104717
0.15%
137. http://ri.uaemex.mx/bitstream/handle/20.500.11799/58938/DCARN%20IMELDA%20GARCIA%2…
0.15%
138. https://www.saludarequipa.gob.pe/epidemiologia/bole_epi/2017/Bolet_50.pdf
0.15%
139. https://www.eng.yale.edu/grablab/pubs/DollarDissertation2006.pdf
0.15%
140. https://s3.amazonaws.com/content.accelerate-ed.com/Secondary/docs/Chemistry_HMH/Lesson…
0.15%
141. https://www.konyvneked.hu/fotky5982/fotov/_ps_1167Hogy-ne-halj-meg_Bibliografia.pdf
0.15%
142. http://www.imash.ru/netcat_files/File/lebedev/2007-a-Lebedev-DewPoint.pdf
0.15%
143. http://downloads.hindawi.com/journals/oti/2017/9592405.pdf
0.15%
144. https://www.slideshare.net/NHS_Improvement/uti-collaborative-28th-june-2018-presentations
0.15%
145. http://www.ecusd7.org/ehs/ehsstaff/akoester/Documents/Micro/Chapter%2005.pdf
0.15%
Web omitted sources: 18 sources found
1. http://expertscape.com/au/tea/Zhou%2C+Weibiao
1.52%
2. http://expertscape.com/ar/tea/a/Gao%2C+Jing
1.52%
3. https://link.springer.com/article/10.1007%2Fs11947-012-0986-3
1.43%
4. https://link.springer.com/content/pdf/10.1007%2Fs11947-015-1544-6.pdf
1.12%
5. https://link.springer.com/chapter/10.1007%2F978-981-10-2612-6_7
0.71%
6. https://pubs.acs.org/doi/abs/10.1021/nn505554y
0.71%
7. http://downloads.hindawi.com/journals/jamc/2008/502953.xml
0.71%
8. https://link.springer.com/article/10.1007%2Fs13197-012-0736-6
0.57%
9. http://jhmtr.journals.semnan.ac.ir/article_343_0.html
0.38%
10. https://www.heliyon.com/article/e00551
0.37%
11. http://www.fst.nus.edu.sg/OurPeople/ZhouW.html
0.24%
12. https://www.deepdyve.com/lp/elsevier/designing-process-controller-for-a-continuous-bread-baking…
0.24%
13. https://www.sciencedirect.com/science/article/pii/026087749400073I
0.22%
14. http://onlinelibrary.wiley.com/doi/10.1111/j.1750-3841.2010.01815.x/full
0.22%
15. http://scialert.net/fulltext/?doi=ijds.2010.113.127
0.2%
16. https://www.jointcommission.org/assets/1/18/TJC-ImprovingPatientAndWorkerSafety-Monograph…
0.16%
17. https://www.doterra.com/US/en/blog/bibliography
0.16%
18. https://www.science.gov/topicpages/g/global+immunization+vision.html
0.15%
Library sources: 10 sources found
Food Bioprocess Technology Impact of Green Tea Extract.pdf
1.63%
Green Tea Catechins Reduced the Glycaemic Potential of Bread.pdf
1.61%
Green Tea Catechins Reduced the Glycaemic Potential of Bread (1).pdf
1.61%
A Study on Bifidobacterium lactis Bb12 Viability in Bread du.pdf
0.4%
Green Tea Catechins During Food Processing and Storage.pdf
0.4%
A Study on Bifidobacterium lactis Bb12 Viability in Bread du (1).pdf
0.4%
2. Results and Discussions.docx
0.15%
Vicky Widia Yusrina-13.70.0146-22 MARET.docx
0.15%
15.I1.0019_Joshua Adi Nugraha P-KP-21 JUNI-F.docx
0.15%
Library omitted sources: 2 sources found
Heat Transfer during Steaming of Bread.pdf
100%
Victoria K. Ananingsih, Edda Y. L. Sim, Xiao Dong Chen and Weibiao Zhou*
Heat Transfer during Steaming of Bread
Abstract: Understanding of heat transfer during steaming
is important to optimize the processing of steamed bread and to produce desired qualities in the final product. Physicochemical changes occur during steaming of the dough which might be impacted upon by the heat trans-fer system. In this study, a mathematical model was developed to describe the heat transfersystem in the bread being steaming throughout the heating process. The Forward Euler method was employed for solving the three-dimensional partial differential equation set for heat transfer to produce temperature profiles at a number of individual locations in the steamed bread during its steaming. All the comparisons between the model-predicted values and the experimental results pro-duced root mean square error values ranged from 1.391 to 3.545 and R2values of all greater than 0.93. Therefore, it is confirmed that the model has a good performance and can be used to predict temperature profiles in the bread during steaming.
Keywords: heat transfer, mathematical model, steamed
bread, finite difference method
*Corresponding author: Weibiao Zhou, Food Science and Technology Programme, c/o Department of Chemistry, National University of Singapore, 3 Science Drive 3,Singapore 117543; National University of Singapore (Suzhou) Research Institute, 377 Lin Quan Street, Suzhou Industrial Park, Jiang Su 215123, People s’
Republic of China, E-mail: [email protected]
Victoria K. Ananingsih, Food Science and Technology Programme, c/o Department of Chemistry, National University of Singapore, 3 Science Drive 3, Singapore 117543; Department of Food Technology, Soegijapranata Catholic University, Jalan Pawiyatan Luhur IV/1, Semarang 50234, Indonesia, E-mail: [email protected]
Edda Y. L. Sim, Food Science and Technology Programme, c/o Department of Chemistry, National University of Singapore, 3 Science Drive 3, Singapore 117543, E-mail: [email protected]
Xiao Dong Chen, Department of Chemical and Biochemical
Engineering, Xiamen University, Fujian, China, E-mail: [email protected]
1 Introduction
Steamed bread, or called “mantou”, is a traditional staple food in northern China (i.e. the region north of the Yangtze River) and represents around 70% of the end usage of flour produced in this region and a lesser proportion in
the south [1]. Among similar products widely embraced by people in Korea, Japan and Southeast Asian countries are a variety of steamed breads with different fillings (or called steamed buns). The major steps for producing these ducts include making dough of wheat flour of lower pro-tein content compared to baked bread, dividing the dough into small pieces and moulding them and finally steaming the dough pieces using only saturated steam in the absence of any dry heat.
Steaming, which is not to be confused with the pro-cess of injecting some steam during baking, is a propro-cess that results in a series of physical, chemical and bio-chemical changes in a product, such as volume expan-sion, condensation of water on the product surface followed by the formation of an outer elastic skin (not crust), protein denaturation and starch gelatinization. The system is characterized by simultaneous heat and water transport processes within the product as well as between the product and the environment inside the steamer. At the beginning, heat transport from the envir-onment (i.e. saturated steam) to the product surface occurs mainly through convection accompanied by latent heat of condensation of steam. Afterwards, while conduc-tion at the surface is the major mode of heat transfer, for bread inside, conduction from the surface to the bread crumb centre is dominating and the latent heat of con-densation contributes along a cold front which moves towards the centre. Depending on the actual type of the product to be made and the type of steamer used, relative contributions by the various mechanisms of heat transfer can be adjusted to achieve a desired quality in the final product. Due to the high energy consumption of the steaming process, it is crucial that the operating condition of a steamer is optimized to reduce the energy consumption as well as to improve product quality, similar to baking systems [2], i.e. possible mini-mum amount of steam used per kg of dry material processed.
Both experimental and mathematical modelling approaches are often used for this purpose. In the former approach, the process is simulated in a laboratory or pilot-scale set-up to generate valuable data on the system behaviour [3]. While careful experimental data are indis-pensable in validating the process, however, unlike knowledge obtained through mathematical models, they cannot be easily generalized. Mathematical modelling,
doi 10.1515/ijfe-2013-0023 International Journal of Food Engineering 2014; 10(4): 613 623–
Brought to you by | Cornell University Library Authenticated
which is often based on known physical and chemical principles, is important in reducing the time and costs involved in experimentation. Models can also be used for the design, optimization and control of the process. Paulus [4] described transport models as one of the main characteristics of the modelling of industrial cook-ing. In recent years, there has been growing interest for the modelling of simultaneous heat and water transfers in baking [5–7]. Zhou [8] presented several heat and mass transfer models during baking which involved thermo-physical properties of product that are changing during the baking process, e.g. density, specific heat, thermal conductivity and thermal diffusivity.
Thermophysical properties are essential to develop-ing models for heat transfer. Thermophysical properties of dough and bakery products for baked goods were reported by Baik et al. [9], Marcotte [10] and Zuniga and Le-Bail [11]. Thermal conductivity, specific heat and mass diffusivity are some of the important thermophysi-cal properties essential for the modelling of heat and mass transfer during both baking and steaming processes.
So far, relatively few studies on steamed bread have been reported in the literature [1, 12]. Theoretical model-ling of the heat transfer system for steaming bread has not been reported, in contrast to many studies on baked bread [10, 13, 14]. This study aimed to develop a mathe-matical model for the heat transfer in steamed bread during its steaming process.
2 Materials and methods
2.1 Bread for steaming
The study was carried out on northern-style steamed bread. Soft or low-protein “mantou” flour (Bake King, Hong King Extra Special Flour, Singapore) was purchased from a local supermarket. The dough formulation in per-centage of flour weight was 58% water, 1% yeast (Dry baker’s yeast, Saf-instant, France), 1% salt (Pagoda, China) and 1% sugar (Sis, Australia). Mixing was done in a spiral mixer (Varimixer®WAG-RN20, Europe) com-prising one low-speed mixing step (6 min, 100 rpm). The temperature of the dough after kneading was 23 0.5°C. Dough was let to rest for 10 min at ambient temperature of around 22°C and was then sheeted and formed into hemispherical pieces using a moulder (Dr ROBOT II,
Netherlands). The moulded dough pieces were weighed to be 50 g to ensure consistency. The hemispherical dough pieces were placed on the plastic trays of a stea-mer (Phillips, H-RC 19, Singapore), and then the trays were placed into a proofing cabinet (EUROFOURS® Ms01T03-2, France) for 30 min at 40°C and a relative humidity of 80%. The hemispherical dough pieces after proofing were steamed for various pre-determined steaming periods. At each steaming operation, eight pieces of proofed samples were fitted into the steamer each time.
2.2 Steaming and temperature
measurements
Steaming was carried out in a conventional, electrically operated steamer (3 tier steamer, Tefal, Berkshire, UK) at an equilibrium surrounding temperature of 100°C in the steamer. The steamer had three trays which were stacked on top of each other. Due to the high power efficiency and the small size of the steamer, the temperature of the top tray reached an equilibrium temperature as fast as the bottom tray. In the lid of the steamer, three small holes were present which served to regulate the inside pressure of the steamer. These holes were also used to insert up to nine K-type thermocouples of 0.3 mm in diameter through the lid and place them at different positions in the dough pieces inside the steamer during steaming, through the entire stipulated steaming process.
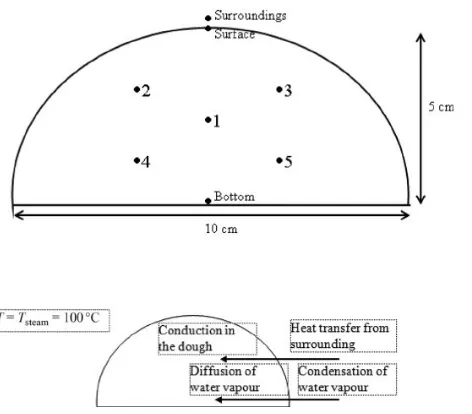
As shown in Figure 1, the thermocouples were speci-fically placed at eight different locations of the dough/ steamed bread, namely the centre (point 1), the bottom, four other different locations in the crumb of the dough (points 2–5), directly above the dough (i.e. surrounding) and just under the bread skin (i.e. surface). It was earlier observed that the temperature profiles yielded from the points on and under the bread skin were very similar due to the rapid thermal conduction through the skin. Hence, the points were taken as one (i.e. the surface point).
2.3 Moisture measurements
The determination of bread moisture distribution during steaming at different times was achieved by sampling at the locations of points 2 & 3, points 4 & 5, bottom, centre and surface. The steamed bread samples were divided into several portions, and their moistures were 614 V. K. Ananingsih et al.: Heat Transfer during Steaming of Bread
Brought to you by | Cornell University Library Authenticated
determined using a gravimetric method [15] by weighing a sample before and immediately after an oven drying. Moisture measurements were done immediately after steaming without cooling the final product. This was to ensure that the moisture contents of the bread samples during the steaming process were more accurately deter-mined, as the gravimetric analysis was done without cooling when water loss by evaporation was still com-paratively small. After drying, the samples were cooled in a desiccator and weighed by an analytical balance (sen-sitivity 0.001 g). The wet-based moisture content (M%) of a sample was calculated by the difference between the mass before (mi) and after (mf) drying using the equation:
M(%) ¼(mi–mf)100/mi.
2.4 Mathematical modelling of heat transfer
during steaming
The dough/steamed bread piece is modelled as a three-dimensional hemisphere of radius R. The dough pieces at a uniform temperature Tiand a uniform moisture contentW0 were taken out of the proofer and placed into the steamer which was at T0and its relative humidity (RH) was taken as 100% (i.e. full steam) at room pressure (i.e. 1 atm).
Heat transfer inside the dough can be treated as a heat conduction process despite that conduction was not
the only mechanism for heat transfer in the dough. Another mechanism was through water vapour diffusion from outer layers towards dough centre (Figure 1). Water vapour can diffuse from the outside environment, which consists of 100% water vapour, towards the centre of the dough; meanwhile water vapour also condenses at the surface of steamed bread from where moisture is trans-ferred either via liquid water diffusion or water vapour diffusion towards the centre. However, it was noted that the formation of skin might have significantly restricted the diffusion of water vapour from outside to bread. This was similar to the function of crust observed by various investigators during their study of baked bread, which restricted the diffusion of water vapour from bread inside towards environment [16, 17].
In this study, two major assumptions were made: (1) In the model, only heat conduction was taken into consideration neglecting the effects of mass transfer due to the computational efficiency and the complexities involved in modelling them together. Heat transfer was carried out by conduction due to the temperature gradient resulted from convection and condensation on the surface. (2) The total apparent volume was taken as constant during steaming (i.e. material expansion was ignored). The validity of these assumptions for the system will be evaluated by examining how well the model out-puts are agreeable to the experimental data.
Figure 1 Top: Schematic diagram of the cross-section of steamed bread and labelled locations for temperature measurements. Bottom: Mechanism of heat and mass transfer in the steamed bread
V. K. Ananingsih et al.: Heat Transfer during Steaming of Bread 615
Brought to you by | Cornell University Library Authenticated
The complete description of a mathematical model for the above-mentioned system is presented in the following sections.
2.4.1 Governing equation
Heat transfer equation in Cartesian coordinates is given by
@T
@t¼α @2T @x2þ
@2T @y2þ
@2T @z2
¼αÑ2T ð Þ1
α¼ λ
ρCCpp
where Tis temperature (°C), λ is thermal conductivity (Wm−1°C−1), ρis density (kg m−3), Cp is specific heat (Jkg−1°C−1), and αis thermal diffusivity (m2s−1). Assume that ρandCp were constant during the steaming process whose values are 544 kg m−3and 2,310 J kg−1°C−1. Then, λwas obtained through optimization of themodel by minimizing the root mean square error (RMSE) between the experimental and modelled values. It was found to be around 0.80 W m−1°C−1.
2.4.2 Boundary conditions
There were two boundaries taken into consideration in this study. The temperature of the dough/bread sur-roundings was taken to be 100°C throughout the steam-ing process. Since the sample was placed on a perforated solid plate which allowed a continuous access of steam to the bottom of the dough/bread, the bottom and top sur-faces of bread were also taken to be at 100°C. This was due to condensation of vapour at dough surface at the beginning so that the temperature differences between them were close to zero at all times during steaming. In other words, the temperature at the surroundings and the dough surfaces (i.e. top and bottom) was the same (100°C). This assumption was subsequently verified by the experimental results.
2.4.3 Numerical method
The numerical method used to solve the partial differential equation, i.e. eq. (1) was the Forward Euler method. It was applied via a finite difference analysis. The finite differ-ence scheme was to approximate the derivatives using changes that occur at finite intervals. To derive the finite difference equations, the dough was split into grid points
with equispaced intervals that were imposed on a rectan-gular domain. Each temperature reading on the grid is denoted by Ti,j,k. The grid spacing sizes in the x-, y- and
z-directions are denoted by hx,hyand hzrespectively. The
grid points are numbered i,jand klabelling the positions on the grid in the x-, y- and z-directions, respectively, according to Cartesian coordinates.
Under the central difference scheme, the -directionx
second-order derivative term in the right-hand side of eq. (1), i.e. @2T
@x2 can be approximated by eq. (2) as follows:
@2T
@x2
Ti1; ;j k2Ti j; ;kþTiþ1;j k;
hx2
ð2Þ
where hxis taken to be the step-size of x. Similar
approx-imations can be done for the y- and z-direction second-order derivatives.
The difference equation for a grid point (i, j, k) located inside the boundary is derived by considering the grid point (i, j, k) and six surrounding grid points.
The Forward Euler method evaluates Ti j,k, at a future time step (tþΔt) using the following equation:
@T
@t¼
TðtþΔΔtÞTðtÞ
Δ Δt
where T(t) and T(tþΔt) are temperature at time andt
time (tþΔt), respectively. ΔΔtis time step. Substituting eqs (2) and (3) into eq. (1) results in (for simplicity, only x-direction derivative is shown for illustration purpose):
TðtþΔΔtÞTðtÞ
Δ
Δt ji;j;k¼ α
Ti1;j;k2Ti j; ;kþTiþ1; ;j k
hx2
ð Þ4
Equation (4) is subsequently solved for T(tþΔt) to obtain the Ti,j,kvalue at a future time step. This scheme
is called an explicit method because, ifTi,j,k at t are
given for all the grid points, T i,j,kfor the new tþΔtfor
any grid point can be immediately calculated by simply using eq. (4).
It was noteworthy that the time step Δtof the explicit method must satisfy
Δ Δt0:5hx
2
α ð5Þ
Otherwise, instability of the solution will happen. Hence, no matter how slow the physical change of the system is,
Δ
Δtmust be equal to or smaller than 0:5hx2
α . This also means that ΔΔtmust become increasingly smaller if hxis reduced.
616 V. K. Ananingsih et al.: Heat Transfer during Steaming of Bread
Brought to you by | Cornell University Library Authenticated
A program based on the above-mentioned Forward Euler method was implemented using Matlab, and the model was simulated for a period of 20 min. The RMSE between the modelled results and the experimental results was minimized through adjusting model para-meters. In particular, λvalue in eq. (1) was usedas an input in the optimization system to minimize the output, i.e. the RMSE value.
3 Results and discussion
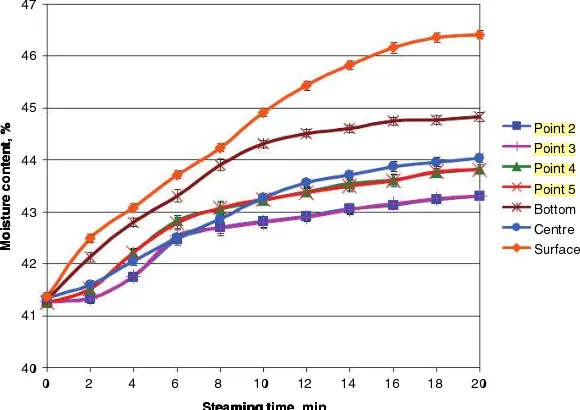
3.1 Moisture profiles
Figure 2 presents the moisture profiles at different points of measurement in the steamed bread. Moisture contents throughout the bread increased with steaming time. Also, the moisture content became relatively lower as the measurement point moved further away from the surface. Hence, it can be suggested that water diffusion occurred from the outside towards the inside of the bread to its centre. As shown in Figure 2, the moisture contents during the entire bread steaming process fell within a relatively narrow range, hence moisture transfer and its impact on heat transfer were assumed to be negli-gible in the current model developed for heat transfer.
The increase in moisture content with steaming time was due to condensation of water at the surface of bread.
The saturated steam in the surroundings also prevented evaporation of water from the bread, resulting in a sur-face of high moisture content. The high water content at the bottom of the steamed bread was due to the fact that the sample was resting on athin, wet piece of cloth on the top of a stainless steel tray during steaming. The cloth was to prevent the bread from adhering to the tray, a common practice in industrial steam bread production. Since the cloth was able to absorb more water, it pro-duced a high moisture gradient between the cloth and the bottom of the steamed bread, thus causing high moisture contents at the bottom.
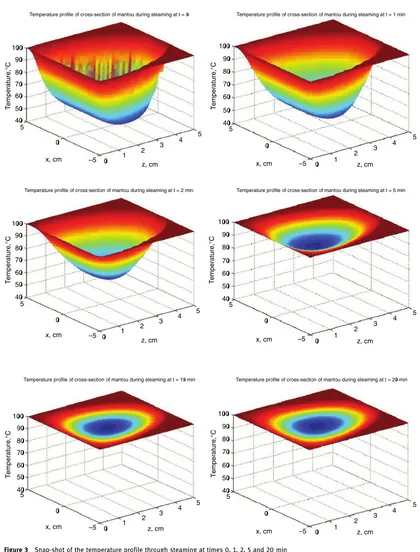
3.2 Numerical results
Forward Euler method was implemented using Matlab, and the model was simulated for a period of 20 min. Figure 3 shows some snap-shots of the temperature pro-file at the steaming times of 0, 1, 2, 5, 10 and 20 min. The gradual change in temperature after 5 min accurately depicted and matched the characteristics of the experi-mental results obtained.
3.3 Temperature profiles
Figure 4 shows that at all measurement points during the steaming process, the temperature eventually reached the heating medium temperature of 100°C. All locations in
40 41 42 43 44 45 46 47
0 2 4 6 8 10 12 14 16 18 20
Steaming time, min Steaming time, min
M
o
is
tu
re
c
o
n
te
n
t,
%
M
o
is
tu
re
c
o
n
te
n
t,
% Point 2
Point 3 Point 4 Point 5 Bottom Centre Surface
Figure 2 Moisture profiles of steamed bread at different measurement points
V. K. Ananingsih et al.: Heat Transfer during Steaming of Bread 617
Brought to you by | Cornell University Library Authenticated
0 z, cm
x, cm –5 1
2 3
4 5
0 5
100
Temperature profile of cross-section of mantou during steaming at = 0t
90 80 T e m p e ra tu re ,° C 70 60 50 40
0 z, cm
x, cm –5 1
2 3
4 5
0 5
100
Temperature profile of cross-section of mantou during steaming at = 1 mint
90 80 T e m p e ra tu re ,° C 70 60 50 40
0 z, cm
x, cm –5 1
2 3
4 5
0 5
100
Temperature profile of cross-section of mantou during steaming at = 2 mint
90 80 T e m p e ra tu re ,° C 70 60 50 40
0 z, cm
x, cm –5 1
2 3
4 5
0 5
100
Temperature profile of cross-section of mantou during steaming at = 5 mint
90 80 T e m p e ra tu re ,° C 70 60 50 40
0 z, cm
x, cm –5 1
2 3
4 5
0 5
100
Temperature profile of cross-section of mantou during steaming at = 10 mint
90 80 T e m p e ra tu re ,° C 70 60 50 40
0 z, cm
x, cm –5 1
2 3
4 5
0 5
100
Temperature profile of cross-section of mantou during steaming at = 20 mint
90 80 T e m p e ra tu re ,° C 70 60 50 40
Figure 3 Snap-shot of the temperature profile through steaming at times 0, 1, 2, 5 and 20 min
618 V. K. Ananingsih et al.: Heat Transfer during Steaming of Bread
Brought to you by | Cornell University Library Authenticated
the bread samples had an initial temperature of ~42°C. It was also observed that the temperature rise at the centre of the sample was slowest due to its longest distance away from the surface. The temperature rise at a point of measurement became greater as its distance from the surface of the bread decreased.
The initial lower temperature for the surrounding (i.e. less than 100°C) was due to the opening and closing of the steamer lid prior to the steaming process, resulting in a loss of steam and a dip in the temperature. For simpli-city in the modelling, the surrounding temperature was taken to be 100°C at all times. The rapid heat transfer through convection of steam from the boiling water at the bottom reservoir to the other parts of the steamer justifies such an assumption.
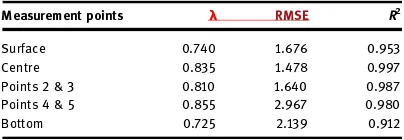
3.4 Optimization of
λ
values
The optimized λvalues which resulted in the lowest RMSE value between the modelled and experimental values are shown in Table 1. Since the temperature profiles at those points directly under and on the surface were observed to be almost the same for every experiment, these tempera-ture profiles at all times of the steaming process were taken to be the same in this work (i.e. “surface” measure-ment point). The effective thermal conductivity (λ) values determined in this study were in the range of 0.725–0.855 W m−1 °C−1(Table 1), which were close to the values
reported in the literature for baked bread, e.g. 0.72 W m−1°C−1for white bread after 8 min of baking [18].
3.5 Verification of model using optimized
λ
values
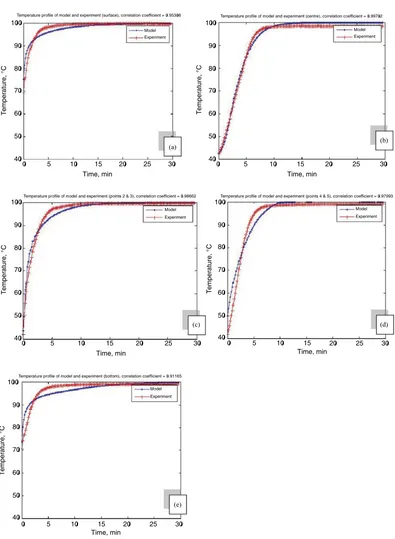
The obtained model was verified with the experimental temperature profiles at the internal five points of mea-surement during the steaming. The verifications produced low RMSE and high coefficient of determination (R2) values between the two sets of data using the optimized λvalues, as listed in Table 1. Figure 5shows the comparison between the modelled results and the experimental results. Based on the small RMSE values and high R2 values, the model verification results suggest that the model is acceptable. The model has a good performance and could be used to reproduce
Table 1 Optimized λvalues at five different locations in the steamed bread with the corresponding RMSE and R2values
Measurement points λ RMSE R2
Surface 0.740 1.676 0.953 Centre 0.835 1.478 0.997 Points 2 & 3 0.810 1.640 0.987 Points 4 & 5 0.855 2.967 0.980 Bottom 0.725 2.139 0.912
0 20 40 60 80 100 120
0 4 8 12 16 20 24 28
Steaming time, min Steaming time, min
T
e
m
p
e
ra
tu
re
,
°C
T
e
m
p
e
ra
tu
re
,
°C
Surroundings
Bottom
Points 2 & 3
Points 4 & 5
Centre
Directly under surface
Direct on surface
Figure 4 Experimental results of temperature profiles in the steamed bread during steaming. Each temperature profile is a cumulative representation of three or more profiles of the same point in three or more different experiments
V. K. Ananingsih et al.: Heat Transfer during Steaming of Bread 619
Brought to you by | Cornell University Library Authenticated
(a)
(b)
10
0 5 15
Time, min
20 25 30
100 90 80 70 60 50 40 T e m p e ra tu re , °C
Temperature profile of model and experiment (surface), correlation coefficient = 0.95308
Model Experiment
10
0 5 15
Time, min
20 25 30
100 90 80 70 60 50 40 T e m p e ra tu re , °C Model Experiment Temperature profile of model and experiment (centre), correlation coefficient = 0.99702
(c)
Temperature profile of model and experiment (points 2 & 3), correlation coefficient = 0.98662
10
0 5 15
Time, min
20 25 30 0 5 10 15
Time, min
20 25 30
10
0 5 15
Time, min
20 25 30
100 90 80 70 60 50 40 T e m p e ra tu re , °C Model Experiment (d) (e)
Temperature profile of model and experiment (points 4 & 5), correlation coefficient = 0.97993
Temperature profile of model and experiment (bottom), correlation coefficient = 0.91165
100 90 80 70 60 50 40 T e m p e ra tu re , °C Model Experiment 100 90 80 70 60 50 40 T e m p e ra tu re , °C Model Experiment
Figure 5 Verifications of the developed model using experimental data of temperature profiles taken at (a) the surface, (b) the centre, (c) points 2 & 3, (d) points 4 & 5 and (e) the bottom of the bread
620 V. K. Ananingsih et al.: Heat Transfer during Steaming of Bread
Brought to you by | Cornell University Library Authenticated
temperature profiles in the steamed bread during steam-ing process.
3.6 Validation of model
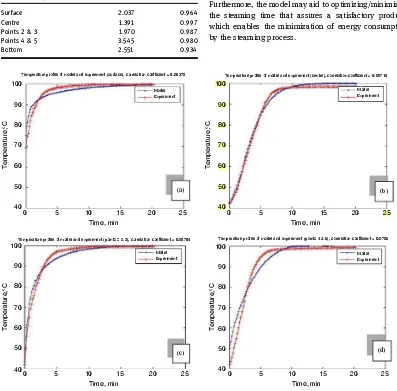
The model was validated with the experimental tempera-ture profiles at the five points of temperatempera-ture measurement
with two additional sets of independent experimental runs. The validations also produced low RMSE and high R2 values between the two sets of data using the optimized λvalues, which are listed in Table 2. Figure 6 shows the validation results of the obtained model using the independent experimental data. A good agree-ment between the modelled values and experiagree-mental results is evident in Figure 6. Together with the low RMSE values and high R2 values shown in Table 2, it confirms that the model has a good quality and can be used to predict temperature profiles and thus energy con-sumption in the steamed bread during steaming. Furthermore, the model may aid to optimizing/minimizing the steaming time that assures a satisfactory product, which enables the minimization of energy consumption by the steaming process.
Temperature profile of model and experiment (surface), correlation coefficient = 0.96378 Temperature profile of model and experiment (centre), correlation coefficient = 0.99716
10
0 5 15
Time, min
20 25
100 90 80 70 60 50 40 T e m p e ra tu re ,° C Model Experiment 10
0 5 15
Time, min
20 25
100 90 80 70 60 50 40 T e m p e ra tu re ,° C Model Experiment
(a) (b)
Temperature profile of model and experiment (points 2 & 3), correlation coefficient = 0.98704
10
0 5 15
Time, min
20 25
100 90 80 70 60 50 40 T e m p e ra tu re ,° C Model Experiment (c)
Temperature profile of model and experiment (points 4 & 5), correlation coefficient = 0.9795
10
0 5 15
Time, min
20 25
100 90 80 70 60 50 40 T e m p e ra tu re ,° C Model Experiment (d)
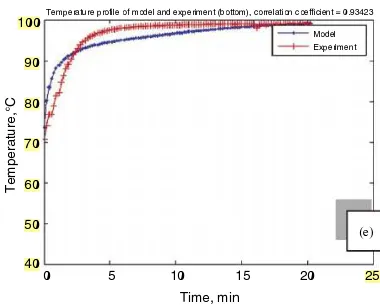
Figure 6 Validations of the developed model using independent experimental data of temperature profiles taken at (a) the surface, (b) the centre, (c) points 2 & 3, (d) points 4 & 5 and (e) the bottom of the steamed bread
Table 2 Validations of the developed model using independent experimental data with the corresponding RMSE and R2values
Measurement points RMSE (validations) R2(validations)
Surface 2.037 0.964
Centre 1.391 0.997
Points 2 & 3 1.970 0.987 Points 4 & 5 3.545 0.980
Bottom 2.551 0.934
V. K. Ananingsih et al.: Heat Transfer during Steaming of Bread 621
Brought to you by | Cornell University Library Authenticated
4 Conclusions
A three-dimensional partial differential equation heat trans-fer model for the steaming process of steamed bread has been developed and numerically solved by employing the Forward Euler method in Cartesian coordinates. Adequately low RMSE and high R2 values were obtained for both
verification and validation datasets that were independently generated through experiments. This indicates the good quality of the model. The results demonstrated that the temperature profiles in steamed bread during steaming can be satisfactorily modelled and predicted by considering only heat transfer through optimized effective thermal conductiv-ity (λ) values. Moisture contents throughout the steamed bread increased progressively with steaming time, albeit varying in a narrow range, which indicated that water diffu-sion occurred from the outside towards the inside of the steamed bread to its centre. Future works should be aimed to study the process of simultaneous heat transfer and mass transfer during the steaming process to further evaluate if the contribution from the mass transfer is significant or not to the quality of a coupled model.
Acknowledgements: Financial supports from Singapore
Ministry of Education through Academic Research Fund Tier 1 grant R-143-000-404-112 and the National University of Singapore (Suzhou) Research Institute under the grant number NUSRI2011-007 are acknowl-edged. The first author is grateful to the financial support from the Directorate General of Indonesian Higher Education in sponsoring her PhD study.
References
1. Huang S, Betker S, Quail K, Moss R. An optimized processing procedure by response surface methodology (RSM) for northern-style Chinese steamed bread. J Cereal Sci 1993;18:89 102.–
2. Carvalho MG, Martins N. Mathematical modeling of heat and mass transfer in aforced convection baking oven. In: Volintine BG, editor. AIChE symposium series-heat transfer. San Diego, CA, 1992:205 11.–
3. Simpson R, Abakarov A. Thermal food processing optimization: single and multi-objective optimization case studies. In: Ahmed J, Rahman MS, editors. Handbook of food process design. Oxford: Wiley-Blackwell, 2012:167 89.–
4. Paulus KO. Cooking kinetics: models and knowledge. In: Zenthen P, editor. Thermal processing and quality of foods. London: Elsevier Applied Science, 1984:304 12.–
5. Sablani SS, Marcotte M, Baik OD, Castaigne F. Modeling of simultaneous heat and water transport in the baking process. Lebensm Wiss Technol 1998;31:201 9.–
6. Therdthai N, Zhou W, Adamczak T. Two-dimensional CFD modelling and simulation of an industrial continuous bread baking oven. J Food Eng 2007;60:211 17.–
7. Wong SY, Zhou W, Hua JS. CFD modeling of an industrial con-tinuous bread-baking process involving U-movement. J Food Eng 2007;78:888 96.–
8. Zhou W. Baking process: mathematical modeling and analysis. In: Farid MM, editor. Mathematical modeling of food processing. Boca Raton, FL: CRC Press, Taylor & Francis Group, 2010:357–372).
9. Baik OD, Marcotte M, Sablani SS, Castaigne F. Thermal and physical properties of bakery products. Crit Rev Food Sci Nutr 2001;41:321 52.–
10. Marcotte M. Heat and mass transfer during baking. In: Yanniotis S, Sunden B, editors. Heat transfer in food processing. Southampton and Boston, MA: WIT Press, 2007.
11. Zuniga R, Le-Bail A. Assessment of thermal conductivity as a function of porosity in bread dough during proving. Food Bioproducts Process 2009;87:17 22.–
12. Hou GG, Popper L. Chinese steamed bread. In: Popper L, Schäfer W, Freund W, editors. Future of flour: a compendium of flour improve-ment. Germany: Mühlenchemie, 2006.
13. Feyissa AH, Gernaey KV, Adler-Nissen J. Uncertainty and sensitivity analysis: mathematical model of coupled heat and mass transfer for a contact baking process. J Food Eng 2011;109:281 90.–
14. Sakin-Yilmazer M, Kemerli T, Isleroglu H, Ozdestan O, Guven G, Uren A, et al. Baking kinetics of muffins in convection and steam assisted hybrid ovens. J Food Eng 2013;119: 483 9.–
Temperature profile of model and experiment (bottom), correlation coefficient = 0.93423
10
0 5 15
Time, min
20 25
100
90
80
70
60
50
40
T
e
m
p
e
ra
tu
re
,°
C
Model Experiment
(e)
Figure 6 (continued)
622 V. K. Ananingsih et al.: Heat Transfer during Steaming of Bread
Brought to you by | Cornell University Library Authenticated
15. AOAC. In: Cunniff P, editor. Official methods of analysis of AOAC international, 60th ed. Maryland: AOAC International, 1996.
16. Hamdami N, Monteau J-Y, Le Bail A. Moisturediffusivity and water activity of frozen part baked bread. Int J Food Sci Technol 2003;41:33 44.–
17. Zanoni B, Peri C, Gianotti R. Determination of the thermal diffusivity of bread as a function of porosity. J FoodEng 1995;26:497 510.–
18. Unklesbay N, Unklesbay K, Nahaisi M, Krause G. Thermal conductivity of white bread during convective heat processing. J Food Sci 1981;47:249–53 & 259.
V. K. Ananingsih et al.: Heat Transfer during Steaming of Bread 623
Brought to you by | Cornell University Library Authenticated