ESTIMATION OF MANGROVE CARBON STOCK (ABOVEGROUND) IN TANJUNG API-API, SOUTH SUMATERA
ESTIMASI STOK KARBON MANGROVE (ABOVEGROUND) DI TANJUNG API-API, SUMATERA SELATAN
Anna Ida Sunaryo Purwiyanto* dan Fitri Agustriani Marine Science Department, Sriwijaya University, Palembang
*E-mail: anna_is_purwiyanto@unsri.ac.id
ABSTRACT
The rapid development of infrastructure that occurred in the area of Tanjung Api-api resulted in changes in the function of mangrove land along the coast. Directly, this also impacts on the sustainability of ecological functions of mangroves. This study aims to estimate changes (prior to infrastructure development and current conditions) of aboveground carbon reserves stored in mangrove forests in Tanjung Api-api. This research was conducted in June-August 2016. Carbon stocks in mangrove along Tanjung Api-api were conducted by surveying the mangrove species and density, and then calculating biomass and carbon stock using allometric equation. While changes in carbon stocks are calculated by converting changes in mangrove area before and after infrastructure development to carbon stock value. The change of mangrove area was done by doing image data processing in 2005 and 2016. The results showed that mangrove Tanjung Api-api has 9 species of mangrove with total mangrove aboveground biomass of Tanjung Api-api is 1.1498 Mg.ha-1 and stored carbon of 0.5235 MgC.ha-1 and able to absorb CO
2 of 1.1921 MgC.ha-1. The result of satellite image processing shows that there is a reduction of mangrove land of 1056.6 ha during the last 11 years from 9741.15 ha in 2005 (before development) to 8684.55 ha in 2016. Thus, there is a decrease of mangrove biomass by 1214.894 Mg, carbon stock is reduced by 553.090 MgC and CO2 uptake is reduced by 2029.84 MgC.
Keywords : aboveground, CO2, mangrove, Tanjung Api-api ABSTRAK
Pesatnya pembangunan infrastruktur yang terjadi di kawasan Tanjung Api-api mengakibatkan perubahan fungsi lahan mangrove di sepanjang pesisir. Secara langsung, hal ini juga berimbas pada keberlangsungan fungsi ekologis mangrove. Penelitian ini bertujuan untuk mengestimasi perubahan (sebelum pembangunan infrastruktur dan kondisi terbaru) cadangan karbon above ground yang tersimpan dalam hutan mangrove di Tanjung Api-api. Penelitian ini dilakukan pada Juni-Agustus 2016. Cadangan karbon di mangrove sepanjang Tanjung Api-api dilakukan dengan melakukan survei jenis dan kerapatan mangrove, dan kemudian dilakukan penghitungan biomassa dan cadangan karbon menggunakan persamaan alometrik. Perubahan cadangan karbon dihitung dengan mengkonversi perubahan luas areal mangrove sebelum dan sesudah pembangunan infrastruktur terhadap nilai cadangan karbon. Perubahan luas areal mangrove dilakukan dengan melakuka pengolahan data citra tahun 2005 dan 2016. Hasil penelitian menunjukkan bahwa mangrove Tanjung Api-api memiliki 9 jenis mangrove dengan total biomassa mangrove di atas permukaan tanah di pesisir Tanjung Api-api adalah sebesar 1.1498 Mg.ha-1 dan karbon tersimpan 0.5235 MgC.ha-1 dan
mampu menyerap CO2 sebesar 1.1921 MgC.ha-1. Hasil pengolahan citra satelit menunjukkan adanya pengurangan lahan mangrove sebesar 1056,6 ha selama 11 tahun terakhir, yaitu dari 9741,15 ha pada tahun 2005 (sebelum pembangunan) menjadi 8684,55 ha pada tahun 2016. Sehingga, terjadi penurunan biomassa mangrove sebesar 1214.894 Mg. Karbon tersimpan berkurang sebesar 553.090 MgC dan serapan CO2 berkurang sebesar 2029.84 MgC.
762 http://journal.ipb.ac.id/index.php/jurnalikt
I. INTRODUCTION
Mangrove forest is a tropical and sub-tropical vegetation community that is able to grow and develop in tidal areas of sea water. The typical root system is a way of adapting to a particular habitat (Bengen, 2000). Similar to the forest ecosystem in general, mangrove forest ecosystems also have a role as an absorber of carbon dioxide (CO2) so
that mangrove is very important and relevant to climate change. About 50% of the total forest carbon is stored in mangrove forest vegetation. The carbon stocks are stored both in the aboveground, such as leaves and stems, as well as on belowground, such as roots and litter that have fallen to the ground. Nevertheless, carbon deposits by above-ground of mangrove will be larger than the belowground, reaching 88.26% above the ground and only 14.08% at belowground (Mashaly et al., 2016). The calculation of carbon stock can be done by knowing the amount of mangrove biomass itself and using allometry for the calculation of carbon stock. Mangrove biomass can be done by mangrove logging in the sample area. But of course, this is hard to do and even becomes illegal because one of the consequence is just the increase in the amount of carbon in the atmosphere. Therefore, a method of allo-metry was developed using stem diameter, height of mangrove and wood density for consideration of calculation (Komiyama et al., 2008; Medeiros and Sampaio, 2008; Fu and Wu, 2011).
Tanjung Api-api is administratively a part of coastal area of South Sumatra which has an important function. The inauguration of Tanjung Api-api area as a special economic area resulted in the development of South Sumatera much focused in Tanjung Api-api area, ranging from port development to industry. This makes Tanjung Api-api area a strategic area in infrastructure change. The development of adequate infrastructure for the achievement of government goals in developing Tanjung Api-api area will of
course lead to changes in the ecosystem in the form of reduction of mangrove area. Continuously, this will lead to changes in mangrove function, especially with regard to ongoing global warming (IPCC, 2002). Van der Werf et al. (2009) suggests that de-forestation and degradation of mangrove eco-systems cause CO2 emissions to atmosphere
into the second largest after fuel combustion. Research on carbon stocks in the area of Tanjung Api-api has been done before, but still only on the estuary that faces the sea. Total carbon stored in mangrove (above and belowground) reached 6000 MgC.ha-1 (Melki and Isnaini, 2014). The value was large enough to support mangrove function in absorbing atmospheric carbon. Especially considering generally, aboveground mang-rove biomass in tropical wetlands was 0.099 Mg of dry matter.ha-1 (Ajonina, 2008 in Mashaly, 2016). Therefore, this study aims to estimate the changes (prior to infrastructure development and the latest condition) of above ground carbon reserves stored in mangrove forests in Tanjung Api-api.
II. METHODS
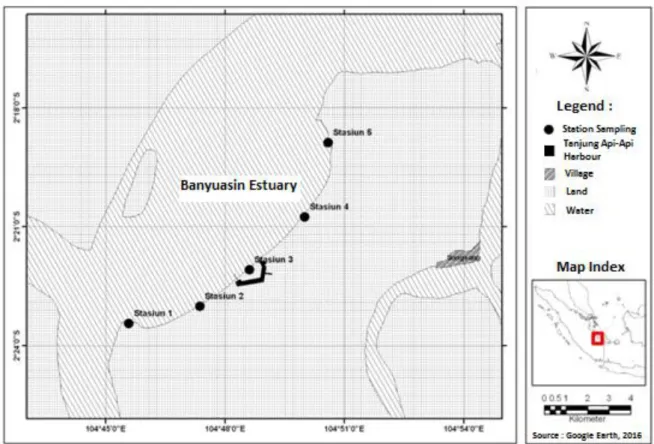
The research was conducted along the Tanjung Api-api area from June to August 2016. Sampling was conducted on 5 stations representing each coastal area in Tanjung Api-api. Tanjung Api-api has a fairly thick mangrove area, but this research was focused on the area along the coast, considering the change of mangrove area concentrated in the coastal area. Map of research location can be seen in Figure 1.
2.1. Research Methods 2.1.1. Image Processing
The image data used include image data prior to the construction of ports and industry, and the latest image data. Image processed through image recovery procedure, image enhancement, geometric and radio-metric correction, classification and deter-mination of the extent of mangrove.
Figure 1. Research location.
This processing is intended to obtain the areas of mangrove Tanjung Api-api overall, including changes in the mangrove area. The imagery used is the 2005 image that represents the condition of mangrove before the infrastructure development and the latest mangrove condition in 2016.
2.2. Field sampling
Samples mangrove were taken in-cluding the sample stems, twigs, and leaves. Sampling was done by making a mangrove plot refers to the simple sampling methods according to Manuri et al. (2011). Simple sampling is one of the common sampling techniques performed on mangrove carbon analysis. This method is used in areas where initial data on estimates of carbon stock distribution are not available. This method does not classify sample populations based on certain considerations so that the variation between plots becomes larger (Manuri et al., 2011). The mangroves observed for analyzed
carbon stocks in this study, focused on mangroves having stem diameters (DBH) ≥ 5 cm in accordance with Komiyama et al. (2005). Therefore, in the sampling method, using 4 subplots representing mangrove size (2 m x 2 m for seedlings, 5 m x 5 m for saplings, 10 m x 10 m for pole and 20 m x 20 m for tree). The grouping was performed in accordance with Lugina et al. (2011), Manuri
et al. (2011) and SNI No. 7724 of 2011 to facilitate the recording of data in the field.
2.3. Data analysis
Data analysis includes calculation of community structure, mangrove biomass, carbon stock estimation, carbon uptake esti-mation by mangrove and estimated changes in carbon stock. Calculation of mangrove community structure was done to know the distribution of mangrove species and density as carbon absorber. Calculations were performed using the Shannon-Wiener Index which includes relative density (RDi),
764 http://journal.ipb.ac.id/index.php/jurnalikt relative frequency (RFi), relative bassal area
(RBA) and important value (IV). The equa-tions used are as follows (Ati et al., 2014):
𝑅𝐷𝑖 =∑ 𝑛 𝑥 100 %𝑛𝑖
𝑅𝐹𝑖 = ∑ 𝐹 𝑥 100 % 𝑑𝑒𝑛𝑔𝑎𝑛 𝐹𝑖 =𝐹𝑖 ∑ 𝑝𝑝𝑖
𝑅𝐵𝐴 = ∑ 𝐶 𝑥 100 % 𝑑𝑒𝑛𝑔𝑎𝑛 𝐶𝑖 =𝐶𝑖 𝐵𝐴𝐴
𝐼𝑉 = 𝑅𝐷𝑖 + 𝑅𝐹𝑖 + 𝑅𝐶𝑖 ... (1) Keterangan : ni = number of species i; n = total number of species; pi = number of species i in the observed plot; BA = basal area type; A = area unit width.
Calculation of mangrove biomass was carried out by using equation Komiyama et al. (2005): 46 . 2 251 . 0 D Wtop
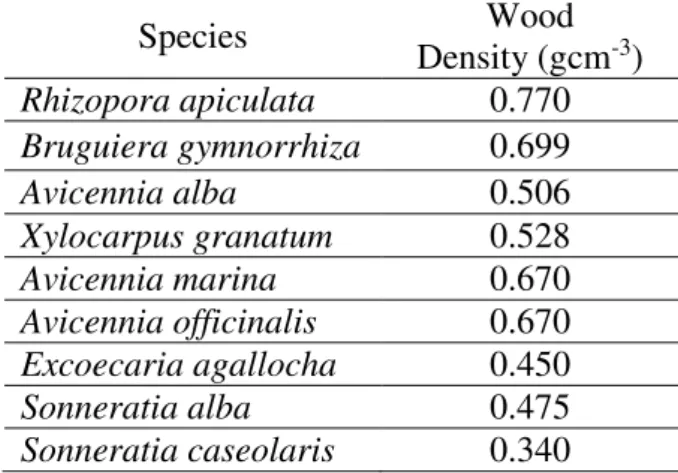
... (2) Keterangan: Wtop = biomass on the surface (kg), D = diameter (cm), and ρ = density of wood (g.cm-3).The density value of the wood following the research results Komiyama et al. (2005), Kauffman and Donato (2012) and are presented in Table 1.
Table 1. Wood density of mangroves.
Species Wood Density (gcm-3) Rhizopora apiculata 0.770 Bruguiera gymnorrhiza 0.699 Avicennia alba 0.506 Xylocarpus granatum 0.528 Avicennia marina 0.670 Avicennia officinalis 0.670 Excoecaria agallocha 0.450 Sonneratia alba 0.475 Sonneratia caseolaris 0.340
Carbon content value is obtained using the data and calculated the total biomass with SNI 7724-2011 equation: Cb = 0.47 x B ... (3)
Notes: 𝐶𝑏 = the carbon content from biomass (kg); 𝐵 = total biomass (kg)
The uptake of CO2 was calculated using
Brown (1997) equation:
n karbon x kandunga
CO23,67 ... (4)
III. RESULT AND DISCUSSION 3.1. Mangrove Community Structure
Mangrove vegetation that becomes the object of research is in the size of the mangrove saplings, poles and trees. The size of the grouping criteria is based on the size of the trunk diameter obtained by Teddy et al. (2015). Mangrove individuals who have less than 5 cm in diameter are not taken into account in the study. Along Tanjung Api-api found 9 true mangrove species, namely
Avicennia alba, Avicennia marina, Avicennia officinalis, Bruguiera gymnorrhiza, Excoe-caria agallocha, Rhizophora apiculata, Sonneratia alba, Sonneratia caseolaris,
Xylocarpus granatum. Numbers of mangrove
species in Tanjung Api-api were more than mangrove species found in Sembilang National Park. Manuri et al. (2011) stated that in Sembilang National Park, only found six species of mangroves with dominance on the type of Rhizophora apiculata and
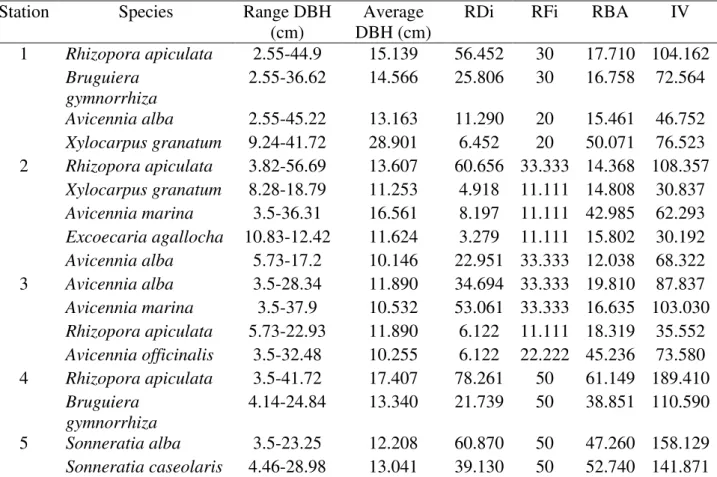
Bruguiera gymnorhiza. The distribution of individual distribution of mangroves on the station are presented in Table 2.
Table 2 was seen that each station has different composition of mangrove species, especially at station 5 which is found only by
Sonneratia. Zurba et al. (2017) explains the
Sonneratia usually likes mud and sand subs-trate and is often found in coastal areas or es-tuaries that are protected from waves. Fur-ther, described by Kartawinata et al. (1978)
Table 2. The composition of mangroves species in Tanjung Api-api.
Station Species Range DBH
(cm)
Average DBH (cm)
RDi RFi RBA IV
1 Rhizopora apiculata 2.55-44.9 15.139 56.452 30 17.710 104.162 Bruguiera gymnorrhiza 2.55-36.62 14.566 25.806 30 16.758 72.564 Avicennia alba 2.55-45.22 13.163 11.290 20 15.461 46.752 Xylocarpus granatum 9.24-41.72 28.901 6.452 20 50.071 76.523 2 Rhizopora apiculata 3.82-56.69 13.607 60.656 33.333 14.368 108.357 Xylocarpus granatum 8.28-18.79 11.253 4.918 11.111 14.808 30.837 Avicennia marina 3.5-36.31 16.561 8.197 11.111 42.985 62.293 Excoecaria agallocha 10.83-12.42 11.624 3.279 11.111 15.802 30.192 Avicennia alba 5.73-17.2 10.146 22.951 33.333 12.038 68.322 3 Avicennia alba 3.5-28.34 11.890 34.694 33.333 19.810 87.837 Avicennia marina 3.5-37.9 10.532 53.061 33.333 16.635 103.030 Rhizopora apiculata 5.73-22.93 11.890 6.122 11.111 18.319 35.552 Avicennia officinalis 3.5-32.48 10.255 6.122 22.222 45.236 73.580 4 Rhizopora apiculata 3.5-41.72 17.407 78.261 50 61.149 189.410 Bruguiera gymnorrhiza 4.14-24.84 13.340 21.739 50 38.851 110.590 5 Sonneratia alba 3.5-23.25 12.208 60.870 50 47.260 158.129 Sonneratia caseolaris 4.46-28.98 13.041 39.130 50 52.740 141.871
Keterangan : RDi = relative density; RFi = relative frequency; RBA = relative bassal area; IV = important value.
Figure 2. Percentage distribution of Shannon-Wiever Index of mangrove species.
0 5 10 15 20 25 30 35 40 45
%
766 http://journal.ipb.ac.id/index.php/jurnalikt in Kushartono (2009), where this difference
is allegedly caused by differences in soil properties especially organic material con-tent. Mardiana (2005) in Nursin et al. (2014) also explains that one of the properties that affect the existence of mangrove land is a type of soil that has a smooth texture, low maturity level, salinity and high alkalinity, and often contain layers of acid sulfate or sulfidic materials (paint clay). In addition to differences in the species composition, the difference at each station also looked at the diameter size distribution and most important value. However, based on the diameter size, overall mangrove stakes which were in the category dominates the mangrove ecosystem in Tanjung Api-api. These conditions will further affect carbon stocks held by the mangrove.
Based on Figure 2, generally,
Rhizopora apiculata has the highest distri-bution, abundance and even IV compared to other species of mangroves. Although the average diameter of Rhizopora is not greater than other species, but the abundance (RDi) and frequency (RFi) of Rhizopora were predominate. Rhizopora generally reached 26% of the overall IV (Figure 2). Important value (IV) shows that species which has the highest density will have the highest IV. Those results in line with mangrove research analysis in Tanjung Lesung, Banten (Ati et al., 2014).
3.2. Biomass, Carbon Stock and CO2 Uptake
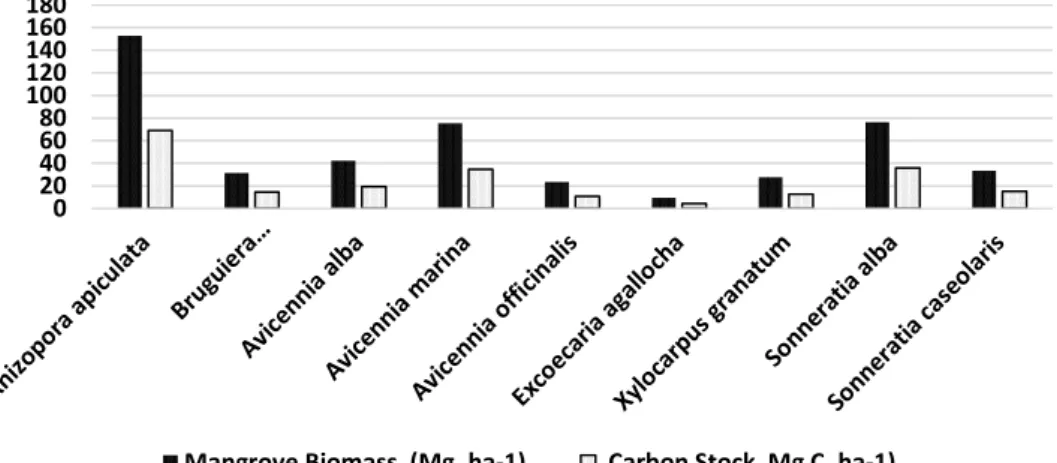
Biomass is defined as the total amount of living matter that is above the surface at a tree and expressed in units of tons of weight per unit area (Kitamura et al., 1997). Measurements of biomass can be performed using allometric equations based on the size of stem diameter and density of wood every species of mangrove. The results of the calculation showed that biomass can be used to determine the carbon stocks contained in plants. Kauffman et al. (2011) explained that the stock of carbon in mang-rove forests is 46-50% of the total biomass of mangrove. Calculation of carbon stock in mangrove was done by using allometry of Komiyama et al. (2005). The result of the calculation of the carbon content is presented in Figure 3 and Table 3.
In Figure 3, the highest biomass and carbon stock is found in Rhizoporaapiculata. This is suspected because the type of Rhizo-pora is the dominant mangrove species in terms of density and frequency (see Figure 2). This is consistent with Ati et al. (2014) which suggests that the potential of mang-rove biomass is influenced by soil fertility and tree density. Similar results were also found by Hartoko et al. (2014) in Kemujan mangrove Parang Island Karimunjawa Natio-nal Park and Demak Coastal Area, and Chan-dra et al. (2011) in Sarawak mangrove area.
Figure 3. Biomass (Mg. ha-1) and carbon stock (MgC. ha-1) of each mangrove species.
0 20 40 60 80 100 120 140 160 180
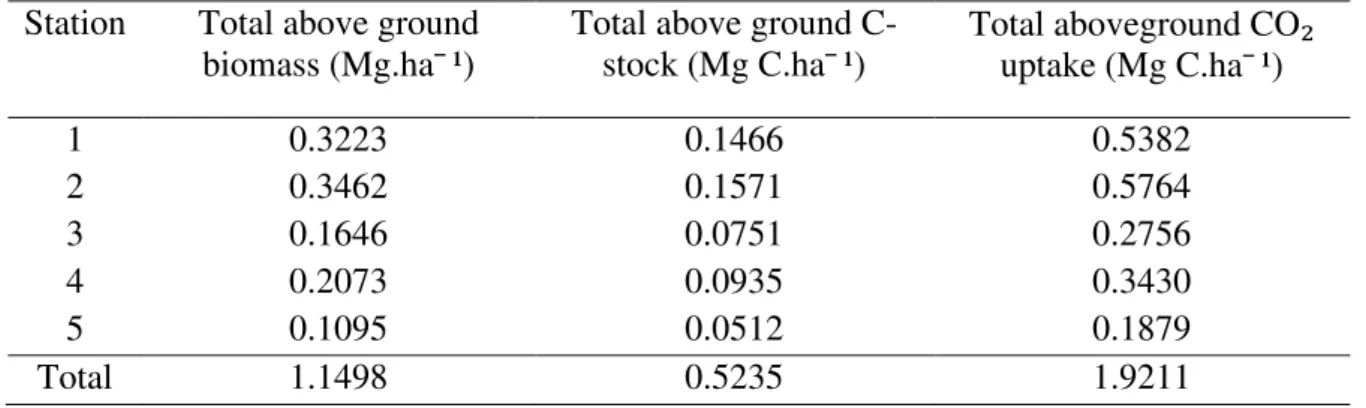
Table 3. Aboveground biomass, carbon stock and CO2 uptake by mangrove at each station.
Station Total above ground biomass (Mg.ha¯ ¹)
Total above ground C-stock (Mg C.ha¯ ¹) Total aboveground CO₂ uptake (Mg C.ha¯ ¹) 1 0.3223 0.1466 0.5382 2 0.3462 0.1571 0.5764 3 0.1646 0.0751 0.2756 4 0.2073 0.0935 0.3430 5 0.1095 0.0512 0.1879 Total 1.1498 0.5235 1.9211
Table 3 shows the total above ground biomass of mangrove in Tanjung Api-api was 1.1498 Mg. ha-1. The highest biomass contained at station 2 and the smallest at station 5. Station 1 which had an individual number of almost the same as station 2 but had a smaller biomass value even though the average diameter of the stem was larger. This was because at station 2, found more types of mangroves. Allometric calculations were based on the wood density and stem diameter of each species, so that although the stem diameter was larger but the number of species will have a role in the calculation of biomass. This is evidenced by the correlation value (r) obtained, where the relationship between stem diameter and biomass was 0.813, the relationship between biomass and mangrove density was 0.925 and the relationship between biomass and mangrove species was 0.738. Each correlation indicates a strong relationship, so the causation of the three needs to be considered that will affect the mangrove biomass. In addition, Chandra
et al. (2011) also confirmed that the variation of mangrove biomass is one of them caused by species. Similar results were also found by Cahyaningrum et al. (2014), where the higher number of trees does not necessarily have higher biomass.Based on Table 3, the ability of mangrove Tanjung Api-api was large enough to store carbon, which amounted to 0.5235 MgC. ha-1 and its able to absorb CO2 of 1.9211 MgC. ha-1. The carbon
content was lower when compared to the
mangrove Sembilang National Park which store carbon at 141.0 MgC. ha-1 (Manuri et al., 2011). However, those ability was higher than the carbon content of mangrove in Segara Anakan which were only able to store carbon by 0.0416 MgC. ha-1 (Aziz et al., 2013) and mangrove in Dumai Bandar which capable of storing carbon 0.0579 MgC. ha-1 (Mandarin et al., 2016). This difference is thought to be caused by various factors, such as mangrove species composition, mangrove density, mangrove conservation level, and sediment conditions of mangrove habitat (Sitoe et al., 2014).
3.3. Estimation of Alteration in Carbon Stock and Absorption
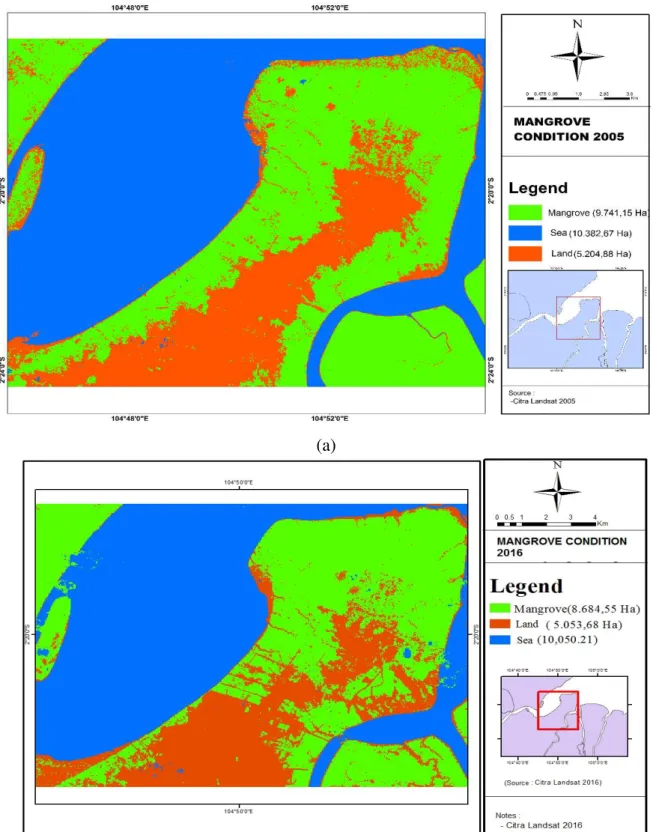
Estimation of changes in carbon stocks in mangrove Tanjung Api-api per-formed by processing image data. Image pro-cessing resulted in 2005 and 2016 showed the magnitude changes in the area of man-grove which of course will have an impact on the carbon content changes. The image processing results is shown in Figure 3.
Figure 4 showed the change in the function of the mangrove area of Tanjung Api-api, i.e. the change on green color areas. In 2005, the mangrove area of Tanjung Api-api was 9741.15 ha, and in 2016 was reduced to 8684.550 ha. Or we can say that in 11-year period, the extent of mangrove area of Tanjung Api-api reduced by 10.85%. Chang-es in the area of mangrove areas, which will directly impact on the change in the amount
768 http://journal.ipb.ac.id/index.php/jurnalikt (a)
(b)
Figure 3. Results of Image Processing (a). 2005; (b). 2016. of carbon and CO2 can be stored. In 2005,
with an area of 9741.15 ha, the mangrove areas Tanjung Api-api has above ground
biomass of 11200.516 Mg. That biomass was capable to store amounting to 5099.120 Mg carbon and capable of absorbing CO2 by
18713.8 Mg. But in 2016, the reduced area of mangrove resulted in above ground biomass also experienced a reduction becomes 9985.622 Mg. The carbon content in the mangrove was also reduced to 4546.03 Mg C and 16683.9 Mg of CO2 uptake.
Decrease the amount of carbon stocks and CO2 absorption capability is not only
caused by a reduction in the mangrove area, but the conditions were more dominated by mangrove stakes also affects the ability of mangrove plants in absorbing and storing carbon. It was described by Sutaryo (2009), that the largest proportion of carbon stocks will be found in plants that have a large diameter.
IV. CONCLUSION
Mangrove area of Tanjung Api-api has 9 species of mangroves with above-ground biomass 1.149Mg. ha-1. It supported mangrove ability to store large amounts of carbon, which was about 0.524MgC. ha-1 and absorb CO2 of 1.921 MgC. ha-1.
Never-theless, the development of infrastructure in Tanjung Api-api resulted in a reduction in the mangrove area of 1056.6 ha or 10.85% in the las 11 years. This reduction resulted in a decrease of 553.090 MgC in aboveground carbon stock and a decrease in mangrove CO2 uptake of 2029.84 MgC.
ACKNOWLEDGMENT
Researchers thanked to Yulianto Su-teja, Tony, Rico Febriansyah, Rama Adriyan, and Jufrensis Sembiring for help and contri-buting in the field sampling and laboratory process. The authors would also like to thank the anonymous reviewers for their positive and constructive comments.
REFERENCE
Ati, R.N.A, A. Rustam, T.L. Kepel, N. Sudirman, M. Astrid, A. Daulat, D.D. Suryono, Y. Puspitaningsih, P.
Mang-indaan, and A. Hutahaean. 2014. Karbon stok dan struktur komunitas mangrove sebagai blue carbon di Tanjung Lesung, Banten. J. Segara,
10(2):119-127.
Azizah, M., E.R. Ardli, and E. Sudiana. 2013. Analisis stok karbon hutan mangrove pada berbagai tingkat ke-rusakan di Segara Anakan Cilacap. J. Sains Natural Universitas Nusa Bangsa, 3(2):161–172.
Brown, S. 1997. Estimating biomass and bio-mass change of tropical forest. FAO. USA. 134p.
Bengen, D.G. 2000. Ekosistem dan sumber-daya alam pesisir. Pusat Kajian Sumberdaya Pesisir dan Lautan. Bogor. 62hlm.
Cahyaningrum, S.T., A. Hartoko, and Sur-yanti. 2014. Biomassa karbon mang-rove pada kawasan mangmang-rove Pulau Kemujan Taman Nasional Karimun-jawa. Diponegoro J. of Maquares,
3(3):34-42.
Chandra, I.A., G. Seca, and A. Hena. 2011. Aboveground biomass production of
Rhizopora apiculata Blume in Sa-rawak mangrove forest. American J. of Agr and Bio Sci, 6(4):469-474 Fu, W. and Y. Wu. 2011. Estimation of
aboveground biomass of different mangrove trees based on caopy dia-meter and tree height. Procedia Environ. Sci., 10:2189-2194.
Hartoko, A., S. Chayaningrum, D.A. Febrianti, D. Ariyanto, and Suryanti. 2014. Carbon biomass algorithms development for mangrove vegetation in Kemujan, Parang Island Karimun-jawa National Park and Demak Coastal Area – Indonesia. Procedia Environ. Sci., 23:39 – 47
Kauffman, J.B., C. Heider, T.G. Cole, K.A. Dwire, and D.C. Donato. 2011. Eco-system carbon stocks of micro-nesian mangrove forest. Wetlands, 31: 343 – 452.
770 http://journal.ipb.ac.id/index.php/jurnalikt Kauffman, J.B. and D.C. Donato. 2012.
Protocols for the measurement, monitoring and reporting of struc-ture, biomass and carbon stocks in mangrove forests. Working Paper 86. CIFOR, Bogor. 50p.
Kitamura, S., C. Anwar, A. Chaniago, and S. Baba. 1997. Handbook of mangrove in Indonesia: Bali and Lombok. International society for mangrove ecosystem. Denpasar. ??p.
Komiyama, A., S. Poungparn, and S. Kato.
2005. “Common allometric
equa-tions for estimating the tree weight of mangroves. J. of Tropical Ecology
21:471–477. doi:10.1017/S0266467 405002476.
Kushartono, E.K. 2009. Beberapa aspek bio-fisik kimia tanah di daerah mangrove Desa Pasar Banggi Kabupaten Rem-bang. J. Ilmu Kelautan, 14(2):76-83. Lugina, M., K.L. Ginoga, A. Wibowo, A. Bainnura, dan T. Partiani. 2011. Pro-sedur operasi standar untuk peng-ukuran dan perhitungan stok karbon di kawasan konservasi. Pusat Pe-nelitian dan Pengembangan Per-ubahan Iklim dan Kebijakan. Badan Penelitian dan Pengembangan Ke-hutanan. Bogor. 34hlm.
Mandari, D.Z., H. Gunawan, dan M.N. Isda. 2016. Penaksiran biomassa dan kar-bon tersimpan pada ekosistem hutan mangrove di Kawasan Bandar Bakau Dumai. J. Riau Biologia, 1(3):17-23. Manuri, S., J. Purbopuspito, and M.W. War-ren. 2011. C-stock assessment of mangrove ecosystem at Sembilang National Park, South Sumatra, Indo-
nesia. Technical Report. https:// www.researchgate.net/publication/26 7512031. doi:10.13140/2.1.3600.8965 Mashaly, I.A., A.K. Hegazy, M.A. Aal, and S.A. El-Hussieny. 2016. Habitat-based estimate of carbon content in mangrove Avicennia marina (For-ssk.) Vierh. of South Sinai, Egypt.
IOSR-J. of Environ, Sci, Toxicol, and Food Tech, 10(11):8-14.
Mederios, T.C.C. and E. Sampaio. 2008. Allometry of aboveground biomas-ses in mangrove species in Itama-racá, Pernambuco, Brazil. Wetlands Ecol. and Management, 16:323-330 Sitoe, A.A., L.J.C. Mandlate, and B.S.
Guedes. 2014. Biomass and carbon stocks of Sofala Bay mangrove forests. Forests, 5:1967-1981. doi: 10.3390/f5081967.
Sutaryo. D. 2009. Perhitungan biomassa (sebuah pengantar untuk studi kar-bon dan perdagangan karbon). Wetlands International Indonesia Programme. Bogor. 48p.
Teddy, R., T. Tiryana, dan J. Purwanto. 2015. Panduan survei cadangan kar-bon dan keanekaragaman hayati di Sumatera Selatan. Final Report. Ger-man International Cooperation (GIZ) dan Kementerian Lingkungan Hidup dan Kehutanan. Dinas Kehutanan Provinsi Sumatera Selatan. 80p. Zurba, N., H. Effendi, and Yonvitner. 2017.
Pengelolaan potensi ekosistem ma-ngrove di Kuala Langsa, Aceh. J. Ilmu dan Teknologi Kelautan Tropis,
9(1):281-300.
Diterima : 24 Agustus 2017
Direview : 23 Oktober 2017