Chapter
10
301
Why Do Migrants Migrate?
Self-Selection and Returns to
Education in West Africa
Philippe De Vreyer, Flore Gubert, and François Roubaud
Migration from and to African countries is extensive, with estimates ranging from about 16 million international African migrants according to the Inter-national Organisation for Migration (IOM 2003) to 50 million according to the African Union (African Union 2005). West Africa in particular has a long history of population mobility, both regionally and internationally. Linked to factors as diverse as long-distance trade, plantation agriculture, and urbaniza-tion as well as armed confl ict, land degradaurbaniza-tion, and drought, migraurbaniza-tion in the region played and still plays a major part in shaping settlement patterns. At the political level, several initiatives, including the free movement of people insti-tutionalized by the Economic Community of West African States (ECOWAS), have facilitated labor migration. With this background in mind, this chapter examines the locational choice of a large sample of Africans originating in seven cities in the West African Economic and Monetary Union (WAEMU).1
Concern with migration emerged with the work of Sjaastad (1962). In the development literature, however, Todaro (1969) and Harris and Todaro (1970) were the fi rst to present a model in which the decision to migrate results from the rational comparison of the expected costs and benefi ts of migration. In both models, the diff erence in average expected earnings between countries or regions of destination and countries or regions of origin plays a key role and is predicted to have a positive eff ect on migration fl ows. Th is kind of model is unable to explain key stylized facts, however, such as migration fl ows from and to particular regions or countries.
Borjas (1987) and Dahl (2002) adopt a diff erent approach, based on the semi-nal paper of Roy (1951). In Roy’s framework, workers select into income-earning
302 URBAN LABOR MARKETS IN SUB-SAHARAN AFRICA
activities on the basis of their comparative advantage. Applied to residential choice, this model explains migration not by average expected earnings diff er-entials but rather by diff erences in individual expected returns to skills that are either observed or unobserved by the econometrician. As a result, migration fl ows are not necessarily one-sided. Th is literature argues that migrants’ self-selection should be taken into account when estimating the returns to human capital in countries where the fl ow of migrants is signifi cant.
Estimation of this kind of model is usually very diffi cult, however, because of the impossibility of gathering data on origin and destination labor markets at the same time. In this chapter, we take advantage of the fact that the 1-2-3 surveys of the Programme d’Appui Régional à la Statistique (PARSTAT) project were conducted simultaneously, with the same questionnaire, thus providing the data needed to study migration choices in the region (for a description of these surveys, see box O.1 in the overview). Data on the country of birth and the last country of residence allow international migrants to be identifi ed within each national sample.
Th is chapter is important for three reasons. First, it fi lls a gap in the knowl-edge of cross-border migration within Africa. Second, it evaluates the extent of the bias in the estimated returns to education when international migration is not accounted for. Th ird, it determines whether earnings diff erentials matter in the choice of the country of residence.
Th e model assumes that individuals are born randomly in one of the seven countries under review (Benin, Burkina Faso, Côte d’Ivoire, Mali, Niger, Senegal, and Togo) but rationally choose the country in which they reside by comparing the utility associated with each choice. Estimation of this model provides unbi-ased estimates of the returns to education, together with the eff ect of expected earnings diff erentials on the probability of choosing a particular country. Given the data at hand, the universe of destination countries is restricted to countries that are close to one another geographically, legally, culturally, and economically. Th e seven countries studied share the same language (French), use a common currency (the CFA franc), and, most important, belong to ECOWAS, within which people are free to move and settle.
We cannot account for migration movements outside the WAEMU region. Although this restriction is regrettable and constitutes a clear limitation of our study, it nevertheless makes sense to analyze migrants’ choice of destination in West Africa, where there are no legal barriers to migrate and most international migration takes place intraregionally. We fi nd that migration behavior plays an important role in determining earnings diff erentials between countries and between individuals with diff erent education levels. Our results also suggest that earnings diff erentials matter in locational choice.
Th is chapter is organized as follows. Th e fi rst section presents the data and some descriptive statistics. Th e second section specifi es the model and describes
WHY DO MIGRANTS MIGRATE? 303
the estimation strategy. Th e third section discusses the model identifi cation and the choice of variables. Th e fourth section provides the estimation results. Th e last section summarizes the chapter’s main conclusions.
Data and Descriptive Statistics
Movements of labor are not a new phenomenon in West Africa. For genera-tions, people have migrated in response to demographic, economic, political, and other factors, such as population pressure, environmental disasters, pov-erty, and confl icts.
Despite their importance, little is known about these migrations. Th e infor-mation provided by census data; immigration and emigration statistics; and a small number of ad hoc surveys on the number, identity, and motivations of both inter- and intracontinental African migrants is spotty and unreliable. Evidence is even scarcer concerning transborder migrations within the West African subregion. How many transborder migrants are there in each West African country? Who are these migrants? What are their main motivations? Th ese are some of the questions this chapter addresses.
Th e data used are a pooling sample of the seven 1-2-3 surveys of the PAR-STAT project. All seven French-speaking members of WAEMU belong to ECOWAS. At the time of its creation, in 1975, one of the key objectives of ECOWAS was to remove obstacles to the free movement of goods, capital, and people in the subregion. In line with this objective, the Protocol on Free Move-ment of Persons and the Right of Residence and EstablishMove-ment was signed in May 1979; the right of entry was established in 1980 and the right of residence in 1986. In 2000, members of ECOWAS agreed to introduce a new passport for citizens of the subregion, which will gradually replace national passports. Although much remains to be done to achieve complete liberalization of labor migration within the community, these measures to create a borderless West Africa provide a good opportunity to study the residential choice of people within the community.
We consider as migrants all individuals who meet the following three cri-teria: they are not citizens of the country they reside in; they were not born in the capital city of the country they reside in; and they have not been resid-ing continuously in the capital city since they were born.2 Individuals who are not migrants are considered natives. In the empirical analysis that follows, we restrict the sample to all active individuals 15–65 originating in one of the seven countries covered by the 1-2-3 surveys and residing in the capital city of one of these countries, either as natives or immigrants.
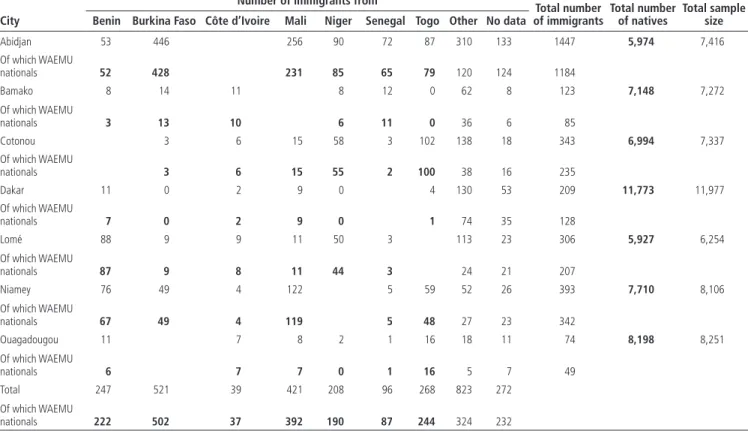
As the fi gures in table 10.1 suggest, a wide variety of migration confi gurations is evident within WAEMU. Despite the severe sociopolitical crisis that started
304
Table 10.1 Composition of Samples Used to Analyze Migration in West Africa, 2001/02
City
Number of immigrants from
Total number of immigrants Total number of natives Total sample size Benin Burkina Faso Côte d’Ivoire Mali Niger Senegal Togo Other No data
Abidjan 53 446 256 90 72 87 310 133 1447 5,974 7,416 Of which WAEMU nationals 52 428 231 85 65 79 120 124 1184 Bamako 8 14 11 8 12 0 62 8 123 7,148 7,272 Of which WAEMU nationals 3 13 10 6 11 0 36 6 85 Cotonou 3 6 15 58 3 102 138 18 343 6,994 7,337 Of which WAEMU nationals 3 6 15 55 2 100 38 16 235 Dakar 11 0 2 9 0 4 130 53 209 11,773 11,977 Of which WAEMU nationals 7 0 2 9 0 1 74 35 128 Lomé 88 9 9 11 50 3 113 23 306 5,927 6,254 Of which WAEMU nationals 87 9 8 11 44 3 24 21 207 Niamey 76 49 4 122 5 59 52 26 393 7,710 8,106 Of which WAEMU nationals 67 49 4 119 5 48 27 23 342 Ouagadougou 11 7 8 2 1 16 18 11 74 8,198 8,251 Of which WAEMU nationals 6 7 7 0 1 16 5 7 49 Total 247 521 39 421 208 96 268 823 272 Of which WAEMU nationals 222 502 37 392 190 87 244 324 232
Sources: Based on Phase 1 of the 1-2-3 surveys of selected countries in the West African Economic and Monetary Union (WAEMU) conducted in 2001/02 by the Observatoire économique et statistique d’Afrique Subsaharienne (AFRISTAT); Développement, Institutions et Mondialisation (DIAL); and national statistics institutes.
Note: All individuals 15–65 are considered as natives of country i if they always resided in country i, whether or not they identify themselves as citizens. Within the sample of immigrants coming from one of the six other WAEMU countries, some are not WAEMU nationals (for example, a French national who spent 10 years in Burkina Faso before moving to Benin is recorded as a migrant coming from Burkina Faso but is not Burkinabe). Groups considered in the analysis are in bold. WAEMU = West African Economic and Monetary Union.
WHY DO MIGRANTS MIGRATE? 305
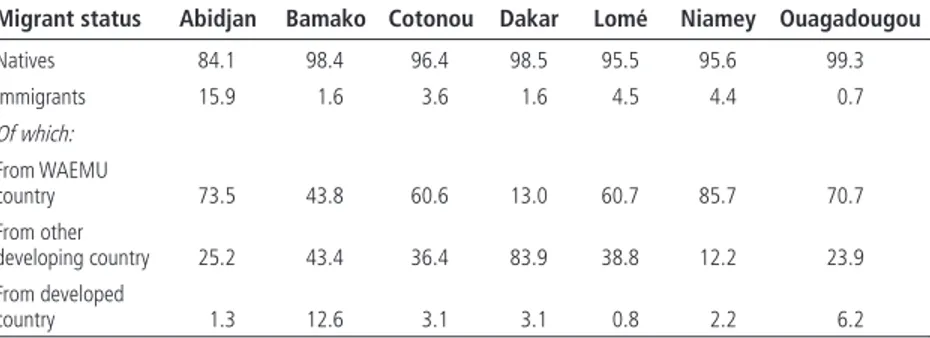
with the military coup of 1999 and resulted in reverse fl ows of migrants, Côte d’Ivoire is still by far the most important immigration country in the WAEMU region.3 Although migration fl ows from Burkina Faso and Mali have been fl uc-tuating since the beginning of the crisis, these two neighboring countries remain the main source of migrants to Côte d’Ivoire. About 15 percent of Abidjan’s popu-lation between 15 and 65 are immigrants, among which 74 percent are citizens of a WAEMU country (table 10.2).
By contrast, immigrants from bordering WAEMU countries account for only a marginal share of the population in Dakar, the capital of Senegal. Less than 2 percent of Dakar’s inhabitants are non-Senegalese, among which a large share comes from Guinea, Guinea-Bissau, Th e Gambia, Mauritania, or Mali. Expa-triates from Mali and Burkina Faso and living in the capital city of a WAEMU country largely outnumber the expatriates from WAEMU countries residing in Bamako or Ouagadougou, suggesting that the two countries remain major labor-exporting countries. By contrast, Benin, Niger, and Togo combine both emigration and immigration.
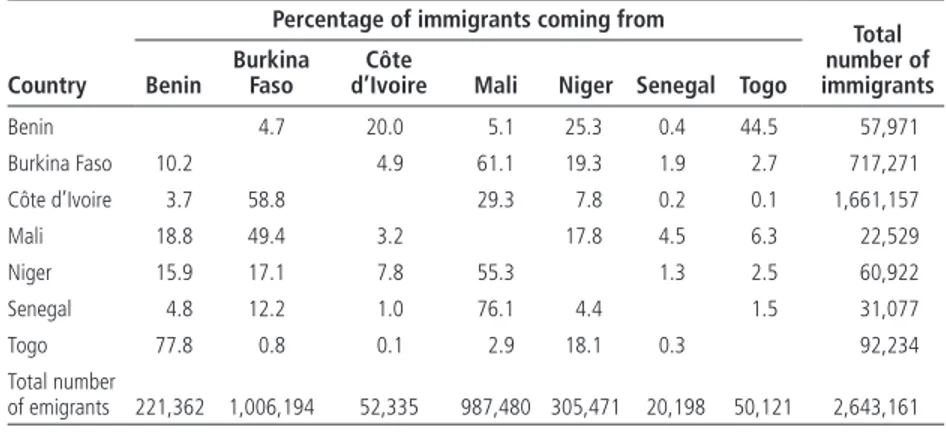
Table 10.3 reports census statistics on immigrants by country of origin in each of the seven countries studied. Overall, the same general migration pat-terns emerge: national data confi rm the position of Côte d’Ivoire as the main labor-importing country of the region, with most migrants coming from Mali or Burkina Faso. Th ey also confi rm the marginal participation of Senegal in intraregional migration fl ows and the role of Benin, Niger, and Togo as both importers and exporters of labor. Th e picture for Burkina Faso, however, strongly diff ers from the one drawn based on data from Ouagadougou only. Rural Burkina Faso is indeed found to host a fairly large number of Malian migrants, who are not accounted for in our urban sample. Our inferences for Burkina Faso using data on Ouagadougou should thus be considered with caution.
Table 10.2 Weighted Shares of Immigrants among Urban Residents in Seven Cities in West Africa, 2001/02
(percent)
Migrant status Abidjan Bamako Cotonou Dakar Lomé Niamey Ouagadougou
Natives 84.1 98.4 96.4 98.5 95.5 95.6 99.3 Immigrants 15.9 1.6 3.6 1.6 4.5 4.4 0.7 Of which: From WAEMU country 73.5 43.8 60.6 13.0 60.7 85.7 70.7 From other developing country 25.2 43.4 36.4 83.9 38.8 12.2 23.9 From developed country 1.3 12.6 3.1 3.1 0.8 2.2 6.2
Sources: Based on Phase 1 of the 1-2-3 surveys of selected countries (see table 10.1 for details).
306 URBAN LABOR MARKETS IN SUB-SAHARAN AFRICA
Representativeness of Sample
It is likely that the migrants’ samples from the 1-2-3 surveys are not representa-tive of the whole population of migrants, because they exclude individuals who moved out of their country to settle in a rural area of another WAEMU country. Th ese migrants may strongly diff er from the migrants recorded in our samples, especially with regard to their distribution by country of origin.
Another issue possibly aff ecting the representativeness of our samples relates to the fact that immigrants are a relatively small share of the population and may cluster in some areas. Given the sampling frame of the 1-2-3 surveys, it is possible that such areas were missed when the census sectors were selected in the fi rst stage. Th is possibility cannot be ruled out in some cities.
We believe our samples are representative in Abidjan, Bamako, and Lomé. In Lomé, where 125 of 129 census sectors were selected, the probability that we missed clusters of migrants is low. In Abidjan and Bamako, our estimates on the immigration rate at the level of the city and on the composition of migrants’ stocks by country of origin are very similar to the estimates obtained using census data. In addition, we used our representative samples of census sectors in each city to test the null hypothesis of random allocation of migrants across neighborhoods and rejected it in none of our samples. For other countries, the representativeness of the sample can be questioned.
Migrants’ Main Characteristics
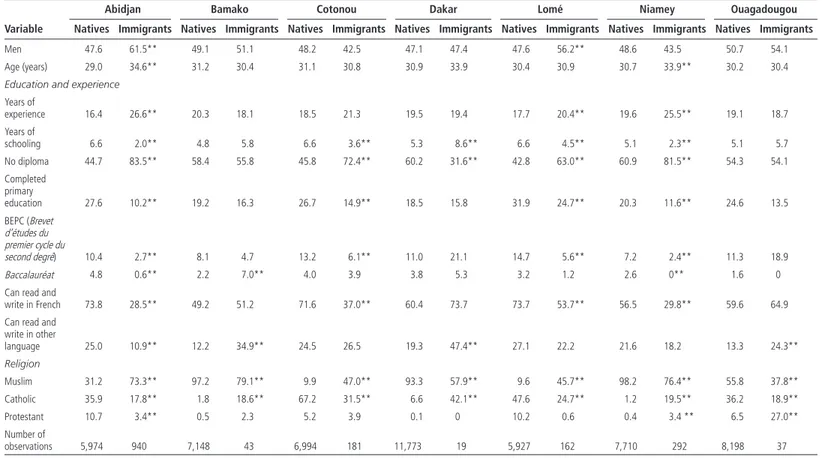
Table 10.4 provides descriptive statistics on the main characteristics of natives and immigrants by city of residence. Several fi ndings are worthy of note. First, women are underrepresented in the immigrant populations of Abidjan, Ouagadougou, and Lomé but slightly overrepresented among the Table 10.3 Composition of Migrant Population in Seven Countries in West Africa, 2000
Country
Percentage of immigrants coming from
Total number of immigrants Benin Burkina Faso Côte
d’Ivoire Mali Niger Senegal Togo
Benin 4.7 20.0 5.1 25.3 0.4 44.5 57,971 Burkina Faso 10.2 4.9 61.1 19.3 1.9 2.7 717,271 Côte d’Ivoire 3.7 58.8 29.3 7.8 0.2 0.1 1,661,157 Mali 18.8 49.4 3.2 17.8 4.5 6.3 22,529 Niger 15.9 17.1 7.8 55.3 1.3 2.5 60,922 Senegal 4.8 12.2 1.0 76.1 4.4 1.5 31,077 Togo 77.8 0.8 0.1 2.9 18.1 0.3 92,234 Total number of emigrants 221,362 1,006,194 52,335 987,480 305,471 20,198 50,121 2,643,161 Source: National census data circa 2000.
307
Table 10.4 Mean Characteristics of Natives and Immigrants in Seven Cities in West Africa, 2001/02
(percent, except where otherwise indicated)
Variable
Abidjan Bamako Cotonou Dakar Lomé Niamey Ouagadougou
Natives Immigrants Natives Immigrants Natives Immigrants Natives Immigrants Natives Immigrants Natives Immigrants Natives Immigrants
Men 47.6 61.5** 49.1 51.1 48.2 42.5 47.1 47.4 47.6 56.2** 48.6 43.5 50.7 54.1
Age (years) 29.0 34.6** 31.2 30.4 31.1 30.8 30.9 33.9 30.4 30.9 30.7 33.9** 30.2 30.4
Education and experience
Years of experience 16.4 26.6** 20.3 18.1 18.5 21.3 19.5 19.4 17.7 20.4** 19.6 25.5** 19.1 18.7 Years of schooling 6.6 2.0** 4.8 5.8 6.6 3.6** 5.3 8.6** 6.6 4.5** 5.1 2.3** 5.1 5.7 No diploma 44.7 83.5** 58.4 55.8 45.8 72.4** 60.2 31.6** 42.8 63.0** 60.9 81.5** 54.3 54.1 Completed primary education 27.6 10.2** 19.2 16.3 26.7 14.9** 18.5 15.8 31.9 24.7** 20.3 11.6** 24.6 13.5 BEPC (Brevet d’études du premier cycle du second degré) 10.4 2.7** 8.1 4.7 13.2 6.1** 11.0 21.1 14.7 5.6** 7.2 2.4** 11.3 18.9 Baccalauréat 4.8 0.6** 2.2 7.0** 4.0 3.9 3.8 5.3 3.2 1.2 2.6 0** 1.6 0
Can read and
write in French 73.8 28.5** 49.2 51.2 71.6 37.0** 60.4 73.7 73.7 53.7** 56.5 29.8** 59.6 64.9 Can read and
write in other language 25.0 10.9** 12.2 34.9** 24.5 26.5 19.3 47.4** 27.1 22.2 21.6 18.2 13.3 24.3** Religion Muslim 31.2 73.3** 97.2 79.1** 9.9 47.0** 93.3 57.9** 9.6 45.7** 98.2 76.4** 55.8 37.8** Catholic 35.9 17.8** 1.8 18.6** 67.2 31.5** 6.6 42.1** 47.6 24.7** 1.2 19.5** 36.2 18.9** Protestant 10.7 3.4** 0.5 2.3 5.2 3.9 0.1 0 10.2 0.6 0.4 3.4 ** 6.5 27.0** Number of observations 5,974 940 7,148 43 6,994 181 11,773 19 5,927 162 7,710 292 8,198 37
Sources: Based on Phase 1 of the 1-2-3 surveys of selected countries (see table 10.1 for details).
308 URBAN LABOR MARKETS IN SUB-SAHARAN AFRICA
immigrant populations of Cotonou and Niamey. Traditional male-dominated short- to long-distance migratory streams in West Africa are thus becom-ing feminized, suggestbecom-ing a turnaround in traditional gender roles. Second, immigrants are signifi cantly older than natives in Abidjan, and Niamey but roughly of the same age as natives in the other cities. Th ird, immigrants appear to be less educated on average than natives in four cities (Abidjan, Cotonou, Lomé, and Niamey). Th e education gap is particularly large in Abidjan, where immigrants have 2.0 years of schooling on average against 6.6 years for natives.
Th e statistics for natives were computed using data collected in capital cit-ies only. Some of them are thus likely to be bad proxcit-ies for the situation at the national level (mean education levels, for example, are generally much higher in urban areas than in rural ones). It should consequently come as no surprise that immigrants in Abidjan, Cotonou, Lomé, and Niamey (a majority of whom may come from rural areas) are on average less educated than nationals in these cit-ies. Th e fact that in Bamako, Dakar, and Ouagadougou, immigrants appear to be more educated on average than natives suggests that these cities attract mainly educated people or people from urban areas. Because of the small sample size, however, the fi gure for Dakar should be taken with caution.
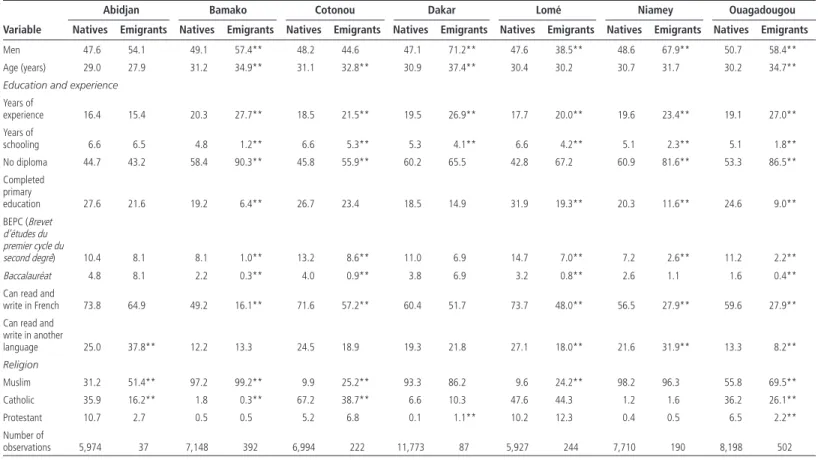
As a complement to table 10.4, table 10.5 provides some descriptive statistics on the main characteristics of natives (“stayers”) and emigrants (“movers”), by country of origin. In all countries except Togo and, to a lesser extent, Benin, men are overrepresented in the emigrant population. Intraregional migratory fl ows from these two countries are motivated mostly by commercial purposes and have traditionally been dominated by women. In terms of education, emigrants appear much less educated than nonmigrant natives in all countries, suggesting that migration fl ows within the WAEMU region mainly involve low-qualifi ed workers. Migrants’ Employment Status
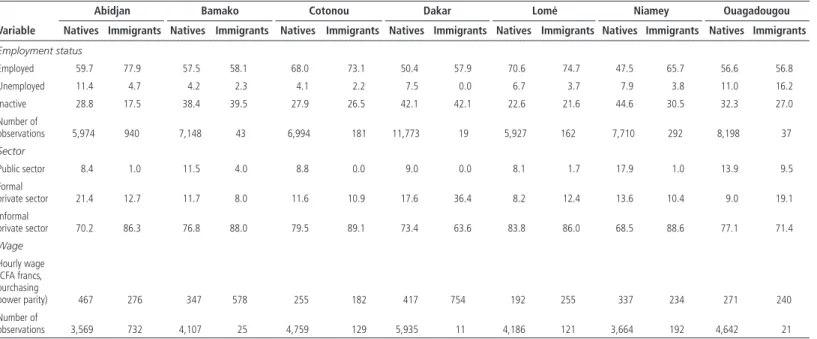
On average, labor force participation is higher for immigrants than for natives.4 Th e diff erence is particularly large in Abidjan and Niamey, suggesting that migration streams to these cities are motivated mainly by labor market consid-erations. Given the individual characteristics of immigrants, particularly with respect to their level of education, one would expect their employment situation to be less favorable than that of natives in Abidjan, Cotonou, Lomé, and Niamey and more favorable in Dakar. In developing economies, formal wage workers in the public or private sector are considered to have a favorable employment situ-ation; informal sector workers are considered to have an unfavorable situation.
Th e fi gures in table 10.6 indicate that this is indeed the case. Th e percentage of immigrants working in the informal sector is much higher than the percent-age of natives in Abidjan, Bamako, Cotonou, Lomé, and Niamey; it is lower in Dakar and Ouagadougou.
309
Table 10.5 Mean Characteristics of Natives and Emigrants in Seven Cities in West Africa, 2001/02
(percent, except where otherwise indicated)
Variable
Abidjan Bamako Cotonou Dakar Lomé Niamey Ouagadougou
Natives Emigrants Natives Emigrants Natives Emigrants Natives Emigrants Natives Emigrants Natives Emigrants Natives Emigrants
Men 47.6 54.1 49.1 57.4** 48.2 44.6 47.1 71.2** 47.6 38.5** 48.6 67.9** 50.7 58.4**
Age (years) 29.0 27.9 31.2 34.9** 31.1 32.8** 30.9 37.4** 30.4 30.2 30.7 31.7 30.2 34.7**
Education and experience
Years of experience 16.4 15.4 20.3 27.7** 18.5 21.5** 19.5 26.9** 17.7 20.0** 19.6 23.4** 19.1 27.0** Years of schooling 6.6 6.5 4.8 1.2** 6.6 5.3** 5.3 4.1** 6.6 4.2** 5.1 2.3** 5.1 1.8** No diploma 44.7 43.2 58.4 90.3** 45.8 55.9** 60.2 65.5 42.8 67.2 60.9 81.6** 53.3 86.5** Completed primary education 27.6 21.6 19.2 6.4** 26.7 23.4 18.5 14.9 31.9 19.3** 20.3 11.6** 24.6 9.0** BEPC (Brevet d’études du premier cycle du second degré) 10.4 8.1 8.1 1.0** 13.2 8.6** 11.0 6.9 14.7 7.0** 7.2 2.6** 11.2 2.2** Baccalauréat 4.8 8.1 2.2 0.3** 4.0 0.9** 3.8 6.9 3.2 0.8** 2.6 1.1 1.6 0.4**
Can read and
write in French 73.8 64.9 49.2 16.1** 71.6 57.2** 60.4 51.7 73.7 48.0** 56.5 27.9** 59.6 27.9**
Can read and write in another language 25.0 37.8** 12.2 13.3 24.5 18.9 19.3 21.8 27.1 18.0** 21.6 31.9** 13.3 8.2** Religion Muslim 31.2 51.4** 97.2 99.2** 9.9 25.2** 93.3 86.2 9.6 24.2** 98.2 96.3 55.8 69.5** Catholic 35.9 16.2** 1.8 0.3** 67.2 38.7** 6.6 10.3 47.6 44.3 1.2 1.6 36.2 26.1** Protestant 10.7 2.7 0.5 0.5 5.2 6.8 0.1 1.1** 10.2 12.3 0.4 0.5 6.5 2.2** Number of observations 5,974 37 7,148 392 6,994 222 11,773 87 5,927 244 7,710 190 8,198 502
Sources: Based on Phase 1 of the 1-2-3 surveys of selected countries (see table 10.1 for details).
310
Table 10.6 Employment Situation of Natives and Immigrants in Seven Cities in West Africa, 2001/02
(percent except where otherwise indicated)
Variable
Abidjan Bamako Cotonou Dakar Lomé Niamey Ouagadougou
Natives Immigrants Natives Immigrants Natives Immigrants Natives Immigrants Natives Immigrants Natives Immigrants Natives Immigrants Employment status Employed 59.7 77.9 57.5 58.1 68.0 73.1 50.4 57.9 70.6 74.7 47.5 65.7 56.6 56.8 Unemployed 11.4 4.7 4.2 2.3 4.1 2.2 7.5 0.0 6.7 3.7 7.9 3.8 11.0 16.2 Inactive 28.8 17.5 38.4 39.5 27.9 26.5 42.1 42.1 22.6 21.6 44.6 30.5 32.3 27.0 Number of observations 5,974 940 7,148 43 6,994 181 11,773 19 5,927 162 7,710 292 8,198 37 Sector Public sector 8.4 1.0 11.5 4.0 8.8 0.0 9.0 0.0 8.1 1.7 17.9 1.0 13.9 9.5 Formal private sector 21.4 12.7 11.7 8.0 11.6 10.9 17.6 36.4 8.2 12.4 13.6 10.4 9.0 19.1 Informal private sector 70.2 86.3 76.8 88.0 79.5 89.1 73.4 63.6 83.8 86.0 68.5 88.6 77.1 71.4 Wage Hourly wage (CFA francs, purchasing power parity) 467 276 347 578 255 182 417 754 192 255 337 234 271 240 Number of observations 3,569 732 4,107 25 4,759 129 5,935 11 4,186 121 3,664 192 4,642 21
WHY DO MIGRANTS MIGRATE? 311
Average hourly earnings follow roughly the same pattern. Compared with natives, immigrants earn much lower hourly wages in Abidjan (–41 percent), Niamey (–30 percent), and Cotonou (–29 percent); they earn much higher hourly wages in Dakar (91 percent), Bamako (67 percent), and Lomé (33 per-cent).5 Lomé is an anomaly: although immigrants are less educated on average and more concentrated in the informal sector, they earn signifi cantly higher hourly wages than natives.
Model Specifi cation and Estimation Strategy
We take advantage of the simultaneity and strict comparability of the 1-2-3 surveys to evaluate the impact of hourly wage diff erences in the seven cities on individuals’ residential choice. Th e econometric estimation is performed in three steps. First, using the pooled sample of 31,647 individuals observed in the seven cities, we estimate the determinants of individual residential choice, assuming that it refl ects comparison of the hourly wage that can be obtained in each destination city, together with other variables. More precisely, we assume that each individual i born in country j and living in city k derives utility from its choice of residence, written as
ui(j,k) = α.lnyik + zʹifk + vi(j,k) (10.1)
with lnyik the logarithm of individual i hourly earnings in city k, and zi a vector
of individual characteristics, such as religion. Individual i prefers to live in city k if doing so yields the highest utility:
ui(j,k) – c(j,k) ≥ ui(j,l) – c(j,l) for all l (10.2)
where c(j, k) is the cost of settling in city k when born in country j.6 Th ese costs cannot be observed. In the econometric estimation of the model, we use nation-ality dummies to account for them, assuming that individuals originating from the same country face the same level of costs.
As individual hourly wages are observed only in the city of residence, equa-tion (10.1) is estimated in a reduced form, obtained by replacing the logarithm of wage by a linear combination of its determinants:
ui(j,k) = α (xʹik ak) + zʹifk + ei(j,k) (10.3)
Under appropriate assumptions on the distribution of the error term, this model can be estimated as a multinomial logit. Th e estimated coeffi cients can then be used to predict individual probabilities of residing in a given city.
312 URBAN LABOR MARKETS IN SUB-SAHARAN AFRICA
Second, we use the predicted probabilities computed in the fi rst step to cor-rect for the self-selection of migrants in the hourly wage equation:
lnyik = xʹik.ak + uik. (10.4)
Holding account of migrants’ self-selection is necessary because migrants could share some unobservable characteristics (such as motivation) that could be correlated with other observable determinants of wages (such as education). Following Dahl (2002), we correct for self-selection by adding to the wage equa-tion a polynomial funcequa-tion of the choice probabilities computed in the fi rst step as a control for unobserved characteristics that would otherwise bias the estimates.
Th ird, we use hourly wages estimated for each individual in each country to evaluate the impact of expected wage diff erences on the probabilities of choice (that is, the value of coeffi cient α in equation [10.1]).
Model Identifi cation and Choice of Variables
In order to be identifi ed, our model relies on various assumptions, which need to be properly tested. In particular, in the second step of our procedure, in which we correct for individuals’ self-selection, it is important to include one or more variables that explain locational choice (that is, enter the fi rst-stage equation) but do not infl uence earnings. In what follows, we use dummies indi-cating whether the individual’s father did not go to school or was absent when the individual was 15, together with dummies for the individual’s religion and nationality, as identifying variables. Religion is likely to have an infl uence on destination choice, given that the dominant religion is diff erent in diff erent cit-ies. Nationality dummies are included to account for macro-level variables, such as average gross domestic product per capita, mortality rates, and the shares of immigrants from ECOWAS countries in the city’s population. Th ese variables also capture migration costs between the origin country and destination city.
Any one of these exclusion restrictions could be violated. For example, if there is discrimination against people of a particular nationality or religion in a particular destination city, these variables would infl uence earnings. If the quality of education is diff erent for people from diff erent countries, nationality could also infl uence earnings by aff ecting schooling diff erences. We believe dis-crimination on the basis of nationality or religion to be second-order concerns within the cities of our sample, and there is evidence that the quality of school-ing does not diff er dramatically across countries of origin.7
It could also be argued that father’s education and father’s presence in the household when individuals are 15 are correlated with household wealth, which
WHY DO MIGRANTS MIGRATE? 313
aff ects occupational choice and earnings. However, overidentifi cation tests do not reject the null hypothesis of zero correlation between our instruments and the principal equation error terms in fi ve of seven cities.
In the third stage of our procedure, identifi cation of the log-earnings coef-fi cient in the structural model of residential choice depends on the exclusion from equation (10.1) of at least one variable that enters in the log-earnings equation (10.3). We assume that gender, education, and employment sec-tor explain log-hourly earnings but not residential choice, once earnings are accounted for. Th ere are some good reasons why education might determine residential choice, apart from its impact on potential earnings. One possibil-ity is that well-educated individuals prefer cities in which the average level of education is high, not only because their own wages are more likely to be higher but also because they will benefi t from positive externalities related to the high average level of education (such as a richer supply of cultural goods). In our sample, however, movers appear much less educated on average than stayers, in both origin countries’ capitals and destination cities. We therefore believe this incentive to be low.
It could also be argued that people moving abroad experience a loss in utility because of the remoteness of their home country, extended family, and friends. Th is loss could induce a direct eff ect of the gender variable on locational choice, in addi-tion to its indirect eff ect through earnings, if men (women) experience a greater loss than women (men). However, it is not clear whether the diff erence between men and women in this utility loss should be large, as both rely on networks of family and friends and may have similar preferences to remain in their home country.
Excluding the employment sector from the locational choice decision does not seem too heroic an assumption given the strong similarities in the structure of urban labor markets (and in the share of public versus private and formal versus informal jobs in particular) in the seven cities.
In the earnings equation, the dependent variable is the logarithm of total hourly earnings in CFA francs. All earnings are expressed in purchasing power parity (PPP). Th e conversion to PPP CFA francs is necessary in the third step of our estimation, where expected earnings in the seven cities are allowed to infl u-ence the probability of choice.8 Independent variables in the earnings equations are gender, education (as measured by the last diploma obtained), potential labor market experience and its square, the ability to speak French, the ability to speak another foreign language, dummies for the public or private formal sectors, and a series of dummies for the father’s activity when the individual was 15. Th is last set of variables is included both as a determinant of migration behavior and as a proxy for the individual’s sector choice, to account for earn-ings diff erentials between sectors. Th e reduced-form multinomial logit model includes these variables, together with dummies for the individual’s religion and nationality.
314 URBAN LABOR MARKETS IN SUB-SAHARAN AFRICA
As our estimation strategy is a multistep procedure, we bootstrapped the entire process with 50 replications. Bootstrapped standard errors were used for hypothesis testing.
Estimation Results
We fi rst present the results of the multinomial logit model before turning to the earnings equations and the structural model of residential choice. Th e section ends with some robustness checks.
Reduced-Form Multinomial Logit of Residential Choice
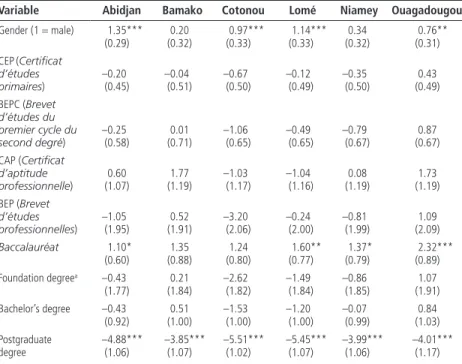
Tables 10.7–10.9 present the estimation results. Table 10.7 shows the results of the reduced-form multinomial logit estimation. Th ese results are diffi cult to comment on, because only the diff erences in the coeffi cients with respect to the reference city (Dakar) can be identifi ed. Th us, for instance, the positive coef-fi cient of the gender variable in the equation for Cotonou indicates that being Table 10.7 Reduced-Form Multinomial Logit Estimates of Individual Residential Choice in Seven Cities in West Africa, 2001/02
Variable Abidjan Bamako Cotonou Lomé Niamey Ouagadougou
Gender (1 = male) 1.35*** 0.20 0.97*** 1.14*** 0.34 0.76**
(0.29) (0.32) (0.33) (0.33) (0.32) (0.31)
CEP(Certifi cat d’études primaires) –0.20 (0.45) –0.04 (0.51) –0.67 (0.50) –0.12 (0.49) –0.35 (0.50) 0.43 (0.49) BEPC (Brevet d’études du premier cycle du second degré) –0.25 (0.58) 0.01 (0.71) –1.06 (0.65) –0.49 (0.65) –0.79 (0.67) 0.87 (0.67) CAP (Certifi cat
d’aptitude professionnelle) 0.60 (1.07) 1.77 (1.19) –1.03 (1.17) –1.04 (1.16) 0.08 (1.19) 1.73 (1.19) BEP (Brevet d’études professionnelles) –1.05 (1.95) 0.52 (1.91) –3.20 (2.06) –0.24 (2.00) –0.81 (1.99) 1.09 (2.09) Baccalauréat 1.10* 1.35 1.24 1.60** 1.37* 2.32*** (0.60) (0.88) (0.80) (0.77) (0.79) (0.89) Foundation degreea –0.43 0.21 –2.62 –1.49 –0.86 1.07 (1.77) (1.84) (1.82) (1.84) (1.85) (1.91) Bachelor’s degree –0.43 0.51 –1.53 –1.20 –0.07 0.84 (0.92) (1.00) (1.00) (1.00) (0.99) (1.03) Postgraduate degree –4.88*** –3.85*** –5.51*** –5.45*** –3.99*** –4.01*** (1.06) (1.07) (1.02) (1.07) (1.06) (1.17)
WHY DO MIGRANTS MIGRATE? 315 Marital status (1 = married) –0.83*** –0.08 –0.34 –0.45 –0.42 –0.65** (0.30) (0.33) (0.35) (0.34) (0.34) (0.33) Speaks French (1 = yes) –0.29 –0.05 –0.16 0.22 0.22 –0.08 (0.34) (0.39) (0.40) (0.39) (0.39) (0.37) Speaks another language (1 = yes) 0.20 –0.08 1.19*** 1.06*** 0.23 0.07 (0.35) (0.39) (0.41) (0.41) (0.40) (0.41) Experience (years) 0.16*** –0.04 0.04 0.04 0.08* 0.03 (0.04) (0.05) (0.04) (0.05) (0.05) (0.05) Experience squared –0.002*** 0.00 –0.00 –0.00 –0.00 –0.00 (0.00) (0.00) (0.00) (0.00) (0.00) (0.00) Public sector –1.60*** 0.26 –0.18 –0.29 –0.16 0.52 (0.59) (0.63) (0.63) (0.62) (0.62) (0.66) Private sector –0.17 0.28 0.14 –0.24 0.19 –0.84** (0.35) (0.39) (0.42) (0.41) (0.40) (0.38) Father in agricultural sector 0.72** –0.41 0.12 0.20 –0.02 –0.07 (0.35) (0.38) (0.39) (0.39) (0.38) (0.38) Father in industrial sector –0.05 –0.52 –0.85 –0.68 –0.40 –0.80 (0.52) (0.60) (0.60) (0.60) (0.60) (0.62) Father in commercial sector 1.38*** 0.97** 0.81 1.15** 0.63 1.20*** (0.35) (0.42) (0.43) (0.43) (0.41) (0.41)
Father was senior executive
1.20** 1.27* 0.34 0.67 1.07 1.99**
(0.59) (0.73) (0.72) (0.72) (0.73) (0.79)
Father was midlevel executive
0.02 0.61 0.48 –0.08 0.61 0.22
(0.58) (0.65) (0.64) (0.63) (0.64) (0.66)
Father was absent at age 15
1.01** 0.69 1.47*** 1.14** 0.63 0.35
(0.48) (0.53) (0.54) (0.54) (0.53) (0.53)
Father never went to school –0.59* –0.69* –0.56 –0.91** 0.10 0.31 (0.34) (0.38) (0.37) (0.37) (0.38) (0.37) Father schooling missing –4.62*** –2.79*** –7.09*** –3.75*** –3.05*** –3.72*** (0.65) (0.65) (0.77) (0.70) (0.68) (0.69) Muslim –5.74*** –5.72*** –6.00*** –6.88*** –3.18* –5.55*** (1.78) (1.84) (1.80) (1.79) (1.84) (1.82) Catholic –4.97*** –4.97** –4.15** –5.37*** –3.20* –4.57** (1.80) (1.88) (1.82) (1.81) (1.86) (1.84) Protestant –1.93 –2.65 –2.47 –3.39 –0.83 –0.92 (2.15) (2.25) (2.17) (2.16) (2.22) (2.19) Intercept –1.62 –0.92 –3.98*** –2.35*** –6.01*** –4.83** (1.94) (2.03) (2.21) (2.03) (2.10) (2.23) Number of observations 31,647 31,647 31,647 31,647 31,647 31,647
Sources: Based on Phase 1 of the 1-2-3 surveys of selected countries (see table 10.1 for details).
Note: The dependent variable takes the value 1 (Cotonou) to 7 (Lomé), with 6 (Dakar) used as the comparison category. Nationality dummies were included but are not shown. Figures in parentheses are standard errors. University system derives from the French system, in which, until recently, second-year students could receive a diploma. This diploma is referred to here as the foundation degree.
* significant at the 10 percent level, ** significant at the 5 percent level, *** significant at the 1 percent level.
Table 10.7 (continued)
316 URBAN LABOR MARKETS IN SUB-SAHARAN AFRICA
male has a larger eff ect on the utility resulting from choosing Cotonou than the utility resulting from choosing Dakar. Th e results suggest that, among the seven cities under review, holding a postgraduate degree or being Muslim or Catholic increases the utility of living in Dakar more than the utility of living in any other city. By contrast, holding a baccalauréat degree increases the utility of residing in Abidjan, Niamey, Ouagadougou, or Lomé by much more than that of residing in Dakar. Unsurprisingly, being of Senegalese nationality increases the utility of living in Dakar much more than that of living in any other city except Bamako, where the coeffi cient is insignifi cant (results not shown). Earnings Equation
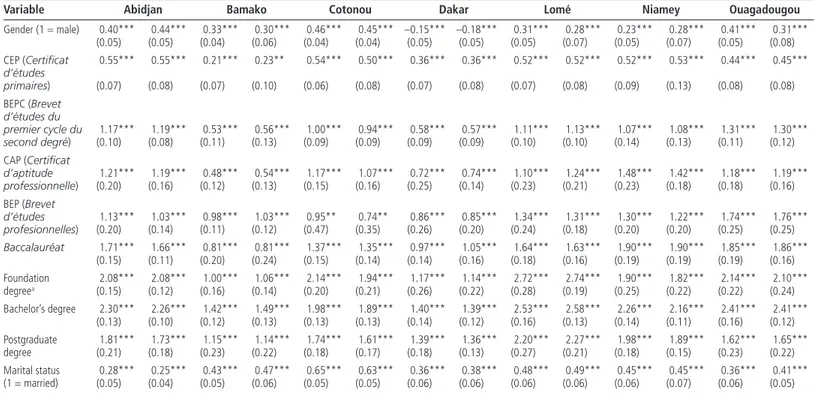
Following Dahl (2002), we use the estimated coeffi cients of the reduced-form multinomial logit to compute, for each observation of the sample, a polynomial of choice probabilities that was added to the set of explanatory variables in the earnings equations. Table 10.8 presents the ordinary least squares regression results. As the coeffi cients of the polynomials of the selection probabilities have no interpretation, we limit the presentation to the coeffi cients of the variables that have a direct interpretation.
Th e fi rst column shows the estimated coeffi cients when no correction for endogenous selection is made. Th e second column presents the corrected coeffi cients. Th e results of a series of Wald tests are shown at the bottom of the table.
We computed several test statistics. First, we tested whether the selection correction terms enter the earnings equation signifi cantly. Second, we tested the hypothesis that the excluded variables (father, religion, and nationality dum-mies) make no signifi cant contribution to the explanation of the dependent variable.
Tests confi rm that the model is correctly identifi ed. With the exception of Bamako and Lomé and the father dummies, the Wald test statistics are insig-nifi cant, indicating that the vector of variables used to instrument residential choice does not contribute to the determination of earnings once the correction terms are included. For Bamako and Lomé, including the father dummies as explanatory variables did not change the results signifi cantly.
As for the correction functions, in four cities (Abidjan, Bamako, Cotonou, and Lomé), we can reject the hypothesis that the coeffi cients of the polynomi-als included to correct for endogenous selection are all zero, suggesting that holding account of migrants’ self-selection aff ects the estimation of earnings equations in these cities. In no case, however, does adjusting for self-selection change the returns to education enough that the adjusted coeffi cients lie outside the confi dence intervals for the unadjusted estimates. Th is result suggests either that, given the relatively small number of migrants in our samples, selection
317
Table 10.8 Ordinary Least Squares Log-Earnings Regressions for Seven Cities in West Africa, 2001/02
Variable Abidjan Bamako Cotonou Dakar Lomé Niamey Ouagadougou
Gender (1 = male) 0.40*** 0.44*** 0.33*** 0.30*** 0.46*** 0.45*** –0.15*** –0.18*** 0.31*** 0.28*** 0.23*** 0.28*** 0.41*** 0.31*** (0.05) (0.05) (0.04) (0.06) (0.04) (0.04) (0.05) (0.05) (0.05) (0.07) (0.05) (0.07) (0.05) (0.08) CEP (Certifi cat
d’études primaires) 0.55*** 0.55*** 0.21*** 0.23** 0.54*** 0.50*** 0.36*** 0.36*** 0.52*** 0.52*** 0.52*** 0.53*** 0.44*** 0.45*** (0.07) (0.08) (0.07) (0.10) (0.06) (0.08) (0.07) (0.08) (0.07) (0.08) (0.09) (0.13) (0.08) (0.08) BEPC (Brevet d’études du premier cycle du second degré) 1.17*** (0.10) 1.19*** (0.08) 0.53*** (0.11) 0.56*** (0.13) 1.00*** (0.09) 0.94*** (0.09) 0.58*** (0.09) 0.57*** (0.09) 1.11*** (0.10) 1.13*** (0.10) 1.07*** (0.14) 1.08*** (0.13) 1.31*** (0.11) 1.30*** (0.12) CAP (Certifi cat
d’aptitude professionnelle) 1.21*** (0.20) 1.19*** (0.16) 0.48*** (0.12) 0.54*** (0.13) 1.17*** (0.15) 1.07*** (0.16) 0.72*** (0.25) 0.74*** (0.14) 1.10*** (0.23) 1.24*** (0.21) 1.48*** (0.23) 1.42*** (0.18) 1.18*** (0.18) 1.19*** (0.16) BEP (Brevet d’études profesionnelles) 1.13*** (0.20) 1.03*** (0.14) 0.98*** (0.11) 1.03*** (0.12) 0.95** (0.47) 0.74** (0.35) 0.86*** (0.26) 0.85*** (0.20) 1.34*** (0.24) 1.31*** (0.18) 1.30*** (0.20) 1.22*** (0.20) 1.74*** (0.25) 1.76*** (0.25) Baccalauréat 1.71*** 1.66*** 0.81*** 0.81*** 1.37*** 1.35*** 0.97*** 1.05*** 1.64*** 1.63*** 1.90*** 1.90*** 1.85*** 1.86*** (0.15) (0.11) (0.20) (0.24) (0.15) (0.14) (0.14) (0.16) (0.18) (0.16) (0.19) (0.19) (0.19) (0.16) Foundation degreea 2.08*** 2.08*** 1.00*** 1.06*** 2.14*** 1.94*** 1.17*** 1.14*** 2.72*** 2.74*** 1.90*** 1.82*** 2.14*** 2.10*** (0.15) (0.12) (0.16) (0.14) (0.20) (0.21) (0.26) (0.22) (0.28) (0.19) (0.25) (0.22) (0.22) (0.24) Bachelor’s degree 2.30*** 2.26*** 1.42*** 1.49*** 1.98*** 1.89*** 1.40*** 1.39*** 2.53*** 2.58*** 2.26*** 2.16*** 2.41*** 2.41*** (0.13) (0.10) (0.12) (0.13) (0.13) (0.13) (0.14) (0.12) (0.16) (0.13) (0.14) (0.11) (0.16) (0.12) Postgraduate degree 1.81*** 1.73*** 1.15*** 1.14*** 1.74*** 1.61*** 1.39*** 1.36*** 2.20*** 2.27*** 1.98*** 1.89*** 1.62*** 1.65*** (0.21) (0.18) (0.23) (0.22) (0.18) (0.17) (0.18) (0.13) (0.27) (0.21) (0.18) (0.15) (0.23) (0.22) Marital status (1 = married) 0.28*** 0.25*** 0.43*** 0.47*** 0.65*** 0.63*** 0.36*** 0.38*** 0.48*** 0.49*** 0.45*** 0.45*** 0.36*** 0.41*** (0.05) (0.04) (0.05) (0.06) (0.05) (0.05) (0.06) (0.06) (0.06) (0.06) (0.06) (0.07) (0.06) (0.05)
318 Speaks French (1 = yes) 0.06 0.06 0.21*** 0.21** 0.14** 0.15* 0.30*** 0.32*** 0.08 0.07 0.24*** 0.24*** 0.40*** 0.45*** (0.06) (0.07) (0.06) (0.08) (0.06) (0.09) (0.06) (0.07) (0.07) (0.07) (0.07) (0.08) (0.07) (0.08) Speaks another language (1 = yes) 0.19** 0.17*** 0.13** 0.08 0.36*** 0.41*** 0.34*** 0.35*** 0.04 0.01 0.09 0.17* 0.32*** 0.34*** (0.07) (0.06) (0.06) (0.09) (0.07) (0.07) (0.07) (0.07) (0.07) (0.08) (0.08) (0.09) (0.08) (0.09) Experience (years) 0.12*** 0.13*** 0.09*** 0.08*** 0.16*** 0.15*** 0.14*** 0.14*** 0.14*** 0.15*** 0.15*** 0.15*** 0.16*** 0.14*** (0.01) (0.01) (0.01) (0.01) (0.01) (0.01) (0.01) (0.01) (0.01) (0.01) (0.01) (0.01) (0.01) (0.01) Experience squared –0.002*** –0.002*** –0.001*** –0.001*** –0.002*** –0.002*** –0.002*** –0.002*** –0.002*** –0.002*** –0.002*** –0.002*** –0.002*** –0.002*** (0.00) (0.00) (0.00) (0.00) (0.00) (0.00) (0.00) (0.00) (0.00) (0.00) (0.00) (0.00) (0.00) (0.00) Public sector 0.69*** 0.50*** 0.33*** 0.38*** 0.27*** 0.32*** 0.78*** 0.84*** 0.64*** 0.65*** 0.49*** 0.46*** 0.66*** 0.76*** (0.10) (0.08) (0.07) (0.07) (0.09) (0.06) (0.09) (0.07) (0.10) (0.06) (0.08) (0.08) (0.08) (0.10) Private sector 0.67*** 0.65*** 0.17*** 0.20*** 0.32*** 0.34*** 0.81*** 0.83*** 0.33*** 0.33*** 0.31*** 0.30*** 0.42*** 0.47*** (0.06) (0.06) (0.06) (0.07) (0.07) (0.07) (0.06) (0.06) (0.09) (0.11) (0.08) (0.09) (0.09) (0.10) Father in agricultural sector –0.08 –0.05 –0.11** –0.18*** –0.02 –0.06 0.05 0.01 0.02 0.03 –0.01 –0.02 –0.21*** –0.29*** (0.05) (0.06) (0.05) (0.07) (0.05) (0.06) (0.06) (0.06) (0.06) (0.06) (0.06) (0.07) (0.05) (0.07) Father in industrial sector –0.22** –0.19** –0.06 –0.06 0.15 0.10 –0.11 –0.12 –0.04 –0.02 –0.19 –0.21 –0.32** –0.37* (0.09) (0.10) (0.09) (0.12) (0.09) (0.12) (0.07) (0.08) (0.10) (0.13) (0.14) (0.21) (0.16) (0.19) Father in commercial sector –0.05 –0.02 0.10* 0.11* 0.06 0.01 0.01 –0.02 0.10 0.08 –0.13 –0.11 0.01 –0.03 (0.07) (0.07) (0.05) (0.07) (0.07) (0.08) (0.06) (0.07) (0.09) (0.12) (0.08) (0.12) (0.08) (0.11) Father was senior
executive 0.35** 0.35** 0.41*** 0.43*** 0.28** 0.19 0.26** 0.27** 0.17 0.18 –0.20 –0.23 0.24 0.21 (0.14) (0.13) (0.10) (0.11) (0.12) (0.16) (0.13) (0.13) (0.16) (0.18) (0.16) (0.24) (0.15) (0.16) Father was midlevel executive –0.12 –0.18* 0.15** 0.17*** 0.23*** 0.25*** 0.09 0.10 –0.01 –0.01 –0.05 –0.07 0.09 0.12 (0.09) (0.10) (0.07) (0.06) (0.07) (0.07) (0.09) (0.09) (0.09) (0.11) (0.11) (0.10) (0.12) (0.13) Table 10.8 (continued)
319
Number of
observations 4,239 4,239 4,052 4,052 4,736 4,736 5,430 5,430 4,245 4,245 3,701 3,701 4,471 4,471
R-squared 0.41 0.41 0.32 0.32 0.44 0.44 0.34 0.34 0.34 0.35 0.39 0.40 0.39 0.40 Wald test for
selection correction
terms 10.60* 11.00* 17.30*** 5.54 28.00*** 6.49 6.02
Overidentifi cation Wald tests
Father dummiesb 3.86 8.07** 1.64 1.05 10.10** 2.03 1.63
Religion dummies 3.22 0.33 3.41 0.90 3.44 1.70 0.59
Nationality
dummies 5.48 2.45 4.61 0.02 7.17 7.60 7.72
Sources: Based on Phase 1 of the 1-2-3 surveys of selected countries (see table 10.1 for details).
Note: Figures show uncorrected and corrected estimates. Figures in parentheses are standard errors.
a. University system derives from the French system, in which, until recently, second-year students could receive a diploma. This diploma is referred to here as the foundation degree. b. Father was absent when individual was 15; father had no schooling; father schooling is missing.
* significant at the 10 percent level, ** significant at the 5 percent level, *** significant at the 1 percent level.
Table 10.8 (continued)
320 URBAN LABOR MARKETS IN SUB-SAHARAN AFRICA
does not strongly bias the estimated returns to education or that our control functions do not do much to correct for the type of selectivity that matters.
In Abidjan, Cotonou, and Niamey, the corrected coeffi cients are lower than the uncorrected coeffi cients, suggesting that migrants to these cities share unob-served characteristics that make their earnings higher than the host city average. Th e opposite is found in Bamako and Lomé. Th ese results have no implications for migrants’ positive or negative selection. Indeed, migrants could have lower than average earnings in their host city but still earn more than they would have in the capital of their country of origin. In order to check whether earn-ings diff erentials matter in locational choice, we need to estimate the model in its structural form.
Comparing returns to education shows large diff erences across cities. In Bamako, and to a lesser extent Dakar, returns to education seem much lower than in the other cities. Th e increase in returns by grades does not appear very steep either. In Bamako, having completed primary school yields an estimated increase in hourly earnings of only 23 percent over uneducated individuals, a much lower estimate than in Abidjan (about 55 percent). In all cities, the largest returns are for bachelor’s degrees. Th e smallest increase is in Bamako (114 percent over uneducated individuals) and the largest in Lomé (227 percent).
Structural Model of Residential Choice
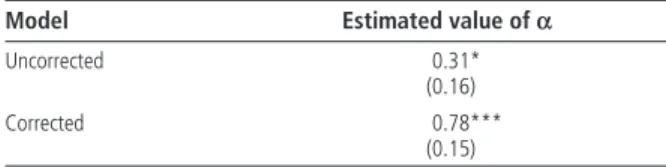
Do earnings diff erentials aff ect locational choice? Table 10.9 presents the results of the conditional logit estimation (equation 10.1). With no correction for endogenous selection, the coeffi cient is small and weakly signifi cant. Its size more than doubles and becomes very signifi cant when we correct for endog-enous selection, bringing support to the idea that individuals tend to locate in countries where their expected earnings are higher.
Table 10.9 Structural Model Estimates of Individual Residential Choice in Seven Cities in West Africa, 2001/02
Model Estimated value of `
Uncorrected 0.31* (0.16) Corrected 0.78***
(0.15)
Sources: Based on Phase 1 of the 1-2-3 surveys of selected countries (see table 10.1 for details).
Note: Figures in parentheses are standard errors.
* significant at the 10 percent level, ** significant at the 5 percent level, *** significant at the 1 percent level.
WHY DO MIGRANTS MIGRATE? 321
A second assessment of this notion is given by simulations that compare wages between origin and destination countries. We simulated these diff erences using the following procedure:
• Step 1: For each individual, compute the predicted value of the (log) average hourly income in each city.
• Step 2: For each individual, draw a value in the standard normal distribution.
• Step 3: For ea ch individual i and city k, combine the results of steps 1 and 2 to compute the predicted value of the individual’s (log) hourly income in city k, summing the predicted average with the random term multiplied by the estimated standard deviation of (log) wages in that city.
• Step 4: Repeat steps 2 and 3 100 times. For “movers,” compute m, the pro-portion of individuals for whom the predicted hourly income is higher in their current city than in the capital of their country of origin. For “stayers,” compute the average value of predicted hourly income in the cities in which they chose not to reside. Th en compute s, the proportion of individuals for whom the average value of predicted hourly income is lower in the cities in which they chose not to reside than in their country of origin.
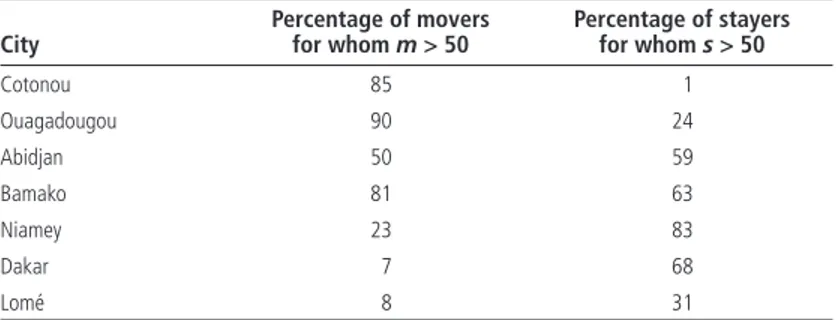
Table 10.10 shows the results of this exercise. For movers (stayers) in each city, it reports the proportion of individuals for whom m (s) exceeds 50 percent. In Bamako, Cotonou, and Ouagadougou, our model does a good job of predict-ing that movers live in cities in which their hourly income is higher than in their city of origin. In Bamako in particular, income diff erentials seem to play an important role. Th e model also does a good job of predicting stayers in Abi-djan, Bamako, Dakar, and Niamey. Th e model fails to predict the destination of movers from Dakar and Lomé and of stayers in Cotonou. Th e fact that it fails
Table 10.10 Model Simulation Results of Moving and Staying in Seven Cities in West Africa, 2001/02 City Percentage of movers for whom m > 50 Percentage of stayers for whom s > 50 Cotonou 85 1 Ouagadougou 90 24 Abidjan 50 59 Bamako 81 63 Niamey 23 83 Dakar 7 68 Lomé 8 31
Sources: Based on Phase 1 of the 1-2-3 surveys of selected countries (see table 10.1 for details).
Note: m = proportion of individuals for whom predicted hourly income is higher in current city than in capital of country of origin. s = proportion of individuals for whom average value of predicted hourly income is lower in cities in which they chose not to reside than in country of origin.
322 URBAN LABOR MARKETS IN SUB-SAHARAN AFRICA
to predict the behavior of workers in some cities should not be surprising, as potential income diff erentials are not the only motive for migration. Given that income is just one factor among many, the ability of the model to predict work-ers’ choice based on potential income diff erentials is surprisingly good.
For movers, we computed the diff erence between the predicted value of hourly earnings in the origin country capital and destination city; for stayers, we com-puted the diff erence between the predicted value of hourly earnings in the origin country capital and an average of the predicted value of hourly earnings that could be obtained in the six potential destination cities. We then computed the average value of these diff erences separately for movers and stayers. Th e diff erence is close to zero (–0.36) for stayers, suggesting that for these people there is no real gain of moving abroad. In contrast, movers earned much higher hourly earnings abroad (–3.99) than they would have earned had they stayed in their country of origin. Robustness Checks
We conducted several robustness checks. First, in the second stage of our estima-tion procedure, we ran a Heckman selecestima-tion model using data on labor market participants and nonparticipants instead of an ordinary least squares regression on participants only. In the early estimations, because of the diffi culty of control-ling for both the endogenous selection of locational choice and labor force partic-ipation, we restricted the sample to labor market participants. Th is limitation is a potential source of bias in our estimates. Th e identifying variable in the Heckman selection model is whether the individual is married, which is assumed to infl u-ence labor market participation but not earnings. Results obtained in the third stage were not aff ected by this change, suggesting negligible biases. Second, we checked whether self-selected internal migration aff ected the observed returns to education. We found no evidence of selection bias. Th ird, as our results might depend on the set of conversion factors used to convert current CFA francs into purchasing power parity values, we reran the model using World Bank (2003) conversion factors. Th is modifi cation did not change the results signifi cantly.
Conclusion
Our results shed light on migration fl ows within the WAEMU region. Despite the severe political crisis that began in 1999, Côte d’Ivoire remains the most important destination country in the subregion. Mali and Burkina Faso remain major labor-exporting countries, largely toward Côte d’Ivoire. Benin and Togo combine emigration and immigration.
Migrants tend to be less educated than nonmigrants, in both their origin and destination countries. Cross-border migration within the subregion thus seems to concern mainly people with low levels of education, who are more likely than
WHY DO MIGRANTS MIGRATE? 323
natives to work in the informal sector and receive lower wages. Not accounting for international migration in estimating returns to education yields upward biased estimates in three of seven countries and downward biased estimates in two others. However, disparities in returns to education between cities do not vanish, suggesting that country-specifi c amenities and other unobservable nonwage variables play important roles in the locational choice of individuals with diff erent levels of education.
We also fi nd that expected earnings diff erentials have a very signifi cant eff ect on choice probabilities: everything else equal, people tend to live in cities in which their expected earnings are higher than elsewhere. Our sample is not a random sample of individuals from the WAEMU region, and we do not include all potential destinations. Th ese caveats notwithstanding, our results on the locational choice of a large sample of West Africans suggest that individuals in developing countries do not always deviate from the predictions of the standard economic model.
Notes
1. WAEMU includes eight countries: the seven under review in this chapter (Benin, Burkina Faso, Côte d’Ivoire, Mali, Niger, Senegal, and Togo) and Cape Verde. ECOWAS is a larger group of countries. It includes all WAEMU countries as well as Th e Gambia, Ghana, Guinea, Guinea Bissau, Liberia, Nigeria, and Sierra Leone. 2. Although Abidjan and Cotonou are not the administrative capitals of Côte d’Ivoire
and Benin, we refer to them as capitals because they are the most important cities in economic terms (Cotonou is also the seat of government).
3. Th e civil war in Côte d’Ivoire started in September 2002, a few months aft er comple-tion of the 1-2-3 survey.
4. Th e unemployment rates reported in tables 10.6 and table 1.6 in chapter 1 diff er, for two reasons. First, table 1.6 covers only the active population, whereas table 10.6 includes inactive individuals. Second, table 10.6 is restricted to people 15–65, whereas table 1.6 covers everyone 10 and older.
5. Figures for Bamako and Dakar should be considered with great care given the small sample size.
6. All sampled individuals were born in one of the seven countries under review. We assume that they chose to live in one of the capitals of these countries; the model is built to analyze the determinants of this choice. Th roughout the rest of the chapter, we distinguish between countries of origin and cities of destination or residence.
7. Indeed, according to UNESCO’s (2005) Education for All 2005 Monitoring Report, which provides various indicators of the quality of education, none of the seven countries of concern stands out from the crowd. For instance, Benin ranks fi rst when the quality of education is measured by the probability of being literate aft er six years of primary school but fourth when quality is measured by test scores and seventh when measured by the average teacher wage.
324 URBAN LABOR MARKETS IN SUB-SAHARAN AFRICA
8. Th e PPP conversion factors were computed in 1998 by the Agence pour la Sécurité de la Navigation Aérienne en Afrique (ASECNA) and updated through 2001 using national infl ation rates.
References
African Union. 2005. “Draft Strategic Framework for a Policy on Migration in Africa.” Th ird Ordinary Session of the Labour and Social Aff airs Commission, Pretoria, April 18–23.
Borjas, G. 1987. “Self-Selection and the Earnings of Immigrants.” American Economic Review 77 (4): 531–53.
Dahl, G. B. 2002. “Mobility and the Return to Education: Testing a Roy Model with Multiple Markets.” Econometrica 70 (6): 2367–420.
Harris, J., and M. Todaro. 1970. “Migration, Unemployment, and Development: A Two-Sector Analysis.” American Economic Review 60 (1): 126–42.
IOM (International Organisation for Migration). 2003. World Migration 2003: Challenges, and Responses for People on the Move. Geneva: IOM.
Roy, A. 1951. “Some Th oughts on the Distribution of Earnings.” Oxford Economic Papers
3: 135–46.
Sjaastad, L. A. 1962. “Th e Costs and Returns of Human Migration.” Journal of Political Economy 70 (5): 80–93.
Todaro, M. 1969. “A Model of Labor Migration and Urban Unemployment in Less Devel-oped Countries.” American Economic Review 59: 138–48.
UNESCO (United Nations Educational, Scientifi c and Cultural Organization). 2005.
Education for All 2005 Monitoring Report. Paris: UNESCO.
© 2013 International Bank for Reconstruction and Development / Th e World Bank 1818 H Street NW, Washington DC 20433
Telephone: 202-473-1000; Internet: www.worldbank.org Some rights reserved
1 2 3 4 16 15 14 13
Th is work is a product of the staff of Th e World Bank with external contributions. Note that Th e World
Bank and the Agence Française de Développement do not necessarily own each component of the content
included in the work. Th e World Bank and the Agence Française de Développement therefore do not
warrant that the use of the content contained in the work will not infringe on the rights of third parties.
Th e risk of claims resulting from such infringement rests solely with you.
Th e fi ndings, interpretations, and conclusions expressed in this work do not necessarily refl ect the
views of Th e World Bank, its Board of Executive Directors, or the governments they represent, or the
Agence Française de Développement. Th e World Bank does not guarantee the accuracy of the data
included in this work. Th e boundaries, colors, denominations, and other information shown on any map
in this work do not imply any judgment on the part of Th e World Bank concerning the legal status of any
territory or the endorsement or acceptance of such boundaries.
Nothing herein shall constitute or be considered to be a limitation upon or waiver of the privileges and
immunities of Th e World Bank, all of which are specifi cally reserved.
Rights and Permissions
Th is work is available under the Creative Commons Attribution 3.0 Unported license (CC BY 3.0) http://
creativecommons.org/licenses/by/3.0. Under the Creative Commons Attribution license, you are free to copy, distribute, transmit, and adapt this work, including for commercial purposes, under the following conditions:
Attribution—Please cite the work as follows: De Vreyer, Philippe, and François Roubaud, Editors. 2013.
Urban Labor Markets in Sub-Saharan Africa. Africa Development Forum series. Washington, DC: World Bank. doi:10.1596/978-0-8213-9781-7. License: Creative Commons Attribution CC BY 3.0
Translations—If you create a translation of this work, please add the following disclaimer along with the
attribution: Th is translation was not created by Th e World Bank and should not be considered an offi cial
World Bank translation. Th e World Bank shall not be liable for any content or error in this translation.
All queries on rights and licenses should be addressed to the Offi ce of the Publisher, Th e World Bank,
1818 H Street NW, Washington, DC 20433, USA; fax: 202-522-2625; e-mail: [email protected]. ISBN (paper): 978-0-8213-9781-7
ISBN (electronic): 978-0-8213-9782-4 DOI: 10.1596/978-0-8213-9781-7
Cover image: ©Michelle Saint-Léger, IRD, 2013.
Cover design: Debra Naylor, Naylor Design, Inc.
Library of Congress Cataloging-in-Publication Data
Vreyer, Philippe De.
Urban labor markets in sub-Saharan Africa/Philippe De Vreyer and François Roubaud.
p. cm.
Includes bibliographical references and index.
ISBN 978-0-8213-9781-7 — ISBN 978-0-8213-9782-4 (electronic)
1. Labor market—Africa, Sub-Saharan. 2. Africa, Sub-Saharan—Economic conditions. 3. City dwellers—Employment—Africa, Sub-Saharan. I. Roubaud, François. II. World Bank. III. Title.
HD5837.A6V74 2013
331.120967—dc23
2012050217
Th e French translation of this book is copublished by Agence Française de Développement and Institut
de Recherche pour le Développement (IRD). Th e IRD, a French public research institute emphasizing
interdisciplinarity, has focused its research for more than 65 years on the relationship between man and its environment in Africa, Asia, Latin America, the Mediterranean, and the French tropical overseas ter-ritories. Its research, training, and innovation activities are intended to contribute to the social, economic, and cultural development of southern countries. For further information: www.editions.ird.fr.