THIS REPORT CONTAINS ASSESSMENTS OF COMMODITY AND TRADE ISSUES MADE BY
USDA STAFF AND NOT NECESSARILY STATEMENTS OF OFFICIAL U.S. GOVERNMENT
POLICY
Date:
GAIN Report Number:
Approved By:
Prepared By:
Report Highlights:
In 2016, overall local raw milk products decreased 4.5% by volume of 2 million metric ton (MT), but per capita volume consumption continued to increase to 76.4 kilograms in 2016. Since the FMD outbreak in 2010, local raw milk production has rebounded but has outpaced slower growing demand. Consumers who continue to drink milk will shift to reduced fat milk from full-fat fresh milk. The share of reduced-fat fresh milk is projected to be 19% in 2020, up from 15% in 2016. Low fat milk, organic milk and fortified milk posted a positive performance, while sales of fresh milk are set to decline. The cheese categories recorded positive value growth in 2016. The introduction of different types of processed cheese led to growth. The manufacturers offered diverse sliced cheese products targeted at adults, including cheese for instant noodles, cheese for rice with garlic and black sliced cheese with squid ink. Less expensive NFDM imports and over production of fresh milk have resulted in inventories remaining high in 2016, even though local NFDM production amounted to 8,540 MT, a 50% decrease from the previous year and consumption increased. In 2016, NFDM imports decreased by 3% to 20,611 MT compared to 2015.
Youngsook Oh, Ag. Marketing Specialist
Lynne Larrabee, Director, ATO
2017 Dairy and Products Annual Update
Dairy and Products Annual
Korea - Republic of
KS1732
10/27/2017
Executive Summary:
Consumers enjoyed more milk-based beverages through the foodservice channel, such as in cafés, but
consumption of fresh milk on its own increased slowly. Fat-free fresh milk records the highest growth
of 15% within drinking milk products. Low fat milk, organic milk and fortified milk posted a positive
performance, while sales of fresh milk are set to decline. Hypermarkets and supermarkets will continue
to be major distribution channels for drinking milk in multipacks, targeting sales to homemakers. In
2016, Korean local raw milk products contracted 4.5% by volume but per capita volume consumption
continued to increase.
Processed cheese recorded value sales of $161 million, while unprocessed cheese reached $147 million
in 2016. Spreadable processed cheese continued to record positive growth of 4% by value in 2016. Soft
cheese is set to increase at about 2% in 2016, while processed cheese is set to decline at about 3%.
Besides the snack concept of soft cheese, ricotta, brie and types of natural cheese that can be eaten after
being grilled were widely introduced and popular in Korea. Consumers were attracted to such processed
cheese products due to their convenience. Consumers tended to use cream cheese more for cooking,
and not as much for spreading on bread or for dipping, while Philadelphia spreadable cheese still
dominated in 2016. Adult consumers also enjoyed string cheese as a nutritional snack. The
manufacturers offered diverse sliced cheese products targeted at adults, including cheese for instant
noodles, cheese for rice with garlic and black sliced cheese with squid ink. Within soft cheese, fresh
mozzarella cheese and string cheese posted the stronger performances in 2016, which was due to
continued popularity of pizzas.
Local NFDM production amounted to 8,540 MT, a 50% decrease from the previous year, while
consumption increased. The yogurt trend towards plain yogurt continued. Under the health and
wellness trend, consumers are shifting to nothing-added plain yogurt that is perceived as more natural
instead of flavored. Only plain yogurt maintained healthy current value growth in 2016, rising by 13%.
Ice cream and frozen desserts decreased by 4% in retail, down to $1,782 million in 2016. To boost sales,
manufacturers put effort into developing new products but the still dominated by a few leading brands,
such as World Cone and Bravo Cone. Soft ice cream and ice cream desserts in foodservice continued to
show strong performances. Butter and margarine increased by 4% by value in 2016, which was thanks
to strong value growth of 5% for butter. Previously, Korean consumers were not so familiar with using
butter for cooking at home, with butter and margarine posting value sales of only $20 million in 2011;
however, consumption began to perform strongly after TV cooking shows and fat diet trend created
strong interest.
Commodities:
Production:
As Table 1 shows, local raw milk products volume decreased by 4.5% (2.07 million MT), but per capita volume
consumption continued to increase to 76.4 kilograms in 2016. Drinking milk products continued to decline in current value terms in 2016, while per capita sales of fresh milk has been slowly increasing. Consumers enjoyed more milk-based beverages through the foodservice channel, such as in cafés, but consumption of fresh milk on its own increased only slightly.
Consumers increasingly preferred a milk drink that had a good taste, as in a dessert, rather than for health reasons due to diverse nutritional dietary supplements and healthy food products for children and seniors, such products are gradually replacing the role of fresh milk. Manufacturers tried to develop new products targeting consumers who were especially concerned about their health by introducing probiotic milk products, higher-protein milk, low fat milk, high-calcium milk and organic milk, but such moves did not significantly affect the overall performance of fresh milk. Rather, they resulted in a 1% rise in current value terms in the average unit price of fresh milk in 2016.
Table 1: Korea Raw fluid milk Supply & Demand, Per Capita Consumption Unit: 1,000 Metric Ton
2013 2014 2015 2016
Per Capita Consumption for Dairy Products (Kilogram) 71.3 72.4 75.7 76.4 Per Capita Consumption for Drinking Milk (Kilogram) 33.5 32.5 32.6 32.7 Source: Ministry of Agriculture, Food and Rural Affairs (MAFRA) / 2016 Dairy Statistics Yearbook by Korea Dairy Committee (KDC)
Whey Powder (HS:0404.10 )
20,20 0
42,451 18,20 1
35,091 12,70 0
31,400 15,100 34,400 12,271 35,444
Ice Cream (HS:2105)
920 4,100 1,264 4,744 1,200 5,400 1,100 5,660 1,146 6,308
Total 57,08
1 (33%)
176,25 9
70,64 4 (38%)
184,81 7
88,62 8 (45%)
198,81 6
78,913 (38%)
209,413 60,697 (28%)
215,981
Source: 2016 Korea Customs Office
Table 3: Domestic Milking Cows, Farms, and Production
2013 2014 2015 2016
Number of Raising Milking Cows (1,000 Heads)
424 431 411 404
Number of Practical Milking Cows (1,000 Heads)
206 208 197 194
Number of Farms 5,830 5693 5,498 5,354
Average number of cows per Farm 72.8 75.7 74.8 75.5
Source: 2016 Dairy Statistics Yearbook
Table 4: Raising Cost of Dairy Cow per Head Unit: USD
2013 2014 2015 2016
Total Raising Cost 7,139 7,307 7,248 7,225
Feed Cost 4,012 4018 4,049 4,081
Source: 2016 Dairy Statistics Yearbook
Table 5: Raw fluid milk Production Cost per 100 Liter Unit: USD
2013 2014 2015 2016
Total Production Cost 80.7 79.6 76.3 76.0
Feed Cost 82.6 81.6 78.8 79.3
Income from By Product 2.0 2.0 2.5 3.4
Source: 2016 Dairy Statistics Yearbook
Consumption:
Drinking milk products decreased slightly to reach $2.9 million sales in 2016. However, drinking milk products is expected to increase at a 1%, which is thanks to a continuing good performance from flavored milk drinks. Manufacturers are focusing more on developing new flavors of flavored milk drinks, targeting consumers who drink milk as a kind of beverage
dessert. Fat-free fresh milk records the highest growth of 15% within drinking milk products. Average unit price of drinking milk products rose slightly, which was due to the popularity of premium milk products.
Low fat milk, organic milk and fortified milk was posting a positive performance, while sales of whole fresh milk are set to decline. Manufacturers are segmenting more products in terms of different percentages of fat, the amount of calcium, protein, probiotics and other nutritional ingredients, targeting various consumer groups such as children, young women, seniors, the middle aged and male consumers. In particular, fat-free fresh milk is predicted to increase about 17% in the coming years.
Soy milk is expected to decline due to the declining birth rate, so manufacturers within soy milk will focus on senior consumers by strengthening calcium and vitamin D ingredients and by offering sugar-free varieties for those concerned about diabetes.
Table 6: Domestic Raw fluid milk Usage Unit: 1,000 MT
Drinking Use 1,587 (76%) 1,540(70%) 1,529(70.5%) 1,565(76%)
Processed Use 506(24%) 674(30%) 639(29.5%) 505(24%)
Total 2,093(100%) 2,214(100%) 2,168(100%) 2,070(100%)
Source: 2016 Dairy Statistics Yearbook
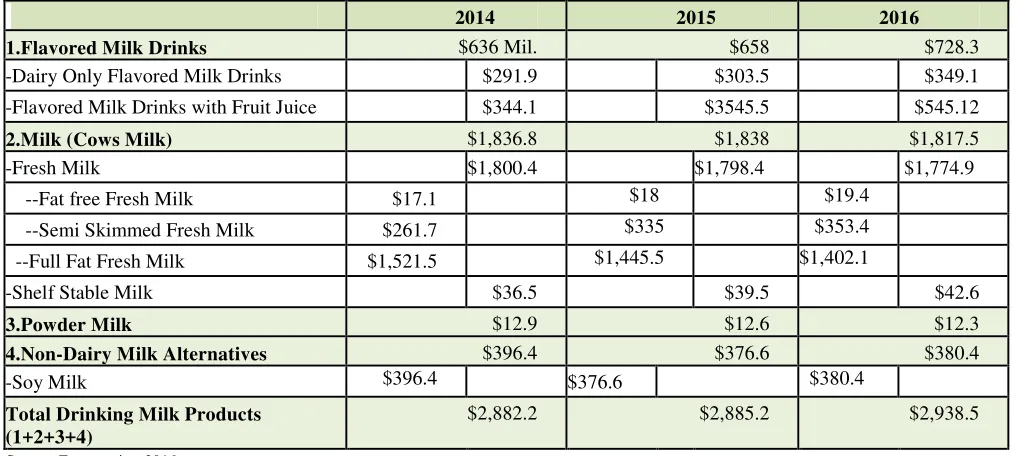
Table 7: Sales of Drinking Milk Products by Category: Value ($Million)
2014 2015 2016
1.Flavored Milk Drinks $636 Mil. $658 $728.3
-Dairy Only Flavored Milk Drinks
$291.9
$303.5
$349.1
-Flavored Milk Drinks with Fruit Juice
$344.1
$3545.5
$545.12
2.Milk (Cows Milk) $1,836.8 $1,838 $1,817.5
-Fresh Milk
$1,800.4
$1,798.4
$1,774.9
--Fat free Fresh Milk $17.1
$18
$19.4
--Semi Skimmed Fresh Milk $261.7
$335
$353.4
--Full Fat Fresh Milk $1,521.5
$1,445.5
$1,402.1
-Shelf Stable Milk
$36.5
$39.5
$42.6
3.Powder Milk $12.9 $12.6 $12.3
4.Non-Dairy Milk Alternatives $396.4 $376.6 $380.4
-Soy Milk $396.4
$376.6
$380.4
Total Drinking Milk Products (1+2+3+4)
$2,882.2 $2,885.2 $2,938.5
Source: Euromonitor 2016
Marketing:
Besides traditional flavors of milk drinks such as chocolate, banana and strawberry, there are now competitive flavored milk drinks such as watermelon milk, honey milk, toffee nut milk, mixed nuts milk and avocado milk. As a result, the average unit price of flavored milk increased by 2% in 2016. Manufacturers of fresh milk are introducing of renovated milk products to attract consumers with diverse flavored premium milk products.
Hypermarkets and supermarkets will continue to be major distribution channels for drinking milk products. Both fresh milk and flavored milk drinks will be distributed mainly in multipacks at hypermarkets and supermarkets, targeting sales to homemakers.
In South Korea, primary schools provide fresh milk at a cheaper price than retail channels; however, the number of children is decreasing due to the birth rate continuously falling over the period 2008-2016. As a result, sales of milk to schools have decreased. The value share of drinking milk products sold through direct selling (home delivery) also declined, as fewer consumers drank milk on a daily basis for health reasons. On the other hand, convenience stores and mixed retailers, such as variety shops, which consumers can easily visit for a drink of milk, increased their value shares of drinking milk products.
Production, Supply and Demand Data Statistics:
Table 8: PSD TABLE for Fluid Milk
Dairy, Milk, Fluid 2016 2017 2018
Market Begin Year Jan 2016 Jan 2017 Jan 2018
Korea, Republic of USDA Official New Post USDA Official New Post USDA Official New Post
Cows In Milk 194 194 190 192 0 191
Cows Milk Production 2126 2070 2083 2081 0 2091
Other Milk Production 0 0 0 0 0 0
Other Imports 0 0 0 0 0 0
Total Imports 0 0 0 0 0 0
Total Supply 2126 2070 2083 2081 0 2091
Other Exports 0 0 0 0 0 0
Total Exports 0 0 0 0 0 0
Fluid Use Dom. Consum. 1488 1565 1458 1561 0 1568
Factory Use Consum. 638 505 625 520 0 523
Feed Use Dom. Consum. 0 0 0 0 0 0
Total Dom. Consumption 2126 2070 2083 2081 0 2091
Total Distribution 2126 2070 2083 2081 0 2091
(1000 HEAD) ,(1000 MT)
Commodities:
Production:
The average unit price of cheese increased slightly which was due to the strong performance of unprocessed cheese. The average unit price of soft cheese increased by 1% due to the introduction of new products in 2016, while unprocessed cheese also recorded a 1% rise. Within unprocessed cheese, the proportion of imported cheese was than in 2016. Spreadable processed cheese continued to record positive growth of 4% by value in 2016. Consumers tended to use cream cheese more for cooking and not as much for spreading on bread or for dipping while Philadelphia spreadable cheese still dominated the category in 2016.
Cheese is mainly purchased through hypermarkets and supermarkets, but the value share of convenience stores is increasing rapidly thanks to snack cheese targeted at adult consumers. Distribution channels became more diverse, such as convenience stores offering snack cheese. Meanwhile, soft cheese still tended to be purchased at hypermarkets and supermarkets by homemakers. Some domestic brands that have been launched within spreadable processed cheese are cheaper than
Philadelphia, with the result of the price of Philadelphia declining in major retailing channels. Soft cheese is set to increase at about 2% in 2016, while processed cheese is set to decline at about 3%. Unprocessed cheese is expected to reach about 50% value share of cheese, with greater availability of hard and soft unprocessed cheese in retailing channels in coming years.
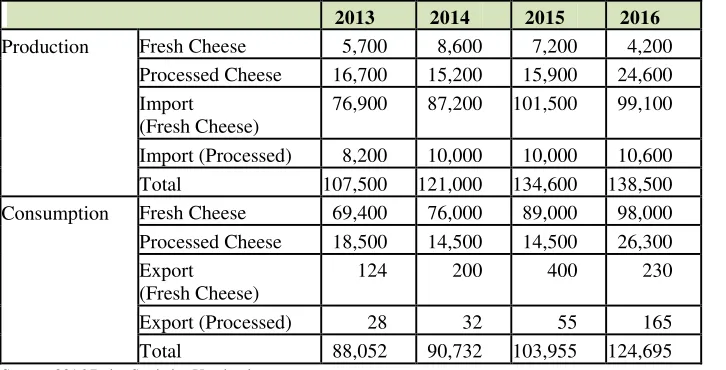
Table 9: Cheese Production, Import & Consumption
Unit: Metric Ton
2013 2014 2015 2016
Production Fresh Cheese 5,700 8,600 7,200 4,200
Processed Cheese 16,700 15,200 15,900 24,600
Import (Fresh Cheese)
76,900 87,200 101,500 99,100
Import (Processed) 8,200 10,000 10,000 10,600
Total 107,500 121,000 134,600 138,500
Consumption Fresh Cheese 69,400 76,000 89,000 98,000
Processed Cheese 18,500 14,500 14,500 26,300
Export (Fresh Cheese)
124 200 400 230
Export (Processed) 28 32 55 165
Total 88,052 90,732 103,955 124,695
Source: 2016 Dairy Statistics Yearbook
Consumption:
Processed cheese recorded value sales of $161 million, while unprocessed cheese reached $147 million in 2016. Processed cheese, a type that normally includes sliced cheese, decreased by 5% in 2016. Meanwhile, soft cheese increased by 1%, which was due to increased product diversification. In 2016, unprocessed cheese recorded a 48% value share of total cheese, which was an increase on its share from the previous year due to strong performances from portion and snack cheese within soft cheese.
Adult consumers also enjoyed string cheese as a nutritional snack. Besides the snack concept of soft cheese, ricotta, brie and types of natural cheese that can be eaten after being grilled were widely introduced and popular in Korea. Consumers were attracted to such products due to their convenience. Within soft cheese, fresh mozzarella cheese and string cheese posted the stronger performances in 2016, which was due to the continued popularity of pizzas. Cubed or portion cheese was also positioned as a side snack for adult consumers when drinking beer or wine, although sliced cheese was normally considered to be a snack for children. Many children chose string cheese and portion cheese as a snack instead of fortified cheese and organic cheese. Such a move is aimed at targeting adults, as the child population is declining. As a result, manufacturers offered diverse sliced cheese products such as cheese for instant noodles, cheese for rice with garlic and black sliced cheese with squid ink.
Table 10: Korean Imports of Cheese
2013 2014 2015 2016
$1,000 MT $1,000 MT $1,000 MT $1,000 MT
World 403,041 85,069 497,416 97,215 501,741 111,522 429,009 109,621
United States 188,384 42,530 301,316 63,848 250,749 54,821 168,634 39,966
New Zealand 102,242 23,883 50,522 10,139 63,614 15,643 55,466 16,646
EU 69,698 10,217 108,865 16,212 136,507 26,833 174,779 44,780
Australia 26,817 5,749 27,043 5,374 32,703 8,047 27,945 7,605
Other Countries 15,900 2,690 9,670 1,642 18,168 6,178 2,185 624
Source: Korea Customs Office 2016, HS 0406, Cheese and Curd
Trade:
Tariff reductions and increases in the TRQ’s for cheese products under the KORUS FTA have been pivotal for the United States to expand and/or maintain its market share against strong competition from the EU. The EU has the advantage of implementing an FTA with Korea in 2011 prior to the implementation of the KORUS FTA in 2012 as well as Korea being a target market in response to the Russian ban on agricultural exports. The United States had gained market share under the FTA and U.S. dairy exports peaked in 2014 by both volume and value increasing 58% and 90% compared to
2012. However, aggressive competition particularly for cheese and whey as well as new FTAs with New Zealand and Australia implemented in 2016 together with overall decline in total dairy imports have eroded gains. Total U.S. dairy exports to South Korea in 2016 declined 37% and 44% by volume and value, respectively.
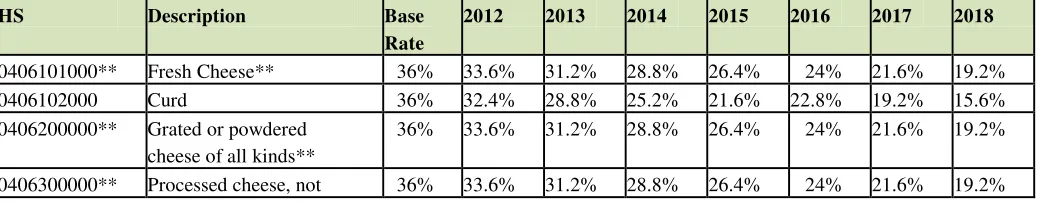
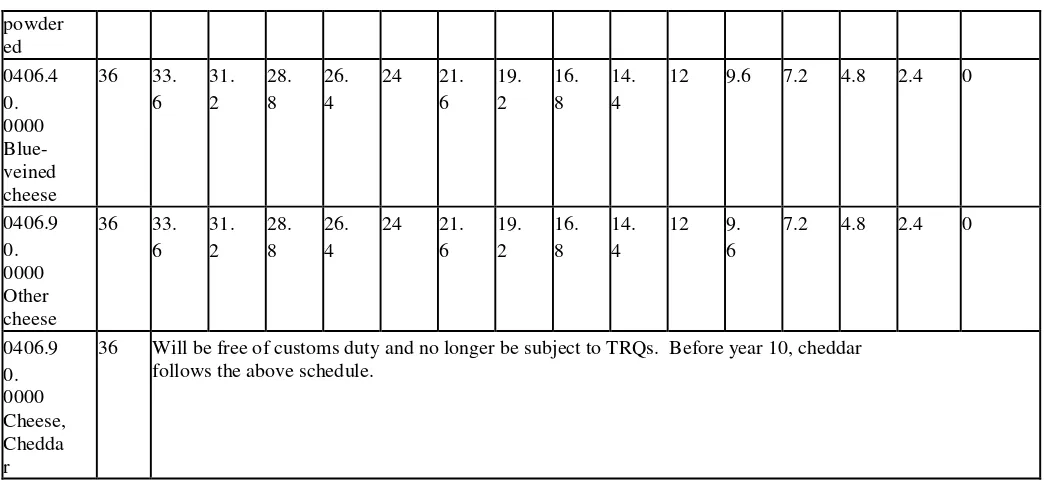
Table 11: Cheese Tariff Phase-Out Schedule under KORUS FTA:
The KORUS FTA creates a zero-duty tariff-rate quota for cheeses covered under tariff lines 0406101000, 0406200000, 0406300000 and 0406900000. In the first year in-quota amount is 7,000 MT in 2012 and rises to 10,280 MT in 2016. All U.S. cheeses will enter duty-free by 2026.
HS Description Base
Rate
2012 2013 2014 2015 2016 2017 2018
0406101000** Fresh Cheese** 36% 33.6% 31.2% 28.8% 26.4% 24% 21.6% 19.2%
0406102000 Curd 36% 32.4% 28.8% 25.2% 21.6% 22.8% 19.2% 15.6%
0406200000** Grated or powdered cheese of all kinds**
36% 33.6% 31.2% 28.8% 26.4% 24% 21.6% 19.2%
grated or powdered**
0406400000 Blue-veined cheese 36% 32.4% 29% 25.4% 21.8% 18.2% 19.2% 15.6%
0406900000** Cheese, NES, including cheddar**
36% 33.6% 31.2% 28.8% 26.4% 24% 21.6% 19.2%
TRQ Volume (MT)
7,000 7,210 7,426 7,649 7,878 8,115 8,358
The Korea Dairy Industries Association(KDIA)will administer the TRQs and allocate the in-quota quantity to historical and new importers through a licensing system
powder
36 Will be free of customs duty and no longer be subject to TRQs. Before year 10, cheddar follows the above schedule.
The Korea Dairy Industries Association(KDIA)shall administer these TRQs and allocate the in-quota quantity to historical and new importers through a licensing system. See detailed current(base)tariffs and tariff reductions that will occur under implementation of the KORUS FTA are available at: http://www.ustr.gov/Trade_Agreements/Bilateral/Republic_of_Korea_FTA/Final_Text/Section_Index.h tml A sector report on the implications of the Korea-U.S. Free Trade Agreement is available at:
http://www.fas.usda.gov/info/factsheets/Korea/commodity-dairy.asp
Marketing:
Seoul Dairy Cooperative maintained its leading positon within cheese with a 22% value share in 2016. The company continued to be strong within processed cheese with products targeted at children. Although it gained value share within soft cheese in 2016, its overall value share of cheese declined due to losses in the larger category of processed cheese. Seoul Dairy Cooperative led other processed cheese with a solid 36% value share in 2016, including sliced cheese, but its value share of soft cheese stayed at only 12%.
Dongwon F&B Co. became the second largest player within cheese in 2015, and maintained its position in 2016 thanks to a strong performance by its brand Denmark InPocket Cheese. The company extended its brand flavors that were considered suitable for consumption when drinking beer and wine, targeting adult consumers, so that the product became the leading snack cheese for consumers of all ages.
Maeil Dairies Co. still had the most developed technology and expertise with regard to unprocessed cheese in the domestic market. Its cheese brand Sangha maintained a high reputation in South Korea with regard to mozzarella cheese, pizza cheese, brie cheese and camembert. The company maintained its value share within cheese in 2016, and it continued to record value sales growth within soft cheese. In addition, there were increasing sales of private label brands, which are mostly produced by Maeil Dairies Co.
Production, Supply and Demand Data Statistics:
Table 13: PSD Table for Cheese
Dairy, Cheese 2016 2017 2018
Market Begin Year Jan 2016 Jan 2017 Jan 2018
Korea, Republic of USDA
Official
Production 24 29 24 29 0 29
Total Imports 110 110 120 113 0 117
Total Supply 136 141 146 144 0 148
Other Exports 0 0 0 0 0 0
Total Exports 0 0 0 0 0 0
Human Dom. Consumption
134 139 144 142 0 146
Other Use, Losses 0 0 0 0 0 0
Total Dom. Consumption 134 139 144 142 0 146
Total Use 134 139 144 142 0 146
Ending Stocks 2 2 2 2 0 2
Total Distribution 136 141 146 144 0 148
(1000 MT)
Commodities:
Production:
Local NFDM production decreased by 50% in 2016 from the previous year while consumption remained relatively flat. However, yearend inventory remained high mostly due to less expensive imports. Local raw fluid milk price reached $0.84 (Korean Won 922) per liter in 2016, the highest raw fluid milk price in the world. As a result, local NFDM production costs roughly $9 per liter. However, the practical retail value of market price is about $4 per liter due to inexpensive
imported NFDM. Powdered milk declined by 5% and shelf stable milk increased by just 1% in 2016. In South Korea, powdered milk is used in baking, so it is rarely found in major retail channels. In the case of shelf stable milk, except for organic shelf stable flavored milk drinks under the brand Sangha Mokjang, white milk shelf stable milk brands continued to record weak performances in 2016. In addition, there were no new products to help boost sales children.
Consumption:
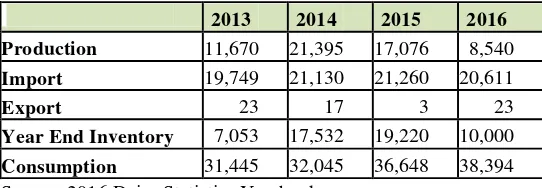
Less expensive NFDM imports and over production of fresh milk resulted in inventories remaining high in 2016. Local NFDM production amounted to 8,540 MT, a 50% decrease from the previous year, while consumption increased. In 2016, NFDM import decreased by 3 percent to 20,611 MT compared to 2015. NFDM is used primarily for bakeries, infant formula and as an ingredient in other dairy products. Since NFDM production is largely a result of marketing quota policies, consumption is expected to continue to track closely with production.
Table 14: NFDM Production, Imports, Consumption by Year Unit: Metric Ton
2013 2014 2015 2016
Production 11,670 21,395 17,076 8,540
Import 19,749 21,130 21,260 20,611
Export 23 17 3 23
Year End Inventory 7,053 17,532 19,220 10,000
Consumption 31,445 32,045 36,648 38,394
Source: 2016 Dairy Statistics Yearbook
Due to the FMD outbreak in November 2010, imports increased to 34,000 MT, jumping by 320 percent over 2010. On March 2011, the Ministry of Strategy and Finance (MOSF) announced a temporary zero duty on 30,000 MT of powdered skim and whole milk powder through the end of 2011 in order to stabilize food prices amid growing inflationary pressures.
Trade:
Table15 : NFDM Tariff and TRQ Schedule on Korea-USFTA implementation HS
Code
Description Base
Rate & quota volume
2012 2013 2014 2015 2016 2017 2018
0402.10 NFDM–In powder, fat content not exceeding 1.5%
176% 176% 176% 176% 176% 176% 176% 176%
Duty free quota 5,000MT
every Year with an additional 3% compound increase
5,000MT
5,000 MT
5,150 MT
5,304 MT
5,463 MT
5,628 MT
5,797 MT
5,971 MT
The method of TRQ allocation is Imports Rights Auction (IRA). The Korea Agro Fisheries & Food Trade Corporation (known as the aT Center), a quasi government agency, processes the auction.
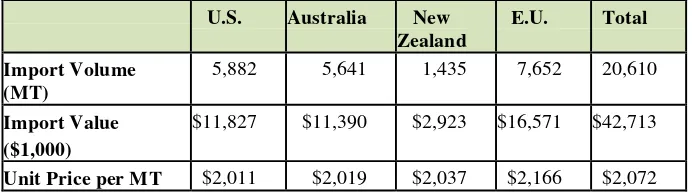
Table 16: NFDM Imports by Country of Origin in 2016 (HS0402.10)
Unit: Metric Tons
U.S. Australia New
Zealand
E.U. Total
Import Volume (MT)
5,882 5,641 1,435 7,652 20,610
Import Value ($1,000)
$11,827 $11,390 $2,923 $16,571 $42,713
Unit Price per MT $2,011 $2,019 $2,037 $2,166 $2,072
Source: Korea Trade Information Service 2017
Marketing:
The Korea Customs Service reimburses the high out-of-quota tariff of 176% to importers when they have re- exported processed dairy-based products made from the imported NFDM. Korean dairy manufacturing companies are looking forward to expanding the market opportunities for exporting to China. Local food processors import NFDM for the purpose of processing into infant formula, bakery use and re-exporting to other countries, including China. However, in 2016, most imported NFDM was used for bakery ingredients and infant formula.
Production, Supply and Demand Data Statistics:
Table 17: NFDM PSD Table
Dairy, Milk, Nonfat Dry 2016 2017 2018
Market Begin Year Jan 2016 Jan 2017 Jan 2018
Korea, Republic of USDA
Official
New Post
USDA Official
New Post
USDA Official
New Post
Beginning Stocks 20 20 20 10 0 6
Production 17 8 16 9 0 9
Other Imports 21 20 25 26 0 35
Total Imports 21 20 25 26 0 35
Total Supply 58 48 61 45 0 50
Other Exports 0 0 0 0 0 0
Human Dom. Consumption
38 38 41 39 0 40
Other Use, Losses 0 0 0 0 0 0
Total Dom. Consumption 38 38 41 39 0 40
Total Use 38 38 41 39 0 40
Ending Stocks 20 10 20 6 0 10
Total Distribution 58 48 61 45 0 50
(1000 MT)
Author Defined:
I. Other Dairy Products
1. Whey Products
Whey is a co-product of cheese and contains lactose, protein, vitamins and minerals which are 50% of the nutrients of the original milk. Diverse whey protein usage across categories such as sports & energy bar, cereals, desserts and ice cream, baby food, bakery goods, and soft drinks continue to be introduced to the market. Whey protein demands are supported by body builders, extreme athletes, everyday active consumers and weight watchers. Whey/dairy proteins are considered as a key ingredient for products that reduce risk for many adult diseases such as bone health, obesity, diabetes and heart diseases.
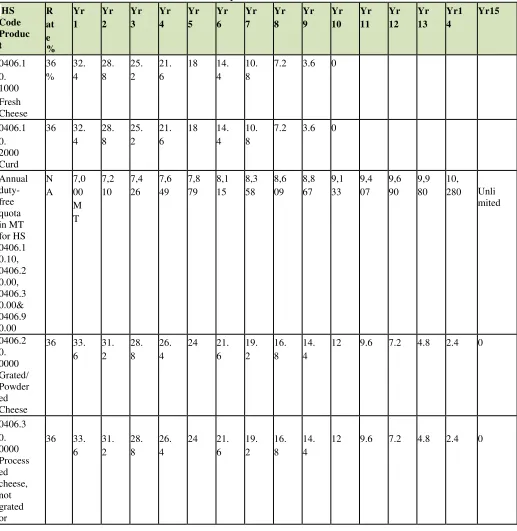
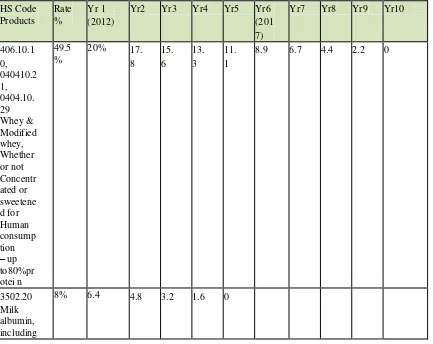
Table 18 : Whey Tariff Schedule on KORUS FTA implementation HS Code
Products
Rate %
Yr 1 (2012)
Yr2 Yr3 Yr4 Yr5 Yr6
(201 7)
Yr7 Yr8 Yr9 Yr10
406.10.1 0, 040410.2 1, 0404.10. 29 Whey & Modified whey, Whether or not Concentr ated or sweetene d for Human consump tion
– up to80%pr otei n
49.5 %
20% 17.
8
15. 6
13. 3
11. 1
8.9 6.7 4.4 2.2 0
3502.20 Milk albumin, including
8% 6.4 4.8 3.2 1.6 0
concentr ates of Two or more whey protein for Human consump tion
–
morethan 80 % protein
0406.10. 10, 040410.2 1,0 404.10.2 9 Whey & modified whey, whether or not Concentr ated or sweetene d for Animal Feed-up to 80% protein
49.5 %
0%
Annual duty-free quota in MT for HS0404. 10f or food– up to 80% protein
NA 3,000
MT
3,0 90
3,1 83
3,2 78
3,3 77
3,47 8
3,5 82
3,6 90
3,8 00
Unlimi ted
The Korea Dairy Industries Association shall administer these TRQs and allocate the in-quota quantity to historical and new importers through a licensing system.
Table 19: Whey Import by Year (0404.10 & 3502.20)
Import Volume 2013 2014 2015 2016
0404.10 (MT) (from U.S. $14,518 -31% market share)
2,007 MT(from U.S. 1,183 MT 59% market share)
2,698 MT (from U.S. 1,506 MT 56% market share)
2,566MT (from U.S. 1,366MT 53% market
*: HS 3502.20 is milk albumin, including concentrates of two or more whey proteins which are a high protein and high value whey product On behalf of infant formula ingredient.
Source: Korea Trade Information Service (KITA)
2. Yogurt Products
In drinking yogurt, premium functional yogurts that include probiotics dominate, such as being beneficial to the intestinal system, liver and stomach, by developing different probiotics. However, probiotics became the norm and consumers would take probiotics in a tablet format on a daily basis, while sales of premium functional drinking yogurt declined. This trend had a strong negative effect on overall yogurt sales.
Among spoonable yogurt categories, the trend towards plain yogurt continued. Under the health and wellness trend,
consumers are shifting to nothing-added plain yogurt that is perceived as more natural instead of flavored. Only plain yogurt maintained healthy current value growth in 2016, rising by 13%. As more consumers looked for plain yogurt as a healthy dessert in cafés or restaurants, foodservice volume sales of plain yogurt increased by 3% in 2016.
Yogurt is mainly distributed through hypermarkets in multipacks, but convenience stores posted the highest value sales growth among store-based channels in 2016. The average unit price of drinking yogurt declined, while spoonable yogurt increased. Korea Yakult maintained its leading position within yogurt with a 43% value share in 2016. Within drinking yogurt, the company maintained a solid leading position with a 62% value. Hypermarkets and convenience stores will continue to be strong distribution channels for yogurt. The average unit prices of flavored, fruited and plain yogurt will increase slightly in the coming years while there will be a decline in the price of drinking yogurt.
3. Ice Cream
Ice cream and frozen desserts decreased by 4% in retail, down to $1,782 million in 2016 and has seen a continuous decline since 2010. To boost sales, manufacturers put effort into developing new products but still dominated by a few leading brands, such as World Cone and Bravo Cone. Soft ice cream and ice cream desserts in foodservice continued to show strong performances. In particular, selling soft ice cream in cafés, cafeterias and food courts in department stores is considered as good business by ice cream manufacturers. The average unit price of ice cream increased slightly in 2016, as convenience stores is showing a strong performance. Under the health and wellness trend, sweet potato flavored ice cream was introduced featuring real sweet potato within dairy ice cream.
increase in volume by 12% within the coming 5 years. Also the average unit price of ice cream and frozen desserts is expected to increase slightly in the coming years. Amongst distribution channels, convenience stores are expected to show a good performance, thanks to the high quality or fun private label impulse ice cream offered by convenience stores.
4. Butter and Margarine Products
Butter and margarine increased by 4% by value in 2016, which was thanks to strong value growth of 5% for butter.
Previously, Korean consumers were not so familiar with using butter for cooking at home, with butter and margarine posting value sales of only $20 million in 2011; however, consumption began to perform strongly after TV cooking shows and fat diet trend created strong interest. Since then, consumer demand for butter continued to increase and imported brands of butter and margarine recorded healthy growth. In Korea, most margarine products are made from palm oil, of which consumers have a negative perception. The imported margarine brands diversified with olive oil margarine and yogurt margarine. Butter and margarine is expected to increase by 2% in coming years. Only butter will continue to post value growth, as the popularity of the high-fat and low-carbohydrate diet continues and more consumers enjoy cooking at home but margarine is predicted to decline, as consumers are aware that margarines made with some vegetable oil include transfats.
Seoul Dairy Cooperative maintained its leading position with a 36% value share of butter and margarine in 2016. Maeil Dairies Co. recorded value sales growth of 9% within butter and margarine in 2016, recording a total value share of 9%.
II. EXPORT REQUIREMENT TO KOREA
:See APHIS’ website (http://www.aphis.usda.gov/regulations/vs/iregs/products/ for any sanitary requirements for shipping dairy products to Korea.
For more information, please contact the U.S. Agricultural Trade Office, U. S. Embassy Seoul, Korea, at
[email protected], Tel:82-2-6951-6845, Fax:82-2-720-7921, or visit www.atoseoul.com