1
THIS REPORT CONTAINS ASSESSMENTS OF COMMODITY AND TRADE ISSUES MADE BY USDA STAFF AND NOT NECESSARILY STATEMENTS OF OFFICIAL U.S. GOVERNMENT POLICY
Date: GAIN Report Number:
Approved By:
Prepared By:
Report Highlights:
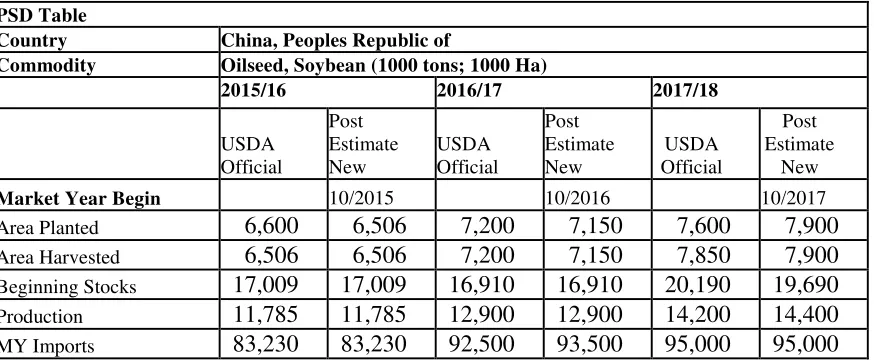
Post’s MY17/18 soybean production forecast is 14.4 million metric tons (MMT), up from the estimated 12.9 MMT in the previous year. The growth in soybean production is a combination of a 10.5 percent acreage expansion mainly due to lower government support for corn and good soybean yield due to favorable weather conditions. However, China’s rising demand for oilseeds continues to outpace the growth in domestic oilseed production. Thus, in MY17/18, Chinese imports of oilseeds are forecast to grow to another record at 99.8 MMT, up by 1.3 MMT over the previous year estimate. In MY17/18, soybean imports continue to be China’s largest oilseed import with total forecast imports of 95 MMT, up from the 93.5 MMT in MY16/17. Forecast economic growth of higher than 6.7 percent in 2017, and the rapid modernization of China’s domestic animal farming and feed sectors continue to boost oilseed products consumption. However, the rapid soybean import growth seen in MY16/17 is expected to level off in MY17/18. This is based on a forecast average growth in soybean meal demand, relatively high carry in stocks, and a higher domestic soybean production.
Jennifer Clever Michael Ward
Historic Spike in Net Imports in MY16/17 likely to temper
China’s Soybean Imports in MY17/18
Oilseeds and Products Update
China - Peoples Republic of
CH17055
10/28/2017
2 Executive Summary:
Post’s MY17/18 soybean production forecast is 14.4 million metric tons (MMT), up from the estimated 12.9 MMT in the previous year. The growth in soybean production is a combination of a 10.5 percent acreage expansion mainly due to lower government support for corn and good soybean yield due to favorable weather conditions. However, China’s rising demand for oilseeds continues to outpace the growth in domestic oilseed production. Thus, in MY17/18, Chinese imports of oilseeds are forecast to grow to another record at 99.8 MMT, up by 1.3 MMT over the previous year’s estimate. In MY17/18, soybean imports continue to be China’s largest oilseed import with total forecast imports of 95 MMT, up from the 93.5 MMT in MY16/17.
China’s forecast economic growth of more than 6.7 percent in 2017, and the rapid modernization of the Chinese animal farming and feed sectors continue to encourage oilseed product consumption. In
particular, soybean meal and compound feed have been driven by expanded animal production in large-scale farms (mainly swine). Since 2016, the Chinese government enforcement of environmental policies banning animal farming in certain regions has forced the closure of small scale/household farms. In addition, soybean meal use is up partly because of a lower-than-estimated rapeseed meal supply, and significantly lower imports of distiller-dried grains (DDGS) as a result of China’s high anti -dumping duties on U.S. imports imposed since January 2017. A significant increase in the total Chinese oilseed acreage and production is unlikely to realize mainly due to limited arable land and
comparatively low productivity.
The rapid soybean import growth seen in MY16/17 is expected to level off in MY17/18. This is based on a forecast average growth in soybean meal demand, relatively high carry in stocks, and higher domestic soybean production.
It is important to note that forecasting China’s meal and oil use, and total oilseed demand remains a challenge given the difficulties in collecting data. Each part of the Chinese oilseed industry chain is comprised of a massive number of players. This is particularly true with data pertaining to rapeseed and peanut area and production; soybean use as food or feed; feed and livestock production; and the
unknown volume of soybean and vegetable oils reserves.
3
Production
Post’s forecast for MY17/18 soybean production is 14.4 MMT, up 1.5 MMT from MY16/17, and based on a forecast 10.5 percent increase in planted area and a relatively high yield. Post’s forecast
production, the highest since MY12/13, is slightly higher than the USDA October 2017 official forecast of 14.2 MMT. The forecast recovery in soybean area to 7.9 Million Hectares (MHa) is mostly due to reductions to the government’s support for grain production, which lowered corn profits in MY16/17 and encouraged some farmers to switch from planting corn to soybeans in MY17/18.
As previously reported, since MY15/16, the government prescribed a lower purchase price for corn, which cut corn earnings. Conversely, the government’s “target price-based direct subsidy” for soybeans continued in MY16/17 in the four Northeastern Provinces. Soybean farmers in these provinces were compensated based on the difference between the market price and the target price and resulted in relatively stable soybean earnings.
In MY17/18, the Chinese government implemented a “market-oriented soybeans price plus a direct subsidy to soybean farmers.” This generally continues to ensure that farmers will receive a subsidy for soybean planting during MY17/18. Meanwhile, the government adjusted its corn support policy which would reduce corn earnings in MY17/18.
Chart 1- China’s Soybean Production Estimates by Major Sources (MMT)
14.94 14.4
Source: MOA, CNGOIC, HLJ Industry and ChinaJCI
4 previous year. Most notably, the acreage for Heilongjiang surged 34 percent to 3.49 MHa from the previous year.
MOA reports that in MY17/18, weather conditions remained favorable in general in most of the soybean-growing regions. Specifically, from September through October, the weather conditions continued to be favorable for soybean maturation and harvest in the major soybean-planting regions. Soybean quality is also better than the previous year and yield is up to 1,823 Kg/Ha, up from the 1,796Kg/Ha in MY16/17.
Despite the difference in estimates for basic acreage and production for MY16/17, all major sources agree on increases in soybean acreage, yield and production for MY17/18. Domestic soybean prices in MY17/18 started low and have continued declining since harvest began in September of this year. Increased supplies in the market as a result of higher domestic output and large import volumes are likely pressing down domestic prices.
Industry sources report that as of mid-October, the government had begun to distribute the direct subsidy to soybean and corn farmers based on the certified acreage in the Northeast Provinces. In Heilongjiang Province, the subsidy rate was reportedly RMB2,600/Ha (or $400) for soybeans and RMB2,000/Ha ($308) for corn in. According to media reports, the subsidy rate was lower in Jilin Province. For example, in Dunhua City the rate was RMB2,488/Ha (or $383) for soybeans, and RMB1,458/Ha (or $224) for corn. In a September field survey conducted by an industry source, farmers complained the soybean subsidy rate was too low and that a reasonable rate should be equivalent to 2.2 to 2.8 times of that for corn. Based on the current marketing prices (at about
RMB3,700 or $569/MT for crushing or RMB4,000 or $615/MT for food use) and the subsidy rate for corn and soybeans, farmers are expected to receive lower profits from soybeans (per acreage) than corn in MY17/18. In an effort to stabilize market, during the second week of October, China’s State-owned Grain Corp began to purchase soybeans from farmers in Heilongjiang Province for state reserves at about RMB3,800/ton. This rate is higher compared to the average market price of RMB3,700/ton. According to industry sources, the intended purchase volume is 0.6 MMT. This purchase together with the distribution of subsidies should maintain farmer’s confidence in soybean planting.
Stocks
Total soybean ending stocks are forecast to reach 20.1 MMT at the end of MY17/18, up from the 19.7 MMT at the end of MY16/17. Soybean stocks were driven by the rapid increase in soybean imports during MY16/17. Stocks are likely to stay at high levels in MY17/18 and beyond given the need to meet the increasing domestic crushing demand and consumption together with the government’s willingness to maintain an unknown volume of soybean reserves.
Given China’s almost 90 percent dependence on imported soybeans, the government’s state soybean reserve program is expected to continue. In order to regulate the market’s supply/demand, the
government rotates the state soybean reserve from time to time. However, its role appears to be limited. The recent sales of state soybean reserve began on September 29. Out of the 300,000 tons of stored soybeans auctioned (2010, 2012 and 2013 crop), 71.8 percent or 215,469 tons were sold. The purchased price averaged RMB3,140 or $483/ton, compared to average price of imported soybeans of about
5 purchased 120 tons. The last scheduled auction was held on Oct 27. Sales will then be suspended to make way for the new available crop of domestic soybeans. The low auction price is reportedly due to the buyers’ concern about the quality of stored soybeans. The impact of these recent sales to the market is considered minimal.
Based on industry sources, China sold about 1.7 MMT of soybean reserves in mid-2016. By the end of 2016, sales reduced the government’s soybean reserves to about 4.4 MMT. As of this report, the total government soybean reserve is estimated at 4.1 MMT.
Chinese official statistics for stocks are not publicly available. While the government has suspended direct purchases of domestic oilseeds since MY14/15, it continues to maintain some state soybean reserves. In recent years, it is likely that soybeans imported by some state-owned companies may have contributed to the state reserves. For example, industry sources report that 25,000 tons of soybeans imported from Uruguay were added to the state reserve warehouse located in Liaoning Province in the Northeast China in September 2017. As such, the government soybean reserve could be above 4.1 MMT given the unknown volume of imported soybeans likely added to the state stockpiles. The government’s oilseed and vegetable oil reserves program further complicates the analysis and forecast of China’s oilseed and product market.
Trade
MY17/18 soybean imports are forecast to set another record at 95 MMT, up from the 93.5 MMT in MY16/17. The rapid soybean import growth seen in MY16/17 is expected to level off in MY17/18. This is based on a forecast average growth in soybean meal demand, relatively high carry in stocks, and a higher domestic soybean production. In MY16/17, Chinese buyers added over 10 MMT of soybean imports compared to the previous year. This is the second highest yearly net import growth in history. This rapid increase in imports is mainly driven by China’s robust consumption of soybean meal in MY16/17 resulting from the expansion of scale animal farming facilities (see Meal Section below); low supplies of other protein meals including rapeseed meal (see Rapeseed section), cottonseed meal, and feed mills switches from DDGS to soybean meal due to the imposition of anti-dumping and
countervailing duties on imported U.S. DDGS. Soybean imports were also fueled by the government’s 2 percentage reduction to its Value Added Tax (VAT) since July 2017. In MY16/17, soybean imports could have exceeded 93.5 MMT if Chinese buyers had not resold about half a million tons of soybean imports to other countries in mid-2017.
6 95 MMT soybean imports forecast for MY 17/18 can sufficiently keep pace with the growth in the demand for soybean meal. Forecast MY17/18 soybean crushing is 93 MMT, up 4.5 MMT from MY16/17.
China 2-China’s Soybean Crushing Estimates (MMT/MY)
Note: ChinaJCI.com data is updated to September 2017
It is worth noting that in recent years, China’s use of soybeans for protein (for food) is reportedly 1.5 MMT and likely to grow to 1.7 MMT in MY17/18. Use of processed whole soybeans for feed has also increased although data is not readily available.
China’s soybean exports, mostly destined for traditional food use, are forecast at 150,000 tons for MY17/18. This export volume is slightly up from the estimate in MY16/17 but still insignificant to China’s soybean complex.
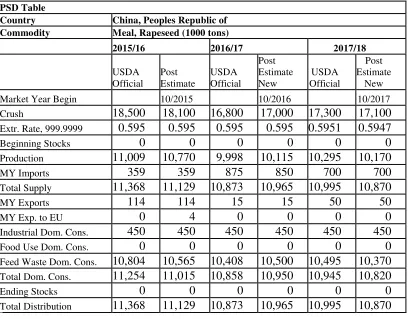
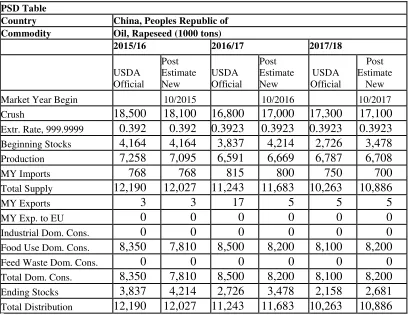
Rapeseed
Over-reported rapeseed production partially drives soybean imports
Post forecasts MY17/18 rapeseed production to fall to 13.1 MMT based on a 3 percent acreage decrease compared to the previous year. The area decline is in response to lower profits and the abolishment of the government’s price support since 2015. Post’s forecast for MY17/18 rapeseed production supports the October USDA official forecast but remains lower than the CNGOIC’s forecast data of 14.3 MMT. Post’s estimate for MY16/17 rapeseed production is 13.5 MMT, supporting the October USDA official estimate, but still lower than the NSB’s estimate of 14.55 MMT.
7 Chart 3 - China’s Official Rapeseed Production (MY13/14 to MY17/18; in MMT)
Source: NSB; Note: Autumn harvested production refers to combined rapeseed production by
Inner Mongolia, Gansu, Qinghai, Xinjiang, Tibet and Ningxia; MY17/18 is based on CNGOIC; MY16/17 Autumn harvested number is the FAS/Post estimate
Since MY12/13, the gap between the NSB and the industry rapeseed production estimate has increased significantly, with an average annual difference of more than 5 MMT. An independent source continues to estimate an extremely low production of 5.22 MMT for MY16/17 based on firsthand anecdotal market information from farmers and crushers. Its forecast production for MY17/18 will further slide to 5.13 MMT. Post believes the production data gap exists but might not be as large as 5 MMT per year. As household rapeseed crushing gains popularity in the large rapeseed-producing provinces such as Hubei and Sichuan, large crushing plants are increasingly facing a shortage of rapeseed to meet their crushing capacity. This adds a challenge to industry sources collecting data and developing estimates.
Post’s field visit to Hubei and Hunan in mid-July showed the MY17/18 rapeseed production is down in Hunan and Hubei. Low rapeseed production has driven price up and expedited the marketing of the new crop. Rapeseed yield is slightly up mainly due to favorable weather conditions during the harvest season. In recent years, the strong demand for rapeseed oil with its original flavor (crude rapeseed oil/not refined) has stimulated household crushing. Additionally, low profits from rapeseed farming not only forced some farmers to abandon rapeseed planting but also encouraged them to crush the seeds locally and retain the rapeseed oil for home use. Only in the event that there is extra rapeseed oil, will the oil be sold locally at a premium. This is due to the local consumer preference for original crude oil flavor over the flavor of refined oil sold at the supermarkets. Additionally, local villagers expressed doubt on the safety and purity of the refined oils. Rapeseed cake is generally marketed locally as a feed ingredient and only rarely marketed as fertilizer.
8
Trade
Rapeseed imports in MY17/18 are forecast to recover to 4.3 MMT from the estimated 4.25 MMT in MY16/17. In light of the forecast decline in domestic production in MY17/18 and the excess crushing capacity, rapeseed imports are expected to recover moderately in MY17/18 to meet domestic demand for rapeseed products and to satisfy the domestic crushing capacity.
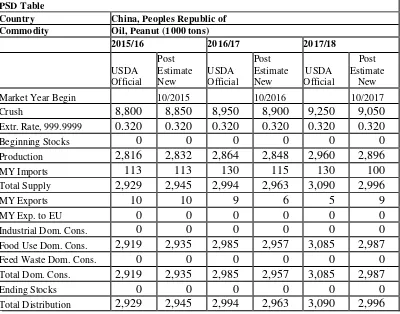
Peanuts
MY17/18 peanut production hits another record
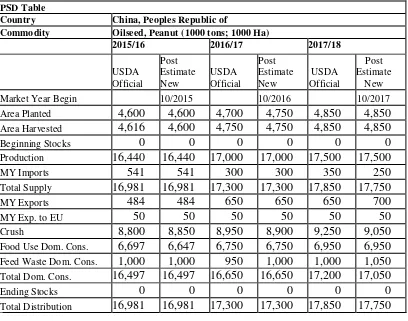
In MY17/18, China’s peanut production is forecast to hit another record at 17.5 MMT, up from the estimated 17 MMT in MY16/17. China’s official peanut production number is 17.29 MMT for MY16/17. In its October report, CNGOIC maintained its previous forecast of MY17/18 production of 18.1 MMT based on a 4.2 percent acreage growth to 4.95 MHa. Driven by strong domestic demand for peanut products, peanut farming has been the most profitable crop in many peanut-producing provinces (namely Henan, Shandong, Hebei and Liaoning). Peanut area is also partially boosted by the
government’s reduced support for corn in these provinces since 2015. MOA’s October report indicated that the September weather conditions in most peanut-growing provinces remained good for peanut maturation and harvest. However, excessive rainfall was reported in part of Henan Province since late September likely impacting peanut quality.
However, some industry insiders have lower estimates for MY16/17 production. An independent source made a much lower production estimate of 10.8 MMT for MY16/17 and a forecast of 12 MMT for MY17/18. Industry traders speculate that during the past two marketing years, higher domestic peanut prices may be indicative of a lower actual peanut production than what is officially reported.
That said, industry sources also report that the current peanut price hit the lowest level of the last five years. Correspondingly, peanut farmers’ income is expected to fall which then may impact peanut area and trade in the next year.
Trade
Anticipating a large domestic crop at a low price, MY17/18 imports are forecast at 250,000 tons, down from the estimated 300,000 tons for MY16/17. Peanut imports reached a record of 541,000 tons in MY15/16 primarily due to favorable prices for imported peanuts. Imports of peanuts for food use remain low due to sufficient domestic supplies. Peanut oil imports are forecast at 100,000 tons for MY17/18, slightly down from MY16/17 (equivalent to 315,000 tons of in-shell peanuts).
Peanut imports remain a small volume compared to China’s large domestic production. Peanut imports are highly affected by domestic production and price. Forecast MY17/18 peanut production is at a historical high of 17.5 MMT. However, the price is lower compared to previous years. As mentioned above, data from an independent source shows the current peanut price hit the lowest point in the last five years. This will restrict imports while potentially stimulating peanut exports in MY17/18.
9 duty when shipping to China. Despite this preferential access and given China’s rising peanut
production, peanut imports could fall significantly if the price gap between domestic and global prices fails to offset the transportation cost and the value added tax.
Chinese peanut exports are expected to be 700,000 tons in MY17/18 from the estimated 650,000 tons in MY16/17. An increase in production and a decline in price may strengthen exports in search for better profits. Major market destinations for Chinese peanuts exports are Japan, Korea, and ASEAN
countries.
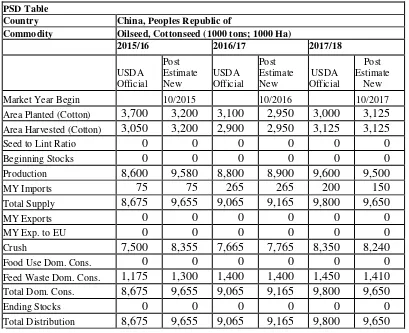
Cottonseed production is up to 9.5 MMT in MY17/18
Cottonseed production in MY17/18 is forecast at 9.5 MMT, up from the estimated 8.9 MMT in the previous year. Post’s forecast for MY17/18 cotton production is 5.36 MMT, up 7.1 percent over the previous year. This forecast is based on updated information received from all industry sources, a forecast area increase of 5.9 percent, and expected good yield. MY17/18 cotton acreage recovered in response to an increase in domestic cotton prices and improved profits in MY16/17.
In its September market report, the China Cotton Association (CCA) raised its production forecast for MY17/18 to 5.47 MMT, up 10.2 percent over MY16/17, and higher than its previous data of 5.42 MMT. MOA’s October forecast for MY17/18 production is 5.35 MMT, up 11 percent compared to MY16/17 and up from its previous data of 5.28 MMT. The higher production is the result of a 6.2 percent growth in acreage and a 4.5 percent yield gain compared to the previous year. MOA’s yield is based on favorable temperature and sunshine during the month of September that facilitated cotton maturation in the Yellow River region and Xinjiang. Further, the reported relatively high moisture since late September in the Yellow River and the Yangtze River regions may have a limited impact on cotton quality.
Protein Meal Situation and Outlook
Protein meal consumption stays robust
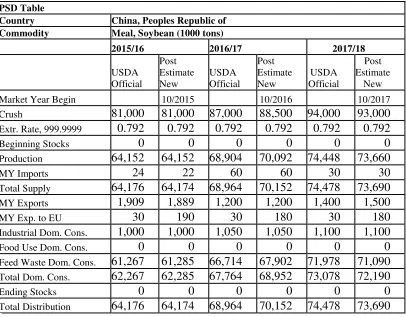
Post’s forecast China’s demand for protein meal continues to rise in MY17/18 from the high level in MY16/17. Post estimate of MY16/17 China’s soybean meal use for feed is 67.9 MMT, up 6.6 MMT from the previous year and forecast MY17/18 use continues to rise to 71.1 MMT.
10 reported that in July feed production for these mills is up 10 to 20 percent and even 50 percent for one mill compared to the previous year. MOA expected swine and poultry feed production to recover during the second half of 2017 despite a survey showing a slight fall in total feed production from January to June in the major feed mills.
In general, high GDP growth (up 6.7 percent in 2016 and even higher in 2017) and the corresponding increase in per capita disposal income encourage demand for more and better quality animal products (see China Oilseeds Annual Report). The growing animal farming sector needs more industrial feed with increasing utilization of protein meal in the ration. Moreover, soybean meal consumption was driven up dramatically in MY16/17 as a result of expansion of scale animal farming facilities. Since early 2016, thousands of small-scale animal farms/households were closed or relocated in the regions where animal farming was banned as a result of the government’s enforcement of an ecological and environmental protection plan. Compound feed consumption and the soybean meal inclusion rate increased rapidly. Low supply of other protein meals including rapeseed meal (see Rapeseed section) and cottonseed meal and DDGS forced feed mills to raise the soybean meal inclusion rate. Additionally, good swine profit resulting from an increase in pig slaughter weight (to gain more profit/head) also raised the feed conversion rate and feed consumption.
Expanded scale swine farming demands more soybean meal
Post’s forecast pork production in 2018 will increase slightly to 54.1 MMT from the 53.5 MMT. The sow herd replenishment will continue in 2018 (see 2017 China Livestock and Products Annual). High swine profits since late 2015 stimulated the swine inventory to recover in MY16/17. Swine profits remained high in first months of MY16/17 and continue to be attractive at about RMB280 ($43)/head in October 2017.
Chart 4 - Swine Profit Margins (Oct 2015 to Oct 2017; RMB/Head)
357 425
629 702 648 547
482
348 318 287 298 307 280
0 200 400 600 800 1000 1200
Oct Nov Dec Jan Feb Mar Apr May Jun Jul Aug Sep
MY15/16 MY16/17 MY17/18
11 Based on the National Statistics Bureau (NSB), during the first nine months of 2017, pork production stands at 37.17 MMT, up 0.7 percent from the previous year. Total meat production is also up 0.8 percent from the previous year. In the first eight months of 2017, MOA data shows total slaughtered pigs in MOA-monitored slaughterhouses stood at 140.65 million head, up 6.7 percent over the previous year. For the rest of 2017, swine inventory will maintain its moderate recovery and swine profits are expected to stabilize at the current levels.
However, NSB data also indicates the size of China's swine inventory fell, 0.8 percent from the same period last year, to 427.97 million. Meanwhile, MOA reports the September inventory for swine and sow are both down 6.1 percent and 5 percent, respectively.
The contradictory official numbers reflect the complexity of statistics when the local governments responded to the “environmental storm” campaign that requested the closure of small scale/households located in the “banned regions.” China’s “13th Five Year Ecological and Environmental Protection Plan” stipulates the completion of closures of all animal farms/households in the regions where the animal farming is banned.
Chinese media reported that as of July 2017, 10 provinces enforced the “banned region” policy which likely reduced yearly swine production by up to 20 million head. For instance, since 2016, Jiangsu Province closed or relocated about 8,000 pig farms. Since 2014, Zhejiang Province closed or relocated about 70,000 animal farms, while Fujian Province demolished 13,000 swine farms/households in second half of 2015. By August 2016, 25,000 swine farms/households were closed or relocated in Guangdong Province, impacting 3.15 million head of swine inventory. On the other hand, large companies
continued expansion. The Wen’s Group is reported to have added 6 million heads of swine production capacity with 4.5 million head in operation as of September 2017. The Group is expected to maintain 10 percent growth yearly in total number of slaughtered pigs. Additionally, according to monitored
villages/farms in September 2017, in the regions encouraged to raise pigs such as Shaanxi Province, swine and sow inventories both increased 2.9 and 3.3 percent, respectively. In consideration of the consistent good swine profits since 2015, sows in the “banned regions” are mostly relocated to
farms/households located in regions where the government’s development plan allows animal farming.
High investment in scale swine farming drives demand for compound feed
In addition to the expansion of production capacity by existing swine farming facilities, new investment in scale swine farms continues to be robust since 2016 in response to good swine profits and make up the production capacity fall due to closure of small scale/household farms. Based on industry statistics, total investment in animal farming by publicly traded agricultural companies surged to RMB49 billion ($7.2 billion) in 2016, ten times that of 2015. Out of the total, 84.5 percent ($6.1 billion) focused on swine farming with 153 newly added swine facilities located in 22 provinces and a small investment in Vietnam. It is estimated that 79 percent of these investments adopted a “company + swine
12 Chart 5 – 2016 China Swine Investment by Stock-Listed Companies
(Top 8 Provinces in Receiving Investment; in $ million)
Source: chinafeed.org.cn
The investment boom in swine farming should upgrade the industry in the long term. However, in response to a “blind ban” on animal farming in some regions, MOA stressed that closures should comply with relevant development plans and farmers should be compensated. Additionally, technical solutions should be adopted to reduce pollution instead of closing farms. In general, the impact of animal farm closures on feed production appears to be limited as existing or newly operational farming facilities outside of the “banned regions” are quickly making up the gap through expansion. However, the large expansion of swine farming in Inner Mongolia does raise concerns regarding waste
management in the region due to its tight water resources.
Expanding aquaculture production continues use more feed
China’s aquaculture sector continued to grow in first three quarters of 2017 with production of cultured aquatic products hitting 25.24 MMT, up by about 4.8 percent over the same period in 2016. Conversely, wild catch production declined by 3 percent on limited fishery resources both home and abroad.
Declining wild catch aquatic products are being replaced by more cultured products entailing higher demand for aquatic feed. According to MOA, expecting steady growth in demand for aquatic products, China’s aquaculture farms increased 32.6 percent of fingerlings in the first eight months of 2017. In the first three quarters of 2017, the selling price for aquatic products increased moderately. Similarly, total sales value is up more than 4 percent for the 26 MOA-monitored large aquatic wholesale markets compared to the previous year. MOA expected total aquatic production to reach 52.7 MMT in 2017, up 3 percent from the previous year. The gain in aquatic production stems fully from an increase in aquaculture farming.
13
Source: MOA and the data for 2017 is Post Estimate
Poultry feed use expected to grow moderately
China’s poultry sector is expected to grow steadily in 2017 and beyond. This growth is generally expected to meet a steady growing demand for poultry products. Soybean meal based compound feed remains a key factor for productivity and efficiency of China’s highly developed poultry sector.
During the first months of 2017, the Chinese poultry industry experienced consecutive losses due to declining egg and meat prices. The decline in prices was primarily due to the quick production
expansion started in late 2016 that resulted in an oversupply of poultry products during the first months of 2017. Additionally frequent disease outbreaks impacted poultry meat and egg consumption. MOA data shows egg prices rebounded in June in response to high temperatures in some of the Southern and Northern poultry-producing provinces. Egg prices reached a three year high in the first half of
September but have since fallen. That said, the mid-October price is still 8.6 percent higher than the previous year.
Conversely, poultry meat prices remained low. MOA statistics show the broiler meat price in mid-October is 2.1 percent lower than the previous year. NSB reported that in the first three quarters of 2017, the total meat production (swine, beef, mutton and poultry) is 58.77 MMT, up 0.8 percent from the previous year. Although there is no specific data, NSB statistics imply that poultry meat production the first three quarters of 2017 is likely more than 0.8 percent above the previous year. Chinese industry analysts regard both layer and broiler sectors as generally “matured” in terms of scale farming and feeding models, thus the production will keep pace with a stable demand growth along with increases in consumer’s income and population.
Soybean meal use grows to compensate for lower supplies of other protein materials
14 duty and value added tax rate of up to 91.26 percent of the CNF price. As a result, China’s DDGS imports will fall dramatically in 2017 to an estimated 500,000 tons from the previous three-year average of over 5 MMT. This is equivalent to about 1 MMT less of protein supply. This gap in the domestic protein supply will need to be replaced mostly by soybean meal. Soybean meal consumption will also be driven by lower-than-actual supplies of other protein meals (namely rapeseed meal).
Chart 7 - China’s DDGs Imports Plummeted (2014-2017; in 1,000 tons)
Source: Global Trade Atlas and 2017 data forecast by Post
Protein meal trade
The Post forecast for MY17/18 soybean meal exports are 1.5 MMT, up from the estimated 1.2 MMT in MY16/17. Protein meal trade remains unstable. Sporadic imports/exports of some protein meals will continue in the foreseeable future. Both feed mills and crushing plants may choose to trade between nearby countries rather than domestic provinces to regulate the regional supply and demand. The difference in market prices, cost effectiveness, and more importantly, ease of transport are factors impacting trade decisions. With the exception of soybean meal exports, the total trade volume for other oilseed meals is expected to be insignificant in China’s huge protein meal matrix.
Fish meal imports continue to be mainly driven by the expansion of the aquaculture sector with imports estimated at 1.4 MMT in 2017, which will likely fall to average level of 1.1 MMT in 2018. Imports remain strong in 2017 given the relatively adequate supply and low price. A smaller-than-expected domestic fishmeal production in 2017 is also encouraging more fishmeal imports. In addition to the increased imports from China’s traditional large supplier, Peru, imports from new suppliers such as Ecuador, Mauritania, and Denmark grew rapidly in the first eight months of 2017. Imports can be highly impacted by the fishmeal availability in major supplying countries and the fish meal price as compared to soybean meal. Post forecast fish meal imports to stay at an average level of 1.1 MMT in 2018 given uncertain global supply.
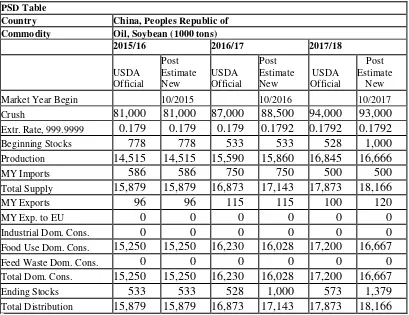
15 Post’s MY17/18 forecast for China’s vegetable oil production is 28 MMT based on an increase in use of imported soybeans and rapeseed for crushing. Soybean oil will continue to be the primary vegetable oil in China, accounting for 59.4 percent of total oil production. In MY17/18, domestic consumption of oil for food use is forecast to grow 2.9 percent from MY16/17 to 33.2 MMT.
Consumption of vegetable oils generally continues to be driven by a forecast 6.7 percent or above economic growth in 2017 together with higher population growth (as changes in Chinese policy allowed a second child per couple in 2016).
NSB statistics show that during the first nine months of 2017, China’s catering sales value continued growing strong with an increase of 11 percent compared to the previous year. A previous industry analysis indicated strong growth in less developed provinces compared to developed regions such as Beijing, Shanghai and Guangdong Province whose growth rate ranged from 7 to 8 percent in the first half of 2017. Due to China’s continuous urbanization, dining out is increasingly popular and is characterized by a rapid increase in snack meals and rising online ordering and delivery. China’s industry sources estimate that total catering sales will exceed RMB 3.9 trillion ($600 billion) in 2017, up from RMB3.58 trillion ($543 billion) in 2016. The catering sector growth supports more use of edible oils particularly soybean oil.
Also, during the first months of 2017, industry sources report that China’s instant noodle sector
production, known to use large volumes of palm oil, is recovering. From 2014 to 2016, instant noodle production declined during mainly due to consumers’ increased choices for take-out and more
nutritional foods.
In its October report, MOA’s forecast for MY17/18 total vegetable oil consumption stood at 31.86 MMT, up 180,000 tons over the previous year. For comparison, CNGOIC’s October forecast for MY17/18 vegetable oil consumption (as food use) is 34.85 MMT, up 1.8 MMT, or 5.4 percent from its MY16/17 estimate of 33.05 MMT. Additionally, CNGOIC’s MY17/18 forecast for industrial use of vegetable oils (mainly soy oil and palm oil) is 3.83 MMT compared to the 3.63 MMT estimate for MY16/17.
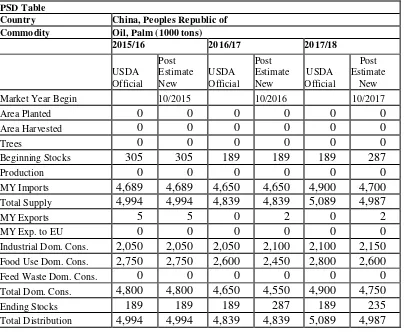
Forecast MY17/18 total oil imports are 6.99 MMT, slightly down from the 7.23 MMT in the previous year. Palm oil continues to dominate China’s vegetable oil imports and is forecast to stay stable at 4.7 MMT in MY17/18, slightly up from the 4.65 MMT in MY16/17.
16
Palm Oil
MY17/18 palm oil imports are forecast at 4.7 MMT, slightly up from the estimated 4.65 MMT in MY16/17. This level is higher than MY15/16 as a result of increased global supplies leading to more favorable prices.
As mentioned above, China’s food processing industry uses large amounts of palm oil in processed foods, especially instant noodles. Instant noodle production is reported to have a moderate recovery this year after continuously falling for the last three years. Industry sources stated that the instant noodle production and consumption both increased as a result of upgraded product quality which re-attracted consumers in 2017. In the first months of 2017, several large instant noodle brands reported growth in production of high-end products (more balanced in nutrition and value added). Palm oil for food use is increasingly challenged by adequate availability of other vegetable oils at acceptable prices.
Statistics Tables
Commodity Oilseed, Soybean (1000 tons; 1000 Ha)
2015/16 2016/17 2017/18 Beginning Stocks 17,009 17,009 16,910 16,910 20,190 19,690
17
Total Supply 112,024 112,024 122,310 123,310 129,390 129,090 MY Exports 114 114 120 120 150 150 MY Exp. to EU 10 10 10 10 10 11 Crush 81,000 81,000 87,000 88,500 94,000 93,000 Food Use Dom. Cons. 11,100 11,100 11,500 11,500 12,000 12,000
Feed Waste Dom. Cons. 2,900 2,900 3,500 3,500 3,600 3,800 Total Dom. Cons. 95,000 95,000 102,000 103,500 109,600 108,800 Ending Stocks 16,910 16,910 20,190 19,690 19,640 20,140 Total Distribution 112,024 112,024 122,310 123,310 129,390 129,090
18 Table 2. Rapeseed
PSD Table
Country China, Peoples Republic of
Commodity Oilseed, Rapeseed (1000 tons;1000 Ha)
2015/16 2016/17 2017/18
USDA Official
Post Estimate New
USDA Official
Post Estimate New
USDA Official
Post Estimate
New Market Year Begin 10/2015 10/2016 10/2017 Area Planted 0 7,300 0 7,000 0 6,800 Area Harvested 7,534 7,300 7,000 7,000 6,800 6,800 Beginning Stocks 1,499 1,499 1,340 1,109 1,590 1,259 Production 14,931 14,300 13,500 13,500 13,100 13,100 MY Imports 4,011 4,011 4,150 4,250 4,300 4,300 Total Supply 20,441 19,810 18,990 18,859 18,990 18,659
MY Exports 1 1 0 0 0 0
MY Exp. to EU 0 0 0 0 0 0
Crush 18,500 18,100 16,800 17,000 17,300 17,100 Food Use Dom. Cons. 0 0 0 0 0 0 Feed Waste Dom. Cons. 600 600 600 600 600 600 Total Dom. Cons. 19,100 18,700 17,400 17,600 17,900 17,700 Ending Stocks 1,340 1,109 1,590 1,259 1,090 959 Total Distribution 20,441 19,810 18,990 18,859 18,990 18,659
19 Table 3. Peanuts
PSD Table
Country China, Peoples Republic of
Commodity Oilseed, Peanut (1000 tons; 1000 Ha)
2015/16 2016/17 2017/18
USDA Official
Post Estimate New
USDA Official
Post Estimate New
USDA Official
Post Estimate
New Market Year Begin 10/2015 10/2016 10/2017 Area Planted 4,600 4,600 4,700 4,750 4,850 4,850 Area Harvested 4,616 4,600 4,750 4,750 4,850 4,850
Beginning Stocks 0 0 0 0 0 0 Production 16,440 16,440 17,000 17,000 17,500 17,500 MY Imports 541 541 300 300 350 250 Total Supply 16,981 16,981 17,300 17,300 17,850 17,750 MY Exports 484 484 650 650 650 700 MY Exp. to EU 50 50 50 50 50 50 Crush 8,800 8,850 8,950 8,900 9,250 9,050 Food Use Dom. Cons. 6,697 6,647 6,750 6,750 6,950 6,950 Feed Waste Dom. Cons. 1,000 1,000 950 1,000 1,000 1,050 Total Dom. Cons. 16,497 16,497 16,650 16,650 17,200 17,050
Ending Stocks 0 0 0 0 0 0
Total Distribution 16,981 16,981 17,300 17,300 17,850 17,750
20
Commodity Oilseed, Cottonseed (1000 tons; 1000 Ha)
21 Meal PSD Tables
Table 5. Soybean Meal
PSD Table
Country China, Peoples Republic of
Commodity Meal, Soybean (1000 tons)
2015/16 2016/17 2017/18
USDA Official
Post Estimate New
USDA Official
Post Estimate New
USDA Official
Post Estimate
New Market Year Begin 10/2015 10/2016 10/2017 Crush 81,000 81,000 87,000 88,500 94,000 93,000 Extr. Rate, 999.9999 0.792 0.792 0.792 0.792 0.792 0.792 Beginning Stocks 0 0 0 0 0 0 Production 64,152 64,152 68,904 70,092 74,448 73,660 MY Imports 24 22 60 60 30 30 Total Supply 64,176 64,174 68,964 70,152 74,478 73,690 MY Exports 1,909 1,889 1,200 1,200 1,400 1,500 MY Exp. to EU 30 190 30 180 30 180 Industrial Dom. Cons. 1,000 1,000 1,050 1,050 1,100 1,100 Food Use Dom. Cons. 0 0 0 0 0 0 Feed Waste Dom. Cons. 61,267 61,285 66,714 67,902 71,978 71,090 Total Dom. Cons. 62,267 62,285 67,764 68,952 73,078 72,190
Ending Stocks 0 0 0 0 0 0
Total Distribution 64,176 64,174 68,964 70,152 74,478 73,690
22 Table 6. Rapeseed Meal
PSD Table
Country China, Peoples Republic of
Commodity Meal, Rapeseed (1000 tons)
2015/16 2016/17 2017/18
USDA Official
Post Estimate
USDA Official
Post Estimate New
USDA Official
Post Estimate
New Market Year Begin 10/2015 10/2016 10/2017 Crush 18,500 18,100 16,800 17,000 17,300 17,100 Extr. Rate, 999.9999 0.595 0.595 0.595 0.595 0.5951 0.5947
Beginning Stocks 0 0 0 0 0 0 Production 11,009 10,770 9,998 10,115 10,295 10,170 MY Imports 359 359 875 850 700 700 Total Supply 11,368 11,129 10,873 10,965 10,995 10,870 MY Exports 114 114 15 15 50 50
MY Exp. to EU 0 4 0 0 0 0
Industrial Dom. Cons. 450 450 450 450 450 450 Food Use Dom. Cons. 0 0 0 0 0 0 Feed Waste Dom. Cons. 10,804 10,565 10,408 10,500 10,495 10,370 Total Dom. Cons. 11,254 11,015 10,858 10,950 10,945 10,820
Ending Stocks 0 0 0 0 0 0
Total Distribution 11,368 11,129 10,873 10,965 10,995 10,870
23 Oils PSD Tables
Table 7. Soybean Oil
PSD Table
Country China, Peoples Republic of
Commodity Oil, Soybean (1000 tons)
2015/16 2016/17 2017/18
USDA Official
Post Estimate New
USDA Official
Post Estimate New
USDA Official
Post Estimate
New Market Year Begin 10/2015 10/2016 10/2017 Crush 81,000 81,000 87,000 88,500 94,000 93,000 Extr. Rate, 999.9999 0.179 0.179 0.179 0.1792 0.1792 0.1792 Beginning Stocks 778 778 533 533 528 1,000 Production 14,515 14,515 15,590 15,860 16,845 16,666 MY Imports 586 586 750 750 500 500 Total Supply 15,879 15,879 16,873 17,143 17,873 18,166 MY Exports 96 96 115 115 100 120
MY Exp. to EU 0 0 0 0 0 0
Industrial Dom. Cons. 0 0 0 0 0 0 Food Use Dom. Cons. 15,250 15,250 16,230 16,028 17,200 16,667 Feed Waste Dom. Cons. 0 0 0 0 0 0 Total Dom. Cons. 15,250 15,250 16,230 16,028 17,200 16,667 Ending Stocks 533 533 528 1,000 573 1,379 Total Distribution 15,879 15,879 16,873 17,143 17,873 18,166
24 Table 8. Rapeseed Oil
PSD Table
Country China, Peoples Republic of
Commodity Oil, Rapeseed (1000 tons)
2015/16 2016/17 2017/18
USDA Official
Post Estimate New
USDA Official
Post Estimate New
USDA Official
Post Estimate
New Market Year Begin 10/2015 10/2016 10/2017 Crush 18,500 18,100 16,800 17,000 17,300 17,100 Extr. Rate, 999.9999 0.392 0.392 0.3923 0.3923 0.3923 0.3923 Beginning Stocks 4,164 4,164 3,837 4,214 2,726 3,478 Production 7,258 7,095 6,591 6,669 6,787 6,708 MY Imports 768 768 815 800 750 700 Total Supply 12,190 12,027 11,243 11,683 10,263 10,886
MY Exports 3 3 17 5 5 5
MY Exp. to EU 0 0 0 0 0 0
Industrial Dom. Cons. 0 0 0 0 0 0 Food Use Dom. Cons. 8,350 7,810 8,500 8,200 8,100 8,200 Feed Waste Dom. Cons. 0 0 0 0 0 0 Total Dom. Cons. 8,350 7,810 8,500 8,200 8,100 8,200 Ending Stocks 3,837 4,214 2,726 3,478 2,158 2,681 Total Distribution 12,190 12,027 11,243 11,683 10,263 10,886
25 Table 9. Peanut Oil
PSD Table
Country China, Peoples Republic of
Commodity Oil, Peanut (1000 tons)
2015/16 2016/17 2017/18
USDA Official
Post Estimate New
USDA Official
Post Estimate New
USDA Official
Post Estimate
New Market Year Begin 10/2015 10/2016 10/2017 Crush 8,800 8,850 8,950 8,900 9,250 9,050 Extr. Rate, 999.9999 0.320 0.320 0.320 0.320 0.320 0.320
Beginning Stocks 0 0 0 0 0 0 Production 2,816 2,832 2,864 2,848 2,960 2,896 MY Imports 113 113 130 115 130 100 Total Supply 2,929 2,945 2,994 2,963 3,090 2,996
MY Exports 10 10 9 6 5 9
MY Exp. to EU 0 0 0 0 0 0
Industrial Dom. Cons. 0 0 0 0 0 0 Food Use Dom. Cons. 2,919 2,935 2,985 2,957 3,085 2,987 Feed Waste Dom. Cons. 0 0 0 0 0 0 Total Dom. Cons. 2,919 2,935 2,985 2,957 3,085 2,987
Ending Stocks 0 0 0 0 0 0
Total Distribution 2,929 2,945 2,994 2,963 3,090 2,996
26 Table 10. Sunflower Seed Oil
PSD Table
Country China, Peoples Republic of
Commodity Oil, Sunflower Seed (1000 tons)
2015/16 2016/17 2017/18
USDA Official
Post Estimate New
USDA Official
Post Estimate New
USDA Official
Post Estimate
New Market Year Begin 10/2015 10/2016 10/2017 Crush 1,400 1,400 1,550 1,569 1,650 1,650 Extr. Rate, 999.9999 0.359 0.359 0.359 0.358 0.3588 0.3582
Beginning Stocks 0 0 0 0 0 0 Production 502 502 556 562 592 591 MY Imports 878 878 775 780 850 850 Total Supply 1,380 1,380 1,331 1,342 1,442 1,441
MY Exports 1 0 0 2 0 0
MY Exp. to EU 0 0 0 0 0 0
Industrial Dom. Cons. 0 0 0 0 0 0 Food Use Dom. Cons. 1,379 1,380 1,331 1,340 1,442 1,441 Feed Waste Dom. Cons. 0 0 0 0 0 0 Total Dom. Cons. 1,379 1,380 1,331 1,340 1,442 1,441
Ending Stocks 0 0 0 0 0 0
Total Distribution 1,380 1,380 1,331 1,342 1,442 1,441
27 Table 11. Palm Oil
PSD Table
Country China, Peoples Republic of
Commodity Oil, Palm (1000 tons)
2015/16 2016/17 2017/18
USDA Official
Post Estimate New
USDA Official
Post Estimate New
USDA Official
Post Estimate
New Market Year Begin 10/2015 10/2016 10/2017
Area Planted 0 0 0 0 0 0
Area Harvested 0 0 0 0 0 0
Trees 0 0 0 0 0 0
Beginning Stocks 305 305 189 189 189 287
Production 0 0 0 0 0 0
MY Imports 4,689 4,689 4,650 4,650 4,900 4,700 Total Supply 4,994 4,994 4,839 4,839 5,089 4,987
MY Exports 5 5 0 2 0 2
MY Exp. to EU 0 0 0 0 0 0
Industrial Dom. Cons. 2,050 2,050 2,050 2,100 2,100 2,150 Food Use Dom. Cons. 2,750 2,750 2,600 2,450 2,800 2,600 Feed Waste Dom. Cons. 0 0 0 0 0 0