THIS REPORT CONTAINS ASSESSMENTS OF COMMODITY AND TRADE ISSUES MADE BY
USDA STAFF AND NOT NECESSARILY STATEMENTS OF OFFICIAL U.S. GOVERNMENT
POLICY
Date:
GAIN Report Number:
Approved By:
Prepared By:
Report Highlights:
Rice ending stocks are projected to decrease to 1.7 million metric tons (MMT) and 1.2 MMT in marketing year (MY) 2016/17 and MY 2017/18 respectively, as the Korean government has begun allowing the use of rice for consumption in animal feed. Projections of calendar year (CY) 2017 and 2018 rice imports from the United States are revised upward to 165,000 MT and 160,000 MT respectively. Corn consumption numbers for both MY 2016/17 and MY 2017/18 are revised down to 9.4 MMT and 9.8 MMT to reflect the decreased demand for feed grade corn caused by both Highly Pathogenic Avian Influenza (HPAI) and as a result of displacement as rice is beginning to be used in feed. Meanwhile, the projection for MY 2016/17 imports of corn is revised downward to 9.2 MMT as demand for feed grade corn diminished over the year because the poultry sector was hit with HPAI. Wheat production is expected to decrease to 32,000 MT in MY 2017/18 from 39,000 MT in MY 2016/17 due to lower yields and less harvested area. Wheat imports from the United States rose to 1.3 MMT in MY 2016/2017 from 1.2 MMT the previous year thanks to feed grade wheat exports.
Sunchul Choi//Amanda F. Hinkle
Ron Verdonk
With Plenty of Rice on Hand, Korea Increases Rice Used for
Animal Feed
Grain and Feed Update
Korea - Republic of
Post:
Commodities:
WHEAT
Production:
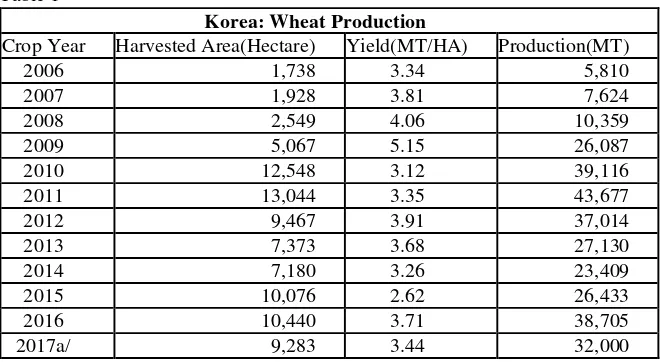
At the end of June 2017, the Korean government officially released data showing that wheat production in MY 2016 was 38,705 MT. Yield returned to 3.71 MT per hectare (HA), due to favorable weather during both the planting and growing seasons. The official number for wheat area in MY 2017 released at the end of July 2017 was 9,283 HA, with official production data becoming available in 2018.
Table 1
Korea: Wheat Production
Crop Year Harvested Area(Hectare) Yield(MT/HA) Production(MT)
2006 1,738 3.34 5,810
2007 1,928 3.81 7,624
2008 2,549 4.06 10,359
2009 5,067 5.15 26,087
2010 12,548 3.12 39,116
2011 13,044 3.35 43,677
2012 9,467 3.91 37,014
2013 7,373 3.68 27,130
2014 7,180 3.26 23,409
2015 10,076 2.62 26,433
2016 10,440 3.71 38,705
2017a/ 9,283 3.44 32,000
Source: Ministry for Agriculture, Food, and Rural Affairs (MAFRA), Statistics Korea (KOSTAT)
a/ FAS/Seoul production forecast based on five-year average yield and official acreage as released by KOSTAT
Consumption:
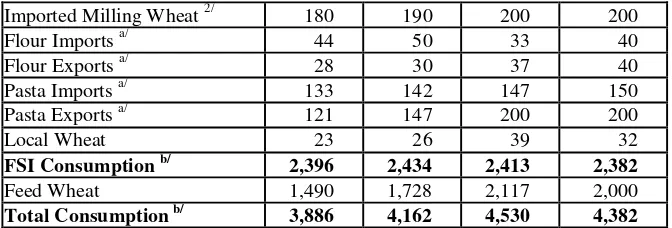
MY 2016/17 wheat consumption is revised up to 4.5 million metric tons (MMT), a rise of three percent from FAS Seoul’s previous estimate and an increase of nine percent from the previous year, due to greater consumption of feed grade wheat (Table 2 & 3).
The MY 2017/18 forecast for wheat consumption remains stable at 4.4 MMT due to an anticipated availability of feed grade wheat at prices competitive with feed corn. Milling wheat consumption will also remain stable.
Table 2
Korea: Post Estimates of Wheat Use (1,000 MT, July/June)
Year 2014/15 2015/16 2016/17 2017/18c/
Imported Milling Wheat 1/ 2,165 2,203 2,231 2,200 Rice, Milled
Imported Milling Wheat 2/ 180 190 200 200
Flour Imports a/ 44 50 33 40
Flour Exports a/ 28 30 37 40
Pasta Imports a/ 133 142 147 150
Pasta Exports a/ 121 147 200 200
Local Wheat 23 26 39 32
FSI Consumption b/ 2,396 2,434 2,413 2,382
Feed Wheat 1,490 1,728 2,117 2,000
Total Consumption b/ 3,886 4,162 4,530 4,382
Source: Korea Feed Association (KFA), Korea Flour Millers Industry Association (KOFMIA) and Korea Customs Service (KCS) 1/ KOFMIA members
2/ Non- KOFMIA member a/ Wheat basis
b/ Includes local wheat and flour and pasta imports, but subtracts flour and pasta exports c/ FAS/Seoul estimate/forecast
Table 3
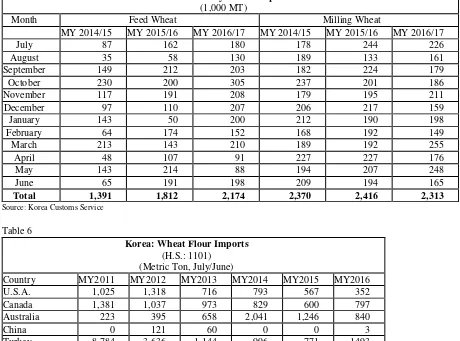
Korea: Monthly Wheat Use (1,000 MT)
Month Feed Wheat Milling Wheat a/
MY 2014/15 MY 2015/16 MY 2016/17 MY 2014/15 MY 2015/16 MY 2016/17
July 129 124 180 183 181 176
August 121 119 174 175 170 180
September 126 124 182 166 178 173
October 134 151 211 179 182 178
November 130 140 191 172 169 179
December 143 151 214 186 189 189
January 123 135 182 194 191 184
February 103 138 159 152 160 172
March 116 153 170 183 188 191
April 120 142 146 176 178 178
May 119 167 157 172 170 179
June 125 186 151 177 178 186
Total 1,490 1,728 2,117 2,115 2,134 2,165
Source: KFA and KOFMIA
a/ Includes wheat flour exports, but excludes the portion used in soy-sauce production (about 50,000 MT or so)
Trade:
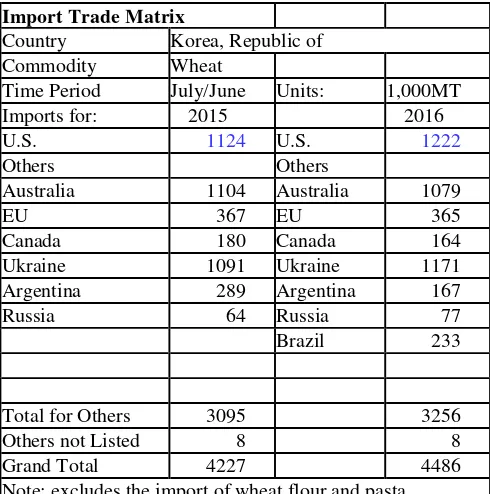
The MY 2017/18 wheat import forecast remains unchanged at 4.6 MMT from FAS Seoul’s previous estimates, of which 2.6 MMT are expected to be used for milling (including flour and pasta imports on a wheat equivalent basis) and 2.0 MMT are expected to be used for feed. This import estimate hinges to a large extent on the continued availability of competitively-priced feed wheat, with demand for milling wheat remaining steady.
MY 2016/17 wheat imports are revised to 4.66 MMT, up 100,000 MT over FAS Seoul’s previous estimate due to greater imports of feed wheat.
Table 4
Korea: Wheat Imports (1,000 MT, Customs Cleared Basis) Marketing Year
(July/June)
Feed Wheat Milling Wheat Flour Imports
1/ Pasta Import 1/ Total
05/06 1,536 2,220 41 101 3,898
07/08 565 2,317 105 117 3,104
08/09 1,151 2,058 69 105 3,383
09/10 2,164 2,071 127 119 4,481
10/11 2,075 2,520 63 123 4,781
11/12 2,868 2,169 42 122 5,201
12/13 2,820 2,461 39 135 5,455
13/14 1,948 2,181 30 150 4,309
14/15 1,391 2,370 44 143 3,948
15/16 1,812 2,416 50 142 4,420
16/17 2,174 2,313 33 147 4,667
17/182/ 2,000 2,400 40 150 4,590
Source: Korea Customs Service 1/ Wheat basis
2/ FAS/Seoul forecast
Table 5
Korea: Monthly Wheat Imports (1,000 MT)
Month Feed Wheat Milling Wheat
MY 2014/15 MY 2015/16 MY 2016/17 MY 2014/15 MY 2015/16 MY 2016/17
July 87 162 180 178 244 226
August 35 58 130 189 133 161
September 149 212 203 182 224 179
October 230 200 305 237 201 186
November 117 191 208 179 195 211
December 97 110 207 206 217 159
January 143 50 200 212 190 198
February 64 174 152 168 192 149
March 213 143 210 189 192 255
April 48 107 91 227 227 176
May 143 214 88 194 207 248
June 65 191 198 209 194 165
Total 1,391 1,812 2,174 2,370 2,416 2,313
Source: Korea Customs Service
Table 6
Korea: Wheat Flour Imports (H.S.: 1101)
(Metric Ton, July/June)
Country MY2011 MY2012 MY2013 MY2014 MY2015 MY2016
U.S.A. 1,025 1,318 716 793 567 352
Canada 1,381 1,037 973 829 600 797
Australia 223 395 658 2,041 1,246 840
China 0 121 60 0 0 3
Turkey 8,784 3,636 1,144 996 771 1493
Indonesia 7,708 9,616 8,011 5,968 6,678 6,050
Russia 0 0 0 4,1890 10,626 57
Others 11,250 12,478 10,237 17,391 16,319 14,803
Total 30,371 28,600 21,799 32,207 36,816 24,395
Wheat Basis a/ 41,548 39,125 29,821 44,059 50,364 33,372 Source: Korea Customs Service (KCS)
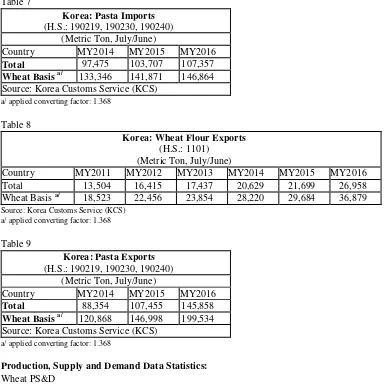
Table 7
Korea: Pasta Imports (H.S.: 190219, 190230, 190240)
(Metric Ton, July/June)
Country MY2014 MY2015 MY2016
Total 97,475 103,707 107,357 Wheat Basis a/ 133,346 141,871 146,864 Source: Korea Customs Service (KCS)
a/ applied converting factor: 1.368
Table 8
Korea: Wheat Flour Exports (H.S.: 1101)
(Metric Ton, July/June)
Country MY2011 MY2012 MY2013 MY2014 MY2015 MY2016
Total 13,504 16,415 17,437 20,629 21,699 26,958
Wheat Basis a/ 18,523 22,456 23,854 28,220 29,684 36,879 Source: Korea Customs Service (KCS)
a/ applied converting factor: 1.368
Table 9
Korea: Pasta Exports (H.S.: 190219, 190230, 190240)
(Metric Ton, July/June)
Country MY2014 MY2015 MY2016
Total 88,354 107,455 145,858 Wheat Basis a/ 120,868 146,998 199,534 Source: Korea Customs Service (KCS)
a/ applied converting factor: 1.368
Production, Supply and Demand Data Statistics: Wheat PS&D
Wheat 2015/2016 2016/2017 2017/2018
Market Begin Year Jul 2015 Jul 2016 Jul 2017
Korea, Republic of USDA Official New Post USDA Official New Post USDA Official New Post
Area Harvested 10 10 10 10 11 9
Beginning Stocks 1400 1400 1535 1507 1600 1446
Production 26 26 35 39 34 32
MY Imports 4420 4420 4667 4667 4500 4600
TY Imports 4420 4420 4667 4667 4500 4600
TY Imp. from U.S. 1119 1124 1388 1222 0 1300
Total Supply 5846 5846 6237 6213 6134 6078
MY Exports 177 177 237 237 230 240
TY Exports 177 177 237 237 230 240
Feed and Residual 1728 1728 2000 2117 1900 2000
FSI Consumption 2406 2434 2400 2413 2425 2380
Total Consumption 4134 4162 4400 4530 4325 4380
Ending Stocks 1535 1507 1600 1446 1579 1458
Total Distribution 5846 5846 6237 6213 6134 6078
Yield 2.6 2.6 3.5 3.9 3.0909 3.5556
Import Trade Matrix
Country Korea, Republic of
Commodity Wheat
Time Period July/June Units: 1,000MT
Imports for: 2015 2016
U.S. 1124 U.S. 1222
Others Others
Australia 1104 Australia 1079
EU 367 EU 365
Canada 180 Canada 164
Ukraine 1091 Ukraine 1171
Argentina 289 Argentina 167
Russia 64 Russia 77
Brazil 233
Total for Others 3095 3256
Others not Listed 8 8
Grand Total 4227 4486
Note: excludes the import of wheat flour and pasta
CORN
Production:
Corn production in MY 2016 was revised down to 73,681 MT based on the Korean government official numbers released at the end of June 2017. This number is down two percent from FAS Seoul’s initial forecast, and six percent lower than a year earlier.
Table 10
Korea: Corn Production Crop Year Area (HA) Yield (MT/HA) Production (MT)
2006 13,661 4.73 64,623
2007 16,981 4.82 83,513
2008 18,366 5.05 92,830
2009 15,326 5.02 76,975
2010 15,528 4.79 74,339
2011 15,823 4.65 73,612
2012 17,001 4.89 83,210
2013 15,905 5.06 80,465
2014 15,839 5.18 82,008
2015 15,356 5.10 78,243
2016 15,183 4.85 73,681
2017a/ 15,900 5.04 80,000
Source: Ministry for Agriculture, Food, and Rural Affairs (MAFRA), Statistics Korea (KOSTAT) a/ FAS/Seoul forecast based on five-year average yield and acreage
Consumption:
inventories are gradually returning to levels existing prior to the Highly Pathogenic Avian Influenza (HPAI) outbreak in late 2016. However, feed corn is still expected to be the major ingredient used in compound feed, accounting for more than 38 percent of total ingredients in the marketing year with feed wheat accounting for two MMT (about 10 percent of total compound feed production) (Table 11 & 13).
MY 2016/17 corn consumption is estimated at 9.4 MMT, consisting of 7.0 MMT for feed and 2.4 million tons for food, seed and industrial (FSI) purposes. Based on records for the first 11 months, this consumption estimate is down 7.4 percent from a year earlier. Demand for feed corn is estimated to be smaller than the previous year due to: (1) reduced demand for
compound feed for a poultry sector hit by HPAI, (2) a greater global availability of feed grade wheat with competitive prices, and (3) a greater supply of old rice for animal feed. Demand for processing corn is estimated to be four percent greater than the year earlier due to greater consumption of high fructose corn syrup (HFCS).
Comparing compound feed production for the first eleven months of MY 2015 and MY 2016 (Table 15), the production forecast for MY 2016/17 is for a decline to 18.9 MMT from the previous year, down 3.1 percent in compound feed production from the year earlier. This is mainly due to declining poultry inventories hit by HPAI in late 2016 (Table 19).
Major corn processors have continued using conventional corn imported from Russia, Ukraine, Serbia, Hungary, Australia, France, South Africa and Brazil. Non-GM corn is imported from the United States for food. Many Korean food processing companies are reluctant to use ingredients sourced from biotech corn. Corn processors have imported GM corn for non-edible starch products consumed by the paper processing industry.
Table 11
Korea: Total Corn Utilization (October/September, 1,000 MT) Marketing
Year
Feed Processing a/
Food b/
Total
2008/09 6,368 1,418 108 7,894
2009/10 6,362 1,928 92 8,382
2010/11 6,074 2,051 89 8,214
2011/12 5,690 2,036 89 7,815
2012/13 6,483 1,900 98 8,481
2013/14 7,762 2,034 95 9,891
2014/15 8,035 2,118 97 10,250
2015/16 7,841 2,220 93 10,154
2016/17 c/ 7,000 2,300 100 9,400 2017/18 c/ 7,400 2,300 100 9,800
Source: Korea Feed Association (KFA), Korea Corn Processing Industry Association (KOCPIA) a/ Used for wet and dry milling process based on imported corn.
b/ For on-farm human consumption (on-the-cob) or snack food consumed on-the-cob, as puffed kernels or as corn tea. Imported white corn for popping has been included since MY 2004.
c/ FAS Seoul forecast
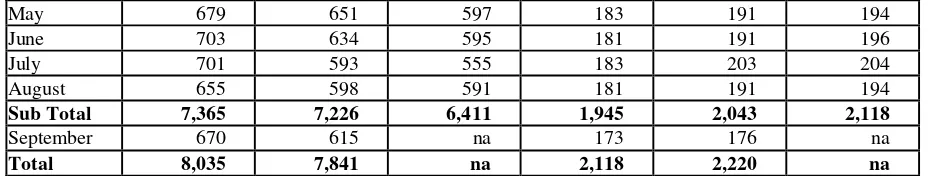
Table 12
Korea: Monthly Corn Use (1,000 MT)
Month Feed Corn Processing Corn
MY 2014/15 MY 2015/16 MY 2016/17 MY 2014/15 MY 2015/16 MY 2016/17
October 676 699 612 180 189 200
November 620 660 628 178 186 186
December 707 732 618 169 172 185
January 675 673 571 170 183 190
February 602 648 522 155 160 176
March 668 688 581 187 191 199
May 679 651 597 183 191 194
June 703 634 595 181 191 196
July 701 593 555 183 203 204
August 655 598 591 181 191 194
Sub Total 7,365 7,226 6,411 1,945 2,043 2,118
September 670 615 na 173 176 na
Total 8,035 7,841 na 2,118 2,220 na
Source: Korea Feed Association (KFA), Korea Corn Processing Industry Association (KOCPIA)
Table 13
Korea: Feed Ingredient Use for Compound Feed Production (October/September, 1,000 MT)
Items MY 2014/15 MY 2015/16 MY 2016/17a/ MY 2017/18a/
Sub. Total Grains and Grain Substitutes 12,046 12,395 11,800 12,600
- Wheat 1,480 1,910 2,100 2,000
- Corn 8,035 7,841 7,000 7,400
- Other Grains and Grain Substitute b/ 2,531 2,644 2,700 3,200
Others c/ 6,951 7,028 7,100 6,900
Grand Total 18,997 19,423 18,900 19,500
Source: Korea Feed Association (KFA) a/ FAS Seoul forecast
b/ includes Tapioca, bran and gluten feed.
c/ includes vegetable protein meal, animal protein, minerals/additives, tallow, DDGs and molasses.
Table 14
Korea: Compound Feed Production by Species (October/September, 1,000 MT)
Species MY 2014/15 MY 2015/16 MY 2016/17a/ MY 2017/18a/
Poultry 5,551 5,797 5,400 5,700
Swine 6,049 6,247 6,300 6,700
Cattle 5,978 5,820 5,800 5,600
Others b/ 1,388 1,529 1,400 1,500
Total 18,967 19,393 18,900 19,500
Source: Ministry for Agriculture, Food, and Rural Affairs (MAFRA) a/ FAS/Seoul forecast
b/ include ducks, rabbit, horse, sheep, deer, quail etc.
Table 15
Korea: Compound Feed Production Comparison by Species for
the First Eleven Months (October/June, 1,000 MT)
Species MY 2015/16 MY 2016/17 Change
Poultry 5,343 4,944 -7.5
Swine 5,711 5,753 +0.7
Cattle 5,320 5,282 -0.7
Others 1,408 1,259 -10.6
Total 17,782 17,238. -3.1
Source: Ministry for Agriculture, Food, and Rural Affairs (MAFRA)
Table 16
Month MY 2015/16 MY 2016/17
Wet Milling Dry Milling Total Wet Milling Dry Milling Total October 182,940 6,243 189,183 194,073 6,209 200,282 November 179,483 6,510 185,993 179,528 6,358 185,886 December 166,320 6,038 172,358 178,378 6,264 184,642 January 176,869 6,359 183,228 183,539 6,649 190,188 February 154,768 5,521 160,289 170,261 6,139 176,400 March 184,879 6,126 191,005 192,102 7,007 199,109 April 180,131 6,141 186,272 187,708 6,240 193,948 May 184,283 6,252 190,535 187,247 6,506 193,753 June 185,398 5,804 191,202 190,125 5,922 196,047 July 197,386 5,903 203,289 197,619 6,286 203,905 August 184,634 6,111 190,745 188,188 5,664 193,852
September 169,743 5,763 175,506 na na na
Total 2,146,834 72,771 2,219,605 na na na
Source: Korea Corn Processing Industry Association (KOCPIA)
Trade:
The MY 2017/18 corn import forecast is revised down to 9.7 MMT, decreasing by half a million MT from Post’s initial forecast of 10.2 MMT, as the Korean government plans to release 750,000 MT of brown rice for animal feed in CY 2018 to reduce government held rice stocks.
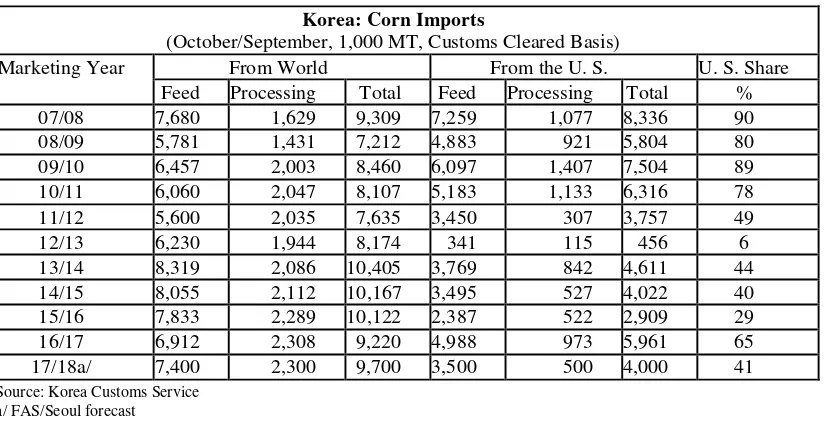
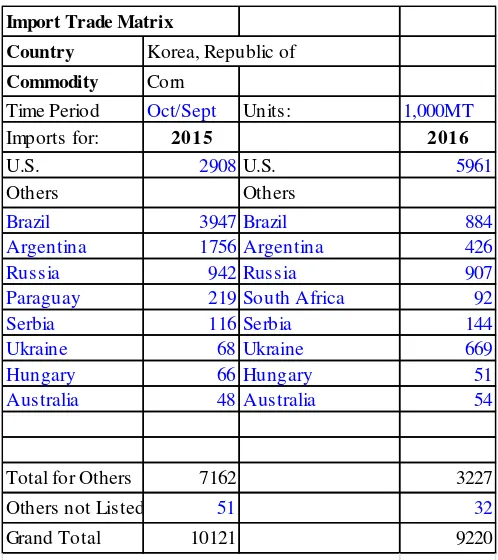
Corn imports in MY 2016/17 were revised down to 9.2 MMT due to a lower demand for feed corn caused by the aftermath of the HPAI outbreak in the poultry sector late last year as well as increasing rice consumption for animal feed in CY 2017 (Table 25). However, U.S. corn exports to Korea sharply increased to six MMT due to the strong price competitiveness of U.S. corn for both feed and food corn sectors, accounting for 65 percent of total imports. U.S. feed corn exports to Korea reached five MMT, accounting for 72 percent of total imports of feed grade corn followed by Brazil, Ukraine and Argentina. Meanwhile, U.S. food grade corn exports to Korea were one MMT, accounting for 42 percent of total imports of food grade corn followed by Russia, Serbia, Ukraine and South Africa.
Table 17
Korea: Corn Imports
(October/September, 1,000 MT, Customs Cleared Basis)
Marketing Year From World From the U. S. U. S. Share
Feed Processing Total Feed Processing Total %
07/08 7,680 1,629 9,309 7,259 1,077 8,336 90
08/09 5,781 1,431 7,212 4,883 921 5,804 80
09/10 6,457 2,003 8,460 6,097 1,407 7,504 89
10/11 6,060 2,047 8,107 5,183 1,133 6,316 78
11/12 5,600 2,035 7,635 3,450 307 3,757 49
12/13 6,230 1,944 8,174 341 115 456 6
13/14 8,319 2,086 10,405 3,769 842 4,611 44
14/15 8,055 2,112 10,167 3,495 527 4,022 40
15/16 7,833 2,289 10,122 2,387 522 2,909 29
16/17 6,912 2,308 9,220 4,988 973 5,961 65
17/18a/ 7,400 2,300 9,700 3,500 500 4,000 41
Source: Korea Customs Service a/ FAS/Seoul forecast
Table 18
Month Feed Corn Processing Corn
MY 2014/15 MY 2015/16 MY 2016/17 MY 2014/15 MY 2015/16 MY 2016/17
October 846 651 618 181 171 146
November 465 673 659 183 175 171
December 750 853 636 137 211 162
January 743 563 451 168 245 205
February 558 528 627 138 112 147
March 636 782 490 258 198 251
April 759 702 653 145 206 165
May 689 620 655 163 193 211
June 636 636 552 208 146 267
July 693 654 501 166 252 209
August 671 680 417 177 127 166
September 609 491 653 188 253 207
Total 8,055 7,833 6,912 2,112 2,289 2,308
Source: Korea Customs Service
Production, Supply and Demand Data Statistics: Corn PS&D
Corn 2015/2016 2016/2017 2017/2018
Market Begin Year Oct 2015 Oct 2016 Oct 2017
Korea, Republic of USDA Official New Post USDA Official New Post USDA Official New Post
Area Harvested 15 15 15 15 15 16
Beginning Stocks 1860 1860 1936 1905 1831 1799
Production 78 78 75 74 76 80
MY Imports 10121 10121 9300 9220 10200 9700
TY Imports 10121 10121 9300 9220 10200 9700
TY Imp. from U.S. 3882 2908 0 5961 0 4000
Total Supply 12059 12059 11311 11199 12107 11579
MY Exports 0 0 0 0 0 0
TY Exports 0 0 0 0 0 0
Feed and Residual 7800 7841 7280 7000 8000 7400
FSI Consumption 2323 2313 2200 2400 2300 2400
Total Consumption 10123 10154 9480 9400 10300 9800
Ending Stocks 1936 1905 1831 1799 1807 1779
Total Distribution 12059 12059 11311 11199 12107 11579
Yield 5.2 5.2 5 4.9333 5.0667 5
(1000 HA) ,(1000 MT) ,(MT/HA)
Import Trade Matrix
Country Korea, Republic of Commodity Corn
Time Period Oct/Sept Units: 1,000MT
Imports for: 2015 2016
U.S. 2908U.S. 5961
Others Others
Brazil 3947 Brazil 884
Argentina 1756 Argentina 426
Russia 942 Russia 907
Paraguay 219 South Africa 92
Serbia 116 Serbia 144
Ukraine 68 Ukraine 669
Hungary 66 Hungary 51
Australia 48 Australia 54
Total for Others 7162 3227
Others not Listed 51 32
Grand Total 10121 9220
Source: Korea Customs Service (KCS)
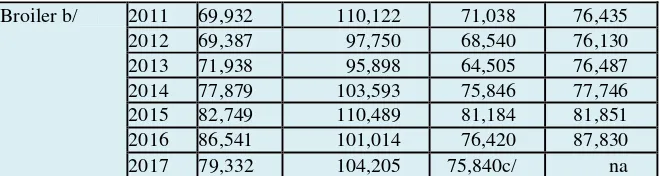
Table 19
Korea: Animal Inventory
(1,000 Head, 1,000 Birds, as of August 2017)
Animal Year March June September December
Beef Cattle 2013 2,966 3,064 3,043 2,918
2014 2,811 2,879 2,820 2,759
2015 2,659 2,748 2,753 2,676
2016 2,596 2,742 2,768 2,717
2017 2,642 2,786 2,760c/ 2,689e/
Dairy Cattle 2013 420 419 422 424
2014 428 424 429 431
2015 425 418 418 411
2016 409 402 407 404
2017 400 402 406d/ 404e/
Swine 2013 10,107 10,181 10,188 9,912
2014 9,698 9,680 9,966 10,090
2015 9,971 10,018 10,332 10,187
2016 10,315 10,355 10,699 10,366
2017 10,328 10,432 10,700d/ 10,600e/
Layer a/ 2011 61,025 60,723 61,212 62,425
2012 63,200 61,953 61,326 61,344
2013 62,340 60,610 62,674 64,824
2014 64,572 62,851 65,263 67,674
2015 68,878 67,907 72,090 71,877
2016 70,177 68,281 69,853 71,043
Broiler b/ 2011 69,932 110,122 71,038 76,435
2012 69,387 97,750 68,540 76,130
2013 71,938 95,898 64,505 76,487
2014 77,879 103,593 75,846 77,746
2015 82,749 110,489 81,184 81,851
2016 86,541 101,014 76,420 87,830
2017 79,332 104,205 75,840c/ na
Source: Korea Statistics (KOSTAT) and Korea Rural Economic Institute (KREI) a/ Excluding breeders
b/ Excluding multi-use broilers c/ KREI forecast
d/ FAS/Seoul forecast based on KREI data e/ FAS/Seoul forecast
RICE
Production:
Statistics Korea (KOSTAT) released their 2017 rice production estimate of 3.96 million metric tons (MMT) based on a nationwide survey of 6,300 rice fields conducted September 15-22, 2017, down 5.8 percent from the previous year due to both smaller production area and a lower yield compared to last year.
The survey results show total harvested acreage at 754,716 HA, which is a 3.1 percent decline from the previous year. Yields were also below normal, caused by unfavorable weather in the critical stages such as drought during the planting season and frequent rains in the filling stage. Therefore, declining acreage and decreased yields meant production levels were lower than four MMT for the first time since 1981 when the rice crop suffered considerably from cold damage and resulted in production of only 3.6 MMT. KOSTAT is expected to release its final production estimate shortly after the rice harvest is complete in mid-November.
Accordingly, FAS Seoul forecasts rice production in MY 2017/18 will show some expansion to 3.96 million metric tons (MMT), up 1.4 percent from the post’s initial forecast of 3.9 MMT to reflect the results of the survey.
Area
Rice area has continued to decrease annually – with decreases ranging from 5,000 HA to 38,000 HA every year since 2001. In 2017, rice planting/harvesting area decreased by 24,018 HA, down 3.1 % from last year, in response to greater demand from housing and building complexes and the conversion of rice paddy land to more profitable cash crops. The government also encouraged rice farmers to cultivate other crops in the rice paddy land to reduce the burden of heavy rice stocks accumulated since MY2013/14. In consequence, the Korean government decided to initiate a ‘rice reduction program’ next year that is designed for rice farmers who cultivate other crops in rice paddy land to receive Korean Won (KRW) 3.4 million per HA (USD2,800 per HA). A government budget of KRW 137 billion (USD114 million), affecting 50,000 HA, is
available for the program. If rice farmers actively participate in the program, the program will lead to a reduction of 250,000MT of rice.
Table 20
Korea: 2017 Rice Production Forecast
2016 Rice Production 2017 Rice Production Forecast1/ Change (%)
Area (1,000 HA) 779 755 -3.1
Yield (KG/HA) 5,389 5,240 -2.8
Production (1,000MT) 4,197 3,955 -5.8
Source: Ministry of Agriculture, Food and Rural Affairs (MAFRA)
1/ FAS/Seoul forecast based on planting intention acreage surveyed by KREI over previous five year Olympic average yield
Table 21
Area (Hectare) Production (Metric ton)
Crop Year 2016 2017 Change (%) 2016 2017 Change (%)
National Total 778,734 754,716 -3.1 4,196,691 3,955,227 -5.8
Kyonggi 80,750 78,484 -2.8 413,916 378,290 -8.6
Kangwon 30,714 29,710 -3.3 166,396 149,738 -10.0
Chungbuk 37,114 35,069 -5.5 201,675 182,008 -9.8
Chungnam 137,354 134,035 -2.4 774,105 722,436 -6.7
Chonbuk 121,026 118,340 -2.2 687,398 648,477 -5.7
Chonnam 166,444 161,445 -3.0 846,236 819,500 -3.2
Kyounbuk 102,941 99,551 -3.3 576,643 550,514 -4.5
Kyongnam 70,626 67,895 -3.9 369,032 352,365 -4.5
Cheju 127 113 -11.0 358 307 -14.2
Cities 1/ 31,638 30,074 -4.9 160,931 151,592 -5.8
Source: Statistics Korea (KOSTAT)
1/ paddy land located in seven big cities such as Seoul, Pusan etc.
Yield
Unfavorable weather developments from planting to growing stages resulted in lower rice yields at 5,240 kg per HA, which is down 2.8 percent from 2016 but still the third highest yield in the most recent five years.
Table 22
Korea: Rice Area, Yield and Production
Crop Year Area (1,000HA) Yield (KG/HA) Production (Milled, 1,000 MT)
2002 a/ 1,053 4,679 4,927
2003 b/ 1,016 4,381 4,451
2004 1,001 4,995 5,000
2005 980 4,865 4,768
2006 955 4,901 4,680
2007 950 4,640 4,408
2008 936 5,174 4,843
2009 924 5,318 4,916
2010 892 4,815 4,295
2011 854 4,946 4,224
2012 849 4,718 4,006
2013 833 5,081 4,230
2014 816 5,200 4,241
2015 799 5,416 4,327
2016 779 5,389 4,197
2017c/ 755 5,240 3,955
Source: Ministry of Agriculture, Food and Rural Affairs (MAFRA)
a/ Heavy rains during the summer and the effects of typhoon Rusa (Aug 31 – Sep 1)
b/ Cool and rainy days during the growing season and the effects of typhoon Maemi (Sep 9 - 12) c/ Based on September 15 crop survey conducted by KOSTAT
Government Rice Purchase Program under the Public Food Grain Stockholding Program (PFSP)
The government also purchases rice for price stabilization purposes. Under the Public Food Grain Stockholding Program for Food Security, the Korean government will purchase domestic paddy rice during the harvest season (October-December) at the average market price and sell it during non-harvest periods at the prevailing domestic market price.
In addition to government rice purchased under PFSP, the Korean government announced that it would buy more rice from farmers to support rice farm gate prices. Markets have been depressed by overproduction estimated to be within the range of about 250,000-300,000 MT above the 3.7 MMT estimated as actual human consumption in MY 2017/18. The Korean government is expected to buy 370,000 MT (milled) of rice to prop up the farm gate price in the harvest season, reaching 720,000 MT in total under government purchasing programs.
Table 23
Korea: Government Rice Purchases under
Public Food Grain Stockholding Program (PFSP)
Crop Year Production(1,000 MT) Purchase(1,000 MT) %
2005 4,768 719 15.1
2006 4,680 504 10.8
2007 4,408 417 9.5
2008 4,843 400 8.3
2009 4,916 370 7.5
2010 4,295 340 7.9
2011 4,224 261 6.2
2012 4,006 363 9.1
2013 4,230 367 8.7
2014 4,241 640a/ 15.1
2015 4,327 747b/ 17.3
2016 4,197 689c/ 16.4
2017 plan 3,955 720d/ 18.2
Source: Ministry of Agriculture, Food and Rural Affairs (MAFRA)
a/ Includes 240,000 MT to stabilize rice market in addition to 370,000 MT under PFSP and 30,000 MT for APTERR (ASEAN Plus Three Emergency Rice Reserve)
b/ Includes 357,000 MT to stabilize rice markets in addition to 360,000 MT under PFSP and 30,000 MT for APTERR (ASEAN Plus Three Emergency Rice Reserve)
c/ Includes 299,000 MT to stabilize rice markets in addition to 360,000 MT under PFSP and 30,000 MT for APTERR (ASEAN Plus Three Emergency Rice Reserve)
d/ Includes 370,000 MT to stabilize rice markets in addition to 320,000 MT under PFSP and 30,000 MT for APTERR (ASEAN Plus Three Emergency Rice Reserve)
Government and NACF’s Loan Programs
The Korean government is expected to provide loans for rice millers worth more than 1.4 trillion Korean Won (USD1.2 billion) with a special loan rate between zero and two percent per annum this year. The National Agricultural Cooperative Federation (NACF), the national farmers group, also continues to provide about 1.9 trillion Korean Won (USD1.7 billion) worth of loans to rice farmers/millers with zero interest rate. The main goal of the loan programs is to encourage rice millers to purchase more rice from farmers, minimizing the downward pressure of harvest on prices in the rice market. Another bumper crop has caused concerns among rice farmers over the collapsing farm gate price.
Most rice purchases under the loan programs provided by the Korean government and the NACF will be introduced into the
rice retail market through NACF’s Rice Processing Complexes (RPCs) and independent RPCs throughout the 2017/18 (Nov/Oct) rice marketing year. Korean rice farmers expect the purchasing measures will help prop up prices during the rice harvest season.
Rice farmers are expected to sell approximately 2.5 MMT during the harvest season, including 720,000 MT of government direct purchases under the Public Food Grain Stockholding Program, APTERR (ASEAN Plus Three Emergency Rice Reserve) and additional government purchasing as well as 1.8 MMT of rice under loan programs.
Table 24
Korea: NACF Rice Purchases a/
Crop Year Production(1,000 MT) Purchase(1,000 MT) %
2006 4,680 1,306 28
2007 4,408 1,227 28
2008 4,843 1,617 33
2009 4,916 1,950 40
2010 4,295 1,380 32
2011 4,224 1,327 31
2012 4,006 1,331 33
2013 4,230 1,465 35
2014 4,241 1,649 39
2015 4,327 1,770 41
2016 4,200 1,800 43
2017 plan 3,955 1,800 46
Source: Ministry of Agriculture, Food and Rural Affairs (MAFRA) a/ exclude independent RPC purchases
Consumption:
MY 2017/18 rice consumption is forecast at 4.87 MMT, up 162,000 MT from the estimated total consumption in the current marketing year due to the government plan to increase the use of government held old stocks of rice for animal feed as human consumption continues declining. Imported rice constitutes about nine percent of total consumption.
Korean consumers prefer short-grain table rice. Three quarters of domestic production (all short-grain) was consumed as table rice during marketing year 2015/16. Per capita table rice consumption continues declining as eating habits change due to rising incomes and the growing popularity of Western foods. Annual per capita table rice consumption reached its peak at 136.4 Kg in 1970, and has gradually declined to 61.4 Kg in MY 2015/16, according to preliminary government statistics. FAS/Seoul forecasts per capita table rice consumption at 60.1 Kg in MY 2016/17 based on declining consumption trends for table rice, further decreasing to 59.0 Kg in MY 2017/18.
In MY 2015/16, the percentage of processing rice consumption increased to 17 percent of total rice domestic consumption from 13 percent in the previous year. Rice was allowed to be used as feed for the first time, as rice consumption used in food processing has maintained constant growth in the past few years. In MY 2016/17, heavy stocks will lead the share of rice used in processing to increase further to 25 percent, due mainly to a sharp increase of rice used in animal feed. The Korean government plans to allow 750,000 MT of brown rice (675,000 in milled) of old stock held by government to be used for animal feed in MY 2017/18, reaching 1.4 MMT of rice (milled) for processing or 29 percent of total domestic
consumption.
Feed:
In order to reduce high ending stocks, the Korean government released rice to be used as feed for the first time in MY 2015/16. This occurred when the Korean government released 101,000 MT of brown rice (91,000 MT on a milled basis) from the 2012 crop for feed use in February 2016. The released price was 200 Korean Won per Kg (USD 0.18/Kg), a tenth of the purchasing price in the harvest season when it was procured under the government purchasing program.
In MY 2016/17, the Korean government allowed the use of 480,000 MT of domestic old crop brown rice for feed purposes (432,000 MT on milled basis), consisting of rice from the 2013 crop and 2014 crop. However, feed millers declined to consume 82,000 MT of brown rice (73,800 MT, milled basis) imported mainly from China under the 2014 Minimum Market Access agreement (MMA, 2013 crop) because of the additional cost of removing 40 Kg “PP” bags that contain imported brown rice for processing purposes. In response, the imported rice for feed is expected to be delivered to feed millers on the basis of one-ton tote bags next year. The selling price was set at 208 Korean Won per Kg (USD 0.18/kg), reflecting 88 percent of the feed value of corn imported in CY 2016.
The Korean government recently released a plan to use more rice for feed in MY 2017/18 in order to further reduce ending stocks, expecting to use 750,000 MT of brown rice (675,000 MT, milled) for animal feed in CY 2018.
Table 25
(1,000 MT, milled)
Rice Year (November - October) MY 2014/15a/ MY 2015/16b/ MY 2016/17c/ MY 2017/18d/
Table Rice 3,239 3,110 3,074 3,040
Processing 575 711 1,165 1,395
(for food) (426) (451) (560) (550)
(for liquor) (149) (169) (173) (170)
(for feed) 0 (91) (432) (675)e/
Seed 35 35 33 33
Other and Loss 348 356 434 400
Total Demand 4,197 4,212 4,706 4,868
Per Capita Table Rice Consumption (Kg) 62.9 61.4 60.1 59.0
Source: Ministry of Agriculture, Food and Rural Affairs (MAFRA) a/ Revised
b/ Preliminary c/ Forecast
d/ FAS/Seoul forecast
e/ Includes 74,000MT of imported rice, mainly from China
Table 26
Korea: Rice Consumption Pattern for Processing Purpose (1,000 MT, milled)
Purpose MY 2013/14 MY 2014/15 a/ MY 2015/16 b/ MY 2016/17 c/
KRFA 227 197 222 250
KALIA 78 155 169 173
Others d/ 238 223 229 310
Feed 0 0 91 432
Total 535 575 711 1,165
Source: Ministry of Agriculture, Food and Rural Affairs (MAFRA) a/ Revised
b/ Preliminary c/ Forecast
d/ Traditional foods or beverage made of local rice.
Note: Korea Rice Foodstuffs Association (KRFA), Korea Alcohol & Liquor Industry Association (KALIA)
Trade:
Korea continues to import the mandatory import volume of 408,700 metric tons from Most Favored Nation (MFN) countries at the current duty level of five percent under the tariff rate quota (TRQ) regime implemented in 2015. In late 2014, as Korea prepared to implement rice tariffication through the WTO, Korea deleted provisions about usage purposes, such as the ratio of table rice (30 percent) and guaranteed access to the domestic market. Accordingly, aT (Korea Agro-Fisheries and Food Trade Corporation), the government’s state trading arm, manages the purchase of all imported rice through a tendering process, and subsequently auctions off imported table rice.
Imports:
The MY 2017/18 rice import forecast remains unchanged at about 410,000 MT (milled basis) from Post’s initial forecast, as Korea is expected to continue purchasing 408,700 tons (milled basis) of rice under the CY 2018 TRQ.
MY 2016/17 rice imports are revised down to 400,000 MT, slightly lower than the initial forecast of 410,000 MT (milled basis), based on actual rice imports for the first 11 months and buying contracts, while actual delivery of some portion of the TRQ will roll over into the following year. U.S. rice exports to Korea are estimated at 165,000 MT (milled) based on actual rice imports for the first nine months in CY 2017, which accounted for about 52 percent of total estimated rice imports of 320,000 MT (milled) in CY 2017.
2017 TRQ Tendering Process:
respectively (Table 27).
This quantity consists of 70,000 MT of medium-grain brown rice (63,000 MT on a milled basis) from the United States (60,000 MT) and Australia (10,000MT), 117,200 MT of short-grain brown rice (105,500 on a milled basis) from China (62,200 MT) and Vietnam (55,000 MT), and 30,000 MT of long-grain brown rice (27,000 MT, milled) from Thailand (Table 29).
As Korean farmers have made strong demands that the government suspend buying foreign rice during the harvest season of Korean rice, aT has tentatively stopped the tender process since September 2017. Korea is expected to resume the process of buying tenders for the open quota of 188,200 MT (milled) from November through December to complete the mandatory purchases under 2017 TRQ of rice within this year.
Table 27
Korea: Rice Contracts by Country under 2017 MFN TRQ1/ (Unit: MT, Milled Basis, as of August 10, 2017)
Country
MFN TRQ
Total Processing Use Table Use
USA 54,000 25,000 79,000(19.3)
Open Quota 188,200 188,200(46.0)
G. Total 408,700 408,700(100%)
Source: Korea Agro-Fisheries and Food Trade Corporation (aT) 1/ under ongoing process of buying tenders since March 2017
Table 28
Korea: U.S. Rice Sales to Korea under 2017 TRQ1/ (ongoing process of buying tenders as of August 10, 2017) Contracts Milled rice(MT)
for Table
Source: Korea Agro-Fisheries and Food Trade Corporation (aT) a/ equivalent to 54,000 MT, milled basis
1/ under ongoing process of buying tenders since March 2017
Table 29
Korea: 2017 TRQ Rice Tender Results (as of August 10, 2017) Bid
10,000 9,000 Vietna
n
20,000 18,000 Vietna
m 827.90 CIP
10,000 9,000 Thailan
d 418.88 CIP
10,000 9,000 Vietna
m 425.68 CIP
15,000 13,500 Vietna
m 750.00 CIP
10,000 9,000 Austral
ia 655.00 CIP
20,000 18,000 Thailan
d 435.80 CIP
Auctions for Imported Table Rice:
Korea Agro-Fisheries & Food Trade Corporation (aT) sells table rice shipments to consumers through a public auction system. Meanwhile, the Ministry of Agriculture, Food and Rural Affairs (MAFRA) distributes processing rice to end-users, such as food processors and alcoholic beverage producers, at a set price throughout the year.
The current pace of auctions for imported rice for table use has been very slow, effectively reducing the volume of auctioned rice due to heavy stocks of domestic rice caused by consistent crop overproduction since 2013. As large rice stocks have led
to low domestic prices, farmers’ groups have petitioned the government to slow down auctions for imported rice for table use and then asked the government to stop conducting auctions for imported medium and short grains competing with domestic rice. Accordingly, as of September 18, 2017, the government suspended auctions for medium and short grain table rice imported under the 2015 TRQ but maintained auctions for long grain table rice imported under 2016 TRQ.
Table 30
Korea: Status of Rice Auction for Table Rice under 2015 TRQ (Unit: metric tons, milled basis, as of September 18, 2017) Commodity
Off Balance Auctioned Off (%)
Source: Korea Agro-Fisheries and Food Trade Corporation (aT) 1/ Weighted average in Korean Won per Kg
Table 31
Korea: Status of Rice Auction for Table Rice under 2016 TRQ (Unit: metric tons, milled basis, as of October 11, 2017) Commodity
Source: Korea Agro-Fisheries and Food Trade Corporation (aT) 1/ Weighted average in Korean Won per Kg
Exports:
Korea’s rice exports were 2,285 MT for the first nine months of CY 2017, and they are expected to reach about 3,000 MT on annual basis. U.S. imports of Korean rice are also expected to be higher than the previous year.
Table 32
Korea: Rice Export (Milled)
Calendar Year To the World To the United States
Quantity (MT) Value (USD1,000) Quantity (MT) Value (USD1,000)
2005 18 89 5 5
2007 507 1,322 333 876
2008 356 829 115 285
2009 4,183 7,300 443 777
2010 3,765 6,394 272 587
2011 3,782 6,277 161 244
2012 2,223 4,424 90 185
2013 1,517 3,363 86 180
2014 1,684 3,894 123 303
2015 1,987 4,472 365 1,148
2016 2,313 4,847 477 1,175
2017 (Jan-Sep) 2,285 4,630 401 1,069
Source: Korea Customs Service (KCS)
Stocks:
MY 2017/18 ending stocks forecast (as of the end of October 2018) is revised down to 1.2 MMT, or 24.9 percent of total consumption because the government plans to increase rice consumption for animal feed in CY 2018. The government continues its efforts to reduce heavy rice stocks, but stocks are still higher than the FAO recommended level of 800,000 MT or 18 percent of stock to use ratio. MY 2016/17 ending stocks (as of the end of October 2017) are estimated at 1.7 million tons, or 37 percent of total domestic consumption, down from the previous year due to a government rice policy to use rice for animal feed in CY 2017 for the first time. MY 2015/16 ending stocks (through the end of October 2016) were estimated at 1.8 MMT, or 43.5 percent of total domestic consumption. Rice production in the past four consecutive years has been greater than actual demand, amid declining per capita table rice consumption attributable to rising incomes (and more diverse food intake).
Table 33
Korea: Status of Rice Stocks (Milled rice, 1,000 MT, as of end October)
Rice Year (Nov.-Oct.) 2012/13 2013/14 2014/15a/ 2015/16b/ 2016/17c/ 2017/18d/
Total Stock 755 887 1,406 1,831 1,719 1,213
Government Stock 755 887 1,406 1,831 1,719 1,213
Total Domestic Consumption 4,489 4,422 4,197 4,212 4,706 4,868
Stock to Use Ratio (%) 16.8 20.0 33.5 43.5 36.5 24.9
Source: FAS/Seoul Estimate based on MAFRA data a/ MAFRA Revised
b/ MAFRA Preliminary c/ MAFRA forecast d/ FAS/Seoul forecast
Production, Supply and Demand Data Statistics:
Rice PS&D
Rice, Milled 2015/2016 2016/2017 2017/2018
Market Begin Year Nov 2015 Nov 2016 Nov 2017
Korea, Republic of USDA Official New Post USDA Official New Post USDA Official New Post
Area Harvested 799 799 779 779 744 755
Beginning Stocks 1406 1406 1831 1831 1736 1719
Milled Production 4327 4327 4197 4197 3900 3955
Rough Production 5771 5771 5625 5625 5217 5309
Milling Rate (.9999) 7498 7498 7461 7461 7475 7450
MY Imports 312 312 410 400 410 410
TY Imports 313 313 410 340 410 410
TY Imp. from U.S. 112 111 0 165 0 160
Total Supply 6045 6045 6438 6428 6046 6084
MY Exports 2 2 2 3 2 3
TY Exports 2 2 2 3 2 3
Ending Stocks 1831 1831 1736 1719 1394 1213
Total Distribution 6045 6045 6438 6428 6046 6084
Yield (Rough) 7.2228 7.2228 7.2208 7.2208 7.0121 7.0318
(1000 HA) ,(1000 MT) ,(MT/HA)
Table 34
Korea: Monthly Wholesale Price of Milled Rice (High Quality)
Month\Year CY 2015 CY 2016 CY 2017
Won/Kg USD/Kg Won/Kg USD/Kg Won/Kg USD/Kg
January 2,070 1.90 1,810 1.51 1,602 1.35
February 2,069 1.88 1,810 1.49 1,590 1.39
March 2,046 1.84 1,810 1.53 1,590 1.40
April 2,040 1.88 1,810 1.58 1,590 1.40
May 2,019 1.85 1,810 1.54 1,590 1.41
June 1,990 1.79 1,810 1.55 1,590 1.41
July 1,990 1.74 1,810 1.58 1,598 1.41
August 1,990 1.69 1,802 1.62 1,626 1.44
September 2,004 1.70 1,705 1.54 1,691 1.50 October 2,951 1.70 1,546 1.37 1,803 1.59
November 1,852 1.61 1,620 1.40 na na
December 1,826 1.56 1,620 1.37 na na
Average 1,986 1.76 1,747 1.51 na na
Source: Korea Agricultural Marketing Information Service (KAMIS) Note: Monthly Average Exchange Rate is applied.
Table 35
Korea: Monthly Retail Price of Milled Rice (High Quality)
Month\Year CY 2015 CY 2016 CY 2017
Won/Kg USD/Kg Won/Kg USD/Kg Won/Kg USD/Kg
January 2,277 2.09 2,132 1.78 1,805 1.53
February 2,263 2.06 2,112 1.74 1,806 1.58
March 2,252 2.03 2,085 1.76 1,803 1.59
April 2,211 2.04 2,027 1.77 1,804 1.59
May 2,239 2.05 1,998 1.70 1,768 1.57
June 2,243 2.02 1,990 1.71 1,745 1.54
July 2,225 1.95 1,992 1.74 1,728 1.53 August 2,218 1.88 1,983 1.79 1,742 1.54 September 2,241 1.90 1,970 1.78 1,947 1.72 October 2,233 1.95 1,895 1.68 2,086 1.84
November 2,184 1.90 1,850 1.59 na na
December 2,181 1.86 1,809 1.53 na na
Average 2,230 1.97 1,985 1.71 na na
Source: Korea Agricultural Marketing Information Service (KAMIS) Note: Monthly Average Exchange Rate is applied.
Table 36
Korea: Foreign Exchange Rate (Korean Won against USD)
Month CY 2015 CY 2016 CY 2017
February 1,099 1,216 1,143
March 1,112 1,184 1,133
April 1,086 1,146 1,132
May 1,091 1,172 1,126
June 1,112 1,167 1,130
July 1,143 1,142 1,133
August 1,177 1,110 1,129
September 1,182 1,107 1,130 October 1,146 1,125 1,134a/
November 1,151 1,160 na
December 1,172 1,182 na
Average 1,130 1,158 1,137
Source: Global Financial Service a/ Oct 1-13, 2017