ASSESSMENT OF VARIOUS REMOTE SENSING TECHNOLOGIES IN BIOMASS AND NITROGEN CONTENT ESTIMATION USING AN AGRICULTURAL TEST FIELD
R. Näsi a*, N. Viljanena, J. Kaivosojab, T. Hakalaa, M. Pandžića L. Markelina, E. Honkavaaraa
a
Finnish Geospatial Research Insitute, Geodeetinrinne 2, 02430 Masala, Finland - (roope.nasi, niko.viljanen, teemu.hakala, milos.pandzic, lauri.markelin, eija.honkavaara,)@nls.fi
b
Natural Resources Institute Finland (LUKE), Vakolantie 55, 03400 Vihti, Finland - [email protected]
Commission ΙΙI, WG III/4
KEY WORDS: Hyperspectral, Photogrammetry, Canopy Height model, Calibration, Validation, drone, UAV, Biomass estimation. ABSTRACT:
Multispectral and hyperspectral imaging is usually acquired by satellite and aircraft platforms. Recently, miniaturized hyperspectral 2D frame cameras have showed great potential to precise agriculture estimations and they are feasible to combine with lightweight platforms, such as drones. Drone platform is a flexible tool for remote sensing applications with environment and agriculture. The assessment and comparison of different platforms such as satellite, aircraft and drones with different sensors, such as hyperspectral and RGB cameras is an important task in order to understand the potential of the data provided by these equipment and to select the most appropriate according to the user applications and requirements. In this context, open and permanent test fields are very significant and helpful experimental environment, since they provide a comparative data for different platforms, sensors and users, allowing multi-temporal analyses as well. Objective of this work was to investigate the feasibility of an open permanent test field in context of precision agriculture. Satellite (Sentinel-2), aircraft and drones with hyperspectral and RGB cameras were assessed in this study to estimate biomass, using linear regression models and in-situ samples. Spectral data and 3D information were used and compared in different combinations to investigate the quality of the models. The biomass estimation accuracies using linear regression models were better than 90% for the drone based datasets. The results showed that the use of spectral and 3D features together improved the estimation model. However, estimation of nitrogen content was less accurate with the evaluated remote sensing sensors. The open and permanent test field showed to be suitable to provide an accurate and reliable reference data for the commercial users and farmers.
* Corresponding author
1. INTRODUCTION
Drone (alternative terms: UAV; Unmanned Aerial Vehicle or RPAS; Remotely Piloted Aircraft System) remote sensing technology is developing explosively and drones are increasingly used in various environmental remote sensing tasks (Pajares, 2015; Torresan et al, 2017). New drone technologies, including sensors, sensor systems and platforms are entering to commercial markets constantly. When concerning the usability of drone systems and different remote sensing systems, characterization of their performance in controlled test field would be highly advantageous. In applications, such as precision agriculture to estimate biomass, the uncertainty characterization is required in order to rely in the results of drone remote sensing. Thus, an accurate reference field to evaluate the data obtained using this technology is of great value.
In the case of classical mapping applications, the permanent test fields have showed their excellent potential in assessing the performance of remote sensing systems. Literature has established a few permanent test sites for remote sensing systems (Honkavaara et al., 2008). The use of test sites was recommended in various situations, in particular, in the context of capturing new remote sensing system, in the beginning of the imaging season and after crashes or corresponding.
Objective of this study was to investigate the feasibility of using a permanent test site for assessment of a drone remote sensing systems for precision agriculture. The test site was available for users during the summer of 2016, and it was used to assess performance of several different remote sensing systems.
2. METHODOLOGY 2.1 Test site
Altogether 32 permanent ground control points (GCPs) were built and measured in the area. They were marked with wooden poles and targeted with circular targets with 30 cm diameter. Their coordinates were measured using Trimble R10 (L1+L2) RTK-GPS. The estimated accuracy of the GCPs were 2 cm in horizontal coordinates and 3 cm in height (Bilker & Kaartinen 2001).
Three reflectance panels with nominal reflectance of 0.03, 0.09 and 0.50 were installed in the area to support the radiometric processing.
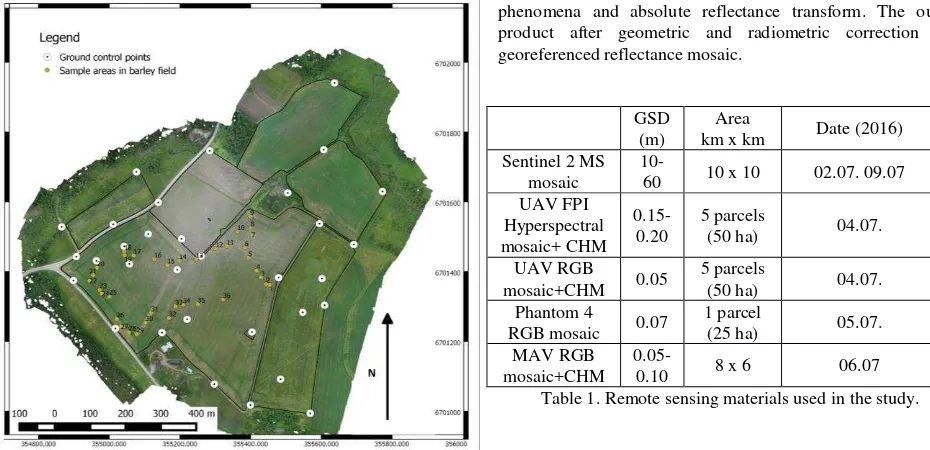
Figure 1. Test site with ground control points and sample areas in barley field. The background image is orthomosaic based on
RGB image from drone.
2.2 Remote sensing data sets
Remote sensing data captures were carried out with various platforms and sensors (Table 1). A professional drone (hexacopter with Tarot 960 foldable frame) equipped with a hyperspectral camera based on Fabry-Pérot interferometer (UAV FPI) and a good quality Samsung NX500 RGB camera (UAV RGB) were used. Different versions of this light-weight FPI hyperspectral camera (Saari et al., 2011; Oliveira et al., 2016a) have showed potential in both agriculture (Honkavaara et al., 2013; Kaivosoja et al., 2013) and other vegetation mapping tasks (Näsi et al., 2015; Berveglieri et al., 2016; Moriya et al., 2017; Nevalainen et al., 2017). In this study, FPI2012b sensor was configured with 36 spectral bands in 500 nm to 900 nm spectral range. In addition, a consumer-class low-cost drone (Phantom 4) equipped with a RGB camera (Phantom RGB) were used. A manned small aircraft operated by Lentokuva Vallas was equipped with a RGB camera (MAV RGB) and the FPI camera. Two different flying heights providing ground sample distances (GSDs) of 5 and 10 cm were used. Additionally, Sentinel-2 data sets were captured during the summer. Sentinel-2 image was processed to Level 2A product using Sen2Cor Processor. It performs the atmospheric-, terrain and cirrus corrections to data providing reflectance
image mosaic as the output data. The data sets are shown in Table 1.
Georeferencing for drone and aircraft data sets was carried out using Agisoft Photoscan software. Different sets of ground reference were used, including different numbers of GCPs. The professional drone was equipped with NV08C-CSM -GNSS receiver thus trajectory data (L1-RTK) was also used. For Phantom data, DroneDeploy service (dronedeploy.com) was used to create RGB orthomosaic. Only GNSS trajectory (L1) was available for georeferencing in this case.
Radiometric processing of hyperspectral data sets was carried out using the FGI’s radBA software (Honkavaara et al., 2013), which considers effects of changing illumination conditions, BRDF (bidirectional reflectance distribution function) phenomena and absolute reflectance transform. The output product after geometric and radiometric correction was georeferenced reflectance mosaic.
Table 1. Remote sensing materials used in the study.
2.3 Estimation methods
In this study, linear regression models were used to assess the performance of different remote sensing datasets for dry biomass and nitrogen content estimation. Different features for sample areas, such as indices, NDVI (Normalized Difference Vegetation Index) and GRVI (Green-Red Vegetation Index), and 3D features were extracted from image data based on type of data set. Hyperspectral and Sentinel-2 data sets enable to use reflectance values and indices. As a 3D feature, average of canopy height model (CHM) based on photogrammetric point clouds was extracted from the sample areas of drone and MAV data, except for low-cost drone because only mosaics were available. Finally, multiple linear regression models were tested for estimation of biomass. Different sets of variables were used. Combining the 3D and spectral features was tested using the data from professional drone. The frame-based hyperspectral sensor used in this work enables extraction of 3D features directly from spectral image data sets (Honkavaara et al., 2013; Aasen et al, 2015; Oliveira et al., 2016b).
3. RESULTS AND DISCUSSION 3.1 Georeferencing
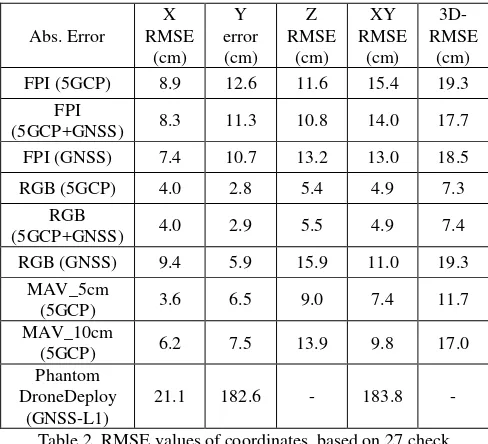
only GNSS trajectory was considered, and in the second, only GCPs were applied. In the third case, both GCP+GNSS were used (Table 2). The remaining 27 GCPs in the test site were used as check points to determine X-, Y-coordinate accuracies of orthomosaics and Z-coordinate accuracies of DEMs for each image dataset. Coordinate absolute errors varied between 3.6 cm to 8.9 cm in x-coordinate, 2.8 cm to 12.6 cm in y-coordinate and 5.4 to 10.7 cm in z-coordinate, expect on the case of DroneDeploy, where xy absolute error was 183.8cm. The reason for higher errors is that Phantom provides only raw L1 GNSS trajectory data. The UAV RGB had the lowest 3D RMSE (root-mean-square error) of 7.3 cm. MAV RGB obtained 3D RMSE of 11.7 cm, while UAV FPI presented the highest 3D RMSE of 19.3 cm. Visual evaluation of the multi-temporal registration of Sentinel-2 images indicates an accuracy of 1-2 pixels that was consistent with the Sentinel-2 Data Quality Report dating back to 01.09.2016. (1.83 pixel reported). Sentinel-2 mission objective is to meet 3 m performance with 95.5 % confidence level. The best combinations of georeferenced option were selected for next analysis steps. Helmert transformation with 5GCPs was applied in Phantom mosaic, in order to reduce the geometric error. This process is important to ensure that ground samples are extracted from right positions of the mosaic.
Abs. Error
X RMSE
(cm) Y error (cm)
Z RMSE
(cm) XY RMSE
(cm) 3D-RMSE
(cm) FPI (5GCP) 8.9 12.6 11.6 15.4 19.3
FPI
(5GCP+GNSS) 8.3 11.3 10.8 14.0 17.7 FPI (GNSS) 7.4 10.7 13.2 13.0 18.5
RGB (5GCP) 4.0 2.8 5.4 4.9 7.3
RGB
(5GCP+GNSS) 4.0 2.9 5.5 4.9 7.4
RGB (GNSS) 9.4 5.9 15.9 11.0 19.3
MAV_5cm
(5GCP) 3.6 6.5 9.0 7.4 11.7
MAV_10cm
(5GCP) 6.2 7.5 13.9 9.8 17.0
Phantom DroneDeploy
(GNSS-L1)
21.1 182.6 - 183.8 -
Table 2. RMSE values of coordinates, based on 27 check points, for different georeferencing options.
3.2 Correlation between remote sensing and in situ data The remote sensing image data from different platforms and sensors were used with in situ measurements to build different models based on linear regression in order to estimate biomass and nitrogen of the barley field. First, spectral bands of Sentinel-2 (figure 2 top) and UAV-based FPI-sensor (figure 2 bottom) were correlated with in situ field data. The calculations were carried out with and without reference plots, which has not included any vegetation (0-values). The best correlations (~0.6) for Sentinel-2 data were found from visible and NIR area with 10 and 20 m spatial resolution. For the UAV data, the best correlations (~0.9) were found from NIR area.
Figure 2. Pearson correlations (R) between reference measurements of biomass and nitrogen content between Sentinel 2 bands (top) and UAV FPI bands (bottom). The values near to zero indicate that linear regression is very poor
and values near to +/-1 indicate strong correlation. X-axis is presenting wavelength (nm) of the spectral band.
Secondly, two vegetation indices, NDVI (Normalized Difference Vegetation Index) and GRVI (Green-Red Vegetation Index) were selected to use as features. To select bands of hyperspectral and Sentinel-2 data to use for indices, every possible band combinations were correlated to ground reference and the best of them were used. For example, Reddersen et al. (2014) have used same approach earlier. In figure 3 the best combination of FPI bands was found using bands 27 (740 nm) and 32 (835 nm) to providing 0.948 correlation to reference biomass data.
Figure 3. The Pearsons correlations between different band combinations of NDVI and reference measurements of biomass.
photogrammetry, provided almost as good correlation values as the spectral data, of about 0.9.
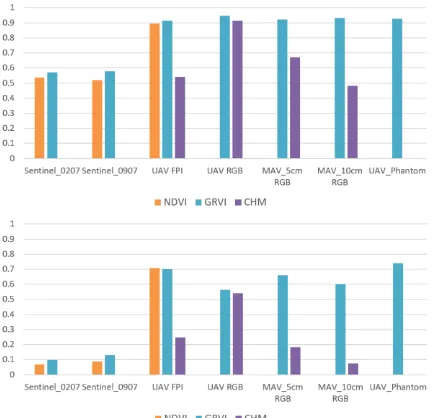
The best correlations in the regressions with the nitrogen content were on the level of 0.7 and they were achieved with the UAV FPI NDVI and GRVI data, and with the consumer class UAV RGB camera NDVI data (Figure 4). The Sentinel-2 correlations were less than 0.1 thus clearly lower than those obtained with the UAV. The correlations with the CHM were 0.1-0.5.
In all cases, the best results were obtained with the UAV based remote sensing materials; results of aircraft data were slightly poorer and the Sentinel-2 provided the poorest results.
The poorer values with Sentinel-2 were likely to be due to the bigger GSD and the challenge to correlate the field measurements (0.5 m*0.5 m) to the low resolution satellite (10 m) measurements. The upscaling of field observations to satellite datasets is thus important topic for further research.
Figure 4. Correlations (R) from the linear regression of the dry biomass (top) and nitrogen (bottom) and the remote sensing
NDVI, GRVI and CHM features from different data sets.
3.3 Estimation of biomass using linear regression models The use of multiple linear regression models improved estimation results comparing correlation with single features (Table 3). FPI based hyperspectral features provided slightly better results than DN values of RGB camera. In addition, 3D features (CHM) were combined to spectral features. Adding the FPI based CHM to spectral features did not improve results. Instead, the combination of the FPI spectral features and the RGB-based CHM provided slightly better results than any other used set. Leave-one-out cross correlation method was used to assess the results.
Correlation coefficient r
Mean absolute
error (kg/m2)
RMSE (kg/m2)
FPI spectral 0.9344 0.023 0.0273
FPI spectral+
FPI CHM 0.9344 0.023 0.0273
FPI spectral+
RGB CHM 0.9383 0.0214 0.0265
RGB DN 0.9223 0.0236 0.0296
RGB DN+
RGB CHM 0.9265 0.0218 0.0289
Table 3. Biomass estimation results: Correlation coefficient, Mean absolute error and root-mean-square error (RMSE) from professional drone data using multiple linear regression models
with different variable combinations.
Also Bendig et al. (2015) and Tilly et al. (2015) have reported that combining 3D features to spectral features for estimation of barley biomass slightly improved results. In the further studies more comprehensive estimators such SVR (Support Vector Regression) or Random Forest algorithms should be assessed.
4. CONCLUSIONS
An open agricultural test site in Hovi was established in 2016 and used for testing the geometric performance and the biomass and nitrogen content estimation performance of various remote sensing systems. The permanent ground control points were advantageous for assessing the geometric performance of the systems. Biomass and nitrogen content samples were used to estimate the wall-to-wall performance of various remote sensing systems. Assessing different systems in similar environment provides efficient tool for comparison of their performance. Such test environment will also help in optimizing the algorithms used for each different sensor/system combination. Open test environments are valuable at least for sensor and system manufacturers, and for the users of the systems, e.g. commercial companies or farmers.
5. ACKNOWLEDGEMENTS
The authors would like to acknowledge Academy of Finland (Decision number 305994), Tekes – the Finnish Funding Agency for Innovation (DroneKnowledge-project; Dnro 1617/31/2016)) and European Space Agency (ESA/ESRIN Contract Nr. 4000117401/16/I-NB) for funding of this project.
REFERENCES
Aasen, H., Burkart, A., Bolten, A., & Bareth, G., 2015. Generating 3D hyperspectral information with lightweight UAV snapshot cameras for vegetation monitoring: From camera calibration to quality assurance. ISPRS Journal of Photogrammetry and Remote Sensing, 108, 245-259.
Bendig, J., Yu, K., Aasen, H., Bolten, A., Bennertz, S., Broscheit, J., ... & Bareth, G. (2015). Combining UAV-based plant height from crop surface models, visible, and near infrared vegetation indices for biomass monitoring in barley. International Journal of Applied Earth Observation and Geoinformation, 39, 79-87.
Berveglieri, A., Tommaselli, A. M. G., Imai, N. N., Ribeiro, E. A. W., Guimarães, R. B., and Honkavaara, E., 2016. Identification of Successional Stages and Cover Changes of Tropical Forest Based on Digital Surface Model Analysis. IEEE Journal of Selected Topics in Applied Earth Observations and Remote Sensing, 9(12), pp. 5385-5397.
Bilker, M.; Kaartinen, H., 2001 The Quality of Real-Time Kinematic (RTK) GPS Positioning; Reports of the Finnish Geodetic Institute; FGI: Masala, Finland, pp. 1–25.
Honkavaara, E., Peltoniemi, J. Ahokas, E., Kuittinen, R., Hyyppä, J., Jaakkola, J., Kaartinen, H., Markelin, L., Nurminen, K., Suomalainen, J., 2008. A permanent test field for digital photogrammetric systems. Photogrammetric Engineering & Remote Sensing, 74(1): 95-106.
Honkavaara, E., Saari, H., Kaivosoja, J., Pölönen, I., Hakala, T., Litkey, P., Mäkynen, J. and Pesonen, L., 2013. Processing and assessment of spectrometric, stereoscopic imagery collected using a lightweight UAV spectral camera for precision agriculture. Remote Sensing, 5(10), pp. 5006-5039.
Kaivosoja J, Pesonen L, Kleemola J, Pölönen I, Salo H, Honkavaara E, Saari H, Mäkynen J, Rajala A. 2013. A case study of a precision fertilizer application task generation for wheat based on classified hyperspectral data from UAV combined with farm history data. Proc. SPIE 8887.
Moriya, E. A. S., Imai, N. N., Tommaselli, A. M. G., & Miyoshi, G. T., 2017. Mapping Mosaic Virus in Sugarcane Based on Hyperspectral Images. IEEE Journal of Selected Topics in Applied Earth Observations and Remote Sensing, 10(2), 740-748.
Näsi, R., Honkavaara, E., Lyytikäinen-Saarenmaa, P., Blomqvist, M., Litkey, P., Hakala, T., Viljanen, N., Kantola, T., Tanhuanpää, T., and Holopainen, M, 2015. Using UAV-Based Photogrammetry and Hyperspectral Imaging for Mapping Bark Beetle Damage at Tree-Level, Remote Sensing, vol. 7, no. 11, pp. 15467–15493.
Nevalainen, O., Honkavaara, E., Tuominen, S., Viljanen, N., Hakala, T., Yu, X., Hyyppä, J., Saari, H., Pölönen, I., Imai, N.N. and Tommaselli, A. M. G., 2017. Individual Tree Detection and Classification with UAV-Based Photogrammetric Point Clouds and Hyperspectral Imaging. Remote Sensing, 9(3), pp. 185.
Oliveira, R. A., Tommaselli, A. M., & Honkavaara, E., 2016a. Geometric calibration of a hyperspectral frame camera. The Photogrammetric Record, 31(155), 325-347.
Oliveira, R.A., Tommaselli, A.M. and Honkavaara, E., 2016b. Using Hyperspectral Frame Images from Unmanned Airborne Vehicle for Detailed Measurement of Boreal Forest 3D Structure. In IOP Conference Series: Earth and Environmental Science (Vol. 44, No. 4, p. 042029). IOP Publishing.
Pajares, G., 2015. Overview and current status of remote sensing applications based on unmanned aerial vehicles (UAVs). Photogrammetric Engineering & Remote Sensing, 81(4), 281-329.
Reddersen, B., Fricke, T., & Wachendorf, M., 2014. A multi-sensor approach for predicting biomass of extensively managed grassland. Computers and electronics in agriculture, 109, 247-260.
Saari, H., Pellikka, I., Pesonen, L., Tuominen, S. , Heikkilä, J., Holmlund, C., Mäkynen, J., Ojala, K, and spectral camera system for forest and agriculture applications. Proc. SPIE 2011, 8174, doi:10.1117/12.897585.