CLIMATE CHANGE EFFECTS ON URBAN LEVEL: CITIZEN HEALTH AND
BUILDING ENERGY DEMAND
R. S. José 1, *, J. L. Pérez 1, L. Pérez 1, R. M. Gonzalez Barras 2, J. Pecci 3 and M. Palacios 3
1 Environmental Software and Modelling Group, Computer Science School, Technical University of Madrid (UPM), Madrid, Spain
- (roberto, jlperez, lperez)@fi.upm.es
2 Department of Physics and Meteorology, Faculty of Physics, Complutense University of Madrid (UCM), Ciudad Universitaria, 28040 Madrid, Spain.
3 Indra S.A., C/ Mar Egeo, 4, Pol. Industrial 1, 28830 San Fernando de Henares, Madrid (Spain).
KEY WORDS: Climate change, urban dynamical downscaling, building energy demand, health impact
ABSTRACT:
The future impacts of climate change on citizen health and building energy demand have been researched considering two possible IPCC global climate scenarios: RCP 4.5 (stabilization emission scenario) and RCP 8.5 (little effort to reduce emissions). Th e climate scenarios have been dynamically downscaled from 1º to 50 meters of spatial resolution over three European cities: Madrid, Milan and London. Air quality has also been simulated up to streets levels. Climate and air pollution information are used as input to the health impact and building energy demand assessment tools. The impacts are calculated as future (2030, 2050 and 2100) minus present (2011). The short term health impact assessment includes mortality and morbidity related with changes in the temperature and air pollution concentrations. The larger increase of costs of mortality and morbidity was noted in the increasing scenario (RCP8.5) for year 2100, because RCP 8.5 is characterized by temperature increments. Maps of the spatial distribution of the costs of the climate change have showed Building energy demand simulations have been achieved with the EnergyPlus model using specific prototype buildings based on ASHRAE 90.1 Prototype Building Modeling Specifications and urban climate information by each building. .The results show an increase in cooling demand with RCP 8.5 because future will be cooler that the present.
* Corresponding author
1. INTRODUCTION
The atmospheric flow and the special microclimate of cities are influenced by the characteristics of the urban surface (Piringer et al., 2007). Global climate models (GCMs) have a spatial resolution of approximately one degree, so we need to use higher resolution horizontal numerical models to obtain accurate data on the urban microclimate, taking into account all its special characteristics (Christensen and Christensen, 2007]).Therefore, it must be carried out at a fine scale, as this study where climate is calculated at 50 meters of spatial resolution, taking into account the shape of buildings, modelled as 3D structures, their effects on the ventilation.
The urban areas are the zones where the local response to the global change is more pronounced (Oleson et al., 2010) and most of the people live in cities, so it is necessary to provide predictions of the global climate impacts at the urban scale (Riahi et al., 2011). There is very high confidence that climate change will impact on human health directly. Climate change will exacerbate existing health problems. Health impacts on morbidity and mortality are related with weather conditions and air pollution concentrations. Finally the outdoor temperature will be modified by global climate, so the energy use for cooling and heating the building will be affected (Radhi, 2009). In previous studies (Cartalis et al., 2001), climate change was found to have significant implications for energy consumption in buildings. The past studies examining the consequences of climate change for the energy demand typically quantify the impacts at a relatively course spatial resolution. However, average responses have little value
(Wilbanks and Kates, 1999), therefore, it must be conducted at a fine scale, taking into account the 3D shape of the buildings and urban local conditions.
2. METHODOLOGY
This work examines the climate change impacts under two Representative Concentration Pathways (RCP), (Vuuren et al., 2001) currently being used to drive global climate model simulations for the IPCC´s Fifth Assessment Report (AR5), RCPs 4.5 and 8.5, across of three sectors: pedestrian comfort, citizen health and building energy demand for heating/cooling over three urban areas: Madrid, Milan and Kensington and Chelsea (London). The IPCC report (IPCC, 2013) identifies up to four climate scenarios, from very strong mitigation scenarios (non-realistic) (RCP2.6) to a business-as-usual scenario (RCP8.5). The choice of the worst-case scenario (8.5) and the best-realistic-case scenario (4.5) was motivated by the goal of displaying extreme changes that can be forecasted at city scale to allow implementing mitigation and adaptation strategies. The 8.5 pathway arises from little effort to reduce emissions and represents a failure to curb warming by 2100. It is characterized by increasing greenhouse gas emissions over time and represents scenarios in the literature leading to high greenhouse gas concentration levels (Riahi et al., 2008). RCP 4.5 is similar to the lowest-emission scenarios (B1) assessed in the IPCC AR4. It is a stabilization scenario where total radiative forcing is stabilized around 2050 by employment of a range of technologies and strategies for reducing greenhouse gas emissions. This can be considered as a weak climate change mitigation scenario (Smith et al., 2010).
2.1 Dynamical downscaling
Atmospheric flows and therefore the microclimate of cities are influenced by theirs urban characteristics, which further increase the atmospheric turbulence, thereby modifying the transport, dispersion and deposition of atmospheric pollutants. In order to take all these phenomena into account in the most realistic way possible, we have chosen a dynamic downscaling process using numerical models of climate and air quality at the regional and urban levels that constitute the state of the art in computational modeling (WRF/Chem) (Grell et al., 2005). In addition, we have included a computational model of fluid dynamics (CFD) to take into account the effects of buildings, ventilation and shading effects that are so important in an urban environment. Future simulations were carried out with current emissions to isolate the effects of climate change. Emissions are generated with a mixed top-down and bottom-up approach using specific local city data (population, traffic and landuses) that are included in the EMIMO emissions model (San Jose et al., 2007). The description and evaluation of the dynamical downscaling method was published already, for detailed information; refer to publication (San Jose et al., 2016)
2.2 Health impact
The methodology to estimate percentages of climate/pollution-related deaths and hospital admissions due to global climate are based on epidemiologic analysis of weather/air pollution and health data to characterize and quantify mortality/morbidity associations. The exposure-response relationships estimated from the epidemiological studies were applied to projections of climate. The short-term relationship between the daily number of deaths/hospital admissions and day-to-day fluctuations in exposure variables (temperature, heat waves, ozone and particles) for many cities are published in different scientific papers.
The estimated percentage of mortality/morbidity attributable to exposure variables: temperature, heat waves, ozone concentrations or particles concentrations are calculated by day to day and them average to month and year periods. Several health effects or outcomes are calculated for mortality and morbidity: All causes mortality, cardiovascular mortality, respiratory mortality, respiratory hospital admissions and cardiovascular hospital admissions. These outcomes are for all ages, except in case of the heat waves where mortality + 65 years old are calculated. The short-term health effects of the heat are analyzed based on two exposure variables: Apparent Temperature (AT) and Heat waves (HW). Only summer months (June-August) are considered to study the health effects of the heat waves days. Exposure to heat waves takes into pollutants. For PM10 the exposure indicator is the daily mean and for ozone we used the daily maximum 8-hour average. The health outcomes have been chosen based on data availability in agreement with the data uses in the epidemiological studies providing RRs. The relationship between the exposure variable and its effect on health is defined with a log-linear regression (Poisson) and is called exposure-response function (ER). If we derive this function we obtain the Equation 1 (Bell et al., 2006), which calculates the change in mortality or morbidity by a change in the exposure variable. calculates percentage (%) of change of the health effect, so it is independent from the population and the incidence rate. The
epidemiological studies do not report the β parameter of the C -R function, they publish the relative risk (-R-R) associated with a given change in the exposure variable.
2.2.1 Economic model
Estimates of the economic costs can be used in cost-benefit analysis for the comparison of adaptation strategies (Hutton 2011). Monetary estimates of changes in premature mortality risk are often expressed in terms of the Value of a Statistical Life (VSL). We have available data from the meta-analysis of VSL studies. In the case of estimating the cost of morbidity,
the total value to society of an individual’s avoidance of a
hospital admission has a principal component: the cost of illness (COI) The Cost of Illness metric summarizes the expenses that an individual must bear for hospital admissions. The Unit values available for Hospital admissions are: Cardiovascular: $26,123 and Respiratory: $19,612. Unit values are based on ICD-code-specific estimated hospital charges and the opportunity cost of time spent in the hospital (based on the average length of a hospital stay for the illness). The opportunity cost of a day spent in the hospital is estimated as the value of the lost daily wage, regardless of whether or not the individual is in the workforce. These values are used in the BENMAP software and they are based on discharge statistics
Healthcare Utilization Project National Inpatient Sample (NIS) database (2007).
2.3 Energy demand
To obtain the hour-by-hour energy consumption during the years, data for multiple climatic variables in the form of 8760 hourly records per variable (dry bulb temperature, wet bulb temperature, global solar radiation, wind speed, wind direction, humidity, and pressure) for each year were produced. Weather data is used not only to drive the hour-by-hour response of the building to the climate, but also to size the systems in model, thus affecting capacities, performance curves, and possibly the types of systems to use. All the effects have an impact on the predicted energy use in the model. Sixteen prototype buildings have been simulated with urban climate atlas from the centre of domain. Building energy usage was estimated by simulating sixteen prototypical buildings with the EnergyPlus model from U.S. Department of Energy (DC, 2010). EnergyPlus is the dynamic building energy simulation engine for modeling building; heating, cooling, lighting and ventilating EnergyPlus is a well-known and highly validated model that is the industry standard model. EnergyPlus model has been validated in numerous tests from ASHRAE. EnergyPlus is a highly detailed building thermal load simulation program that relies on detailed user inputs. EnergyPlus calculates heating and cooling loads, and energy consumption, using sophisticated calculations of heat gain and heat loss including transient heat conduction though building envelop elements. It also accounts for heat and mass transfer that impact sensible and latent thermal loads due to ventilation and infiltration. Additionally, the model has detailed calculations of heat transfer to or from the ground and comprehensive models of solar gain through the fenestration and opaque envelop components. Building features needed for implementation in EnergyPlus, were taking from the ASHRAE 90.1 Prototype Building Modeling Specifications. Outdoor ventilation air requirements and schedules are defined following the ASHRAE 90.1 Prototype Building Modeling Specifications; PNNL (2014)
3. RESULTS
The modelling system described in the last section was used to assess the impacts of projected global climate conditions in three European urban areas: Madrid 12 km by 12 km, Milan 10 km by 10 km and Kensington and Chelsea, 6 km by 5.3 km; assuming no changes in urban landuses. These three cities have a variety of building sizes and land cover types. The first level with 50 km covers the covers the whole of Europe, 1 km domains cover all the cities (Madrid, London and Milan). The simulations are run for 2030, 2040 and 2100 (future) and 2011 (present).
3.1 Health
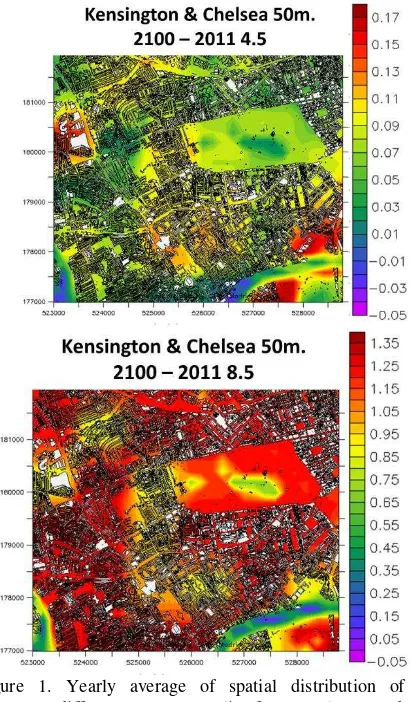
Combined health effects of pollutants and plus climate (temperature effects) are showed for 2100 London, Figure 1. and 2050 Milan Figure 2 with 50 m. spatial resolution under two possible global climate scenarios.
Figure 2. Yearly average of spatial distribution of the differences (%) mortality for natural causes due to air pollution and temperature for 2050 respect to 2011 following RCP 4.5 (top) and RCP 8.5 (bottom) scenarios with WRF-Chem-MICROSYS over Milan with 50 m. spatial resolution.
In the case of London in 2100, the mortality (%) impacts, increases in mortality and higher in 8.5 scenario than in 4.5 scenario. the expected increases in temperature will cause increased mortality especially in the years 2050 and 2100 with the climate scenario 8.5 .Areas with high density of buildings are the most affected. Water bodies reduce the health impacts. In case of Milan, the impacts on mortality changes (%) due to air pollution (all pollutants) together with the impact of temperature (climate) are higher in 8.5 scenario than in 4.5 scenario. in 2050 it is expected to aggravate the effects on health, especially in the climate scenario 8.5 by strong increases in temperature. Scenario 4.5 slight increases due to increased air pollution and temperatures are expected South part of the city is the most sensible.
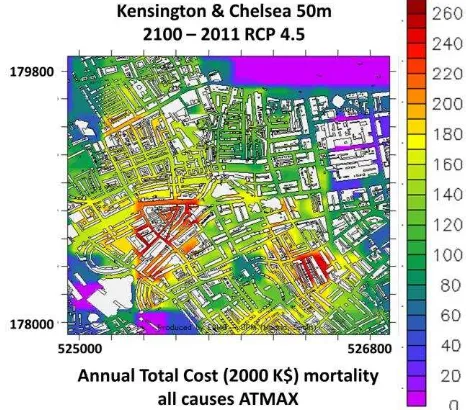
The next figures show the spatial distribution of annual total costs due to premature mortality by changes in the daily maximum apparent temperature for year 2100 under two possible climate scenarios RCP 4.5 (Figure 3) and RCP 8.5 (Figure 4) over 2 km by 2km area of Kensington and Chelsea.
Figure 3. : Spatial distribution of the differences in annual total cost (2000 K$) mortality for 2100 respect to 2011 following RCP 4.5 scenarios with 50 m. of spatial resolution over Kensington and Chelsea.
Figure 4. Spatial distribution of the differences in annual total cost (2000 K$) mortality for 2100 respect to 2011 following RCP 8.5 scenarios with 50 m. of spatial resolution over Kensington and Chelsea.
The economic cost is close to ten times greater in the RCP 8.5 than in the RCP 4.5. The purple areas (parks and water bodies) are zones where there are not people living, so nobody is exposed to the environmental factors Areas with a high density of buildings and population are the most affected by climate change. The figures identify also several hot spots where the cost of the climate change could be up to 0.88 K$/m2 and zones very close to the hot spots where cost is only 0.28 K$/m2 , 30% less, this situation is observed along the for example the same street. These results shown that it is very important to get health impacts with very high spatial resolution over urban areas.
3.2 Energy demand
Figure 5. Madrid differences (%) between 2100 and 2011 spatial distribution (50 meters of resolution) of one-year average mean air temperature with RCP 4.5
Figure 6. Madrid differences (%) between 2100 and 2011 spatial distribution (50 meters of resolution) of one-year average mean air temperature with RCP 8.5.
Figure 5 shows than with the scenario 4.5 we can observe a decrease in temperature for the year 2100 up to 16% compared to 2011. In Figure 6, the climate scenario 8.5 results in an increase of the temperature for the year 2100 up to 10.9% compared to 2011 in this area of Madrid where the energy consumption of 15 prototype building will be analyzed in the next section. It is interesting to observe, that between two very close points can be differences up to 0.5%., so the location of the buildings is very important from a meteorological and energy points of view.
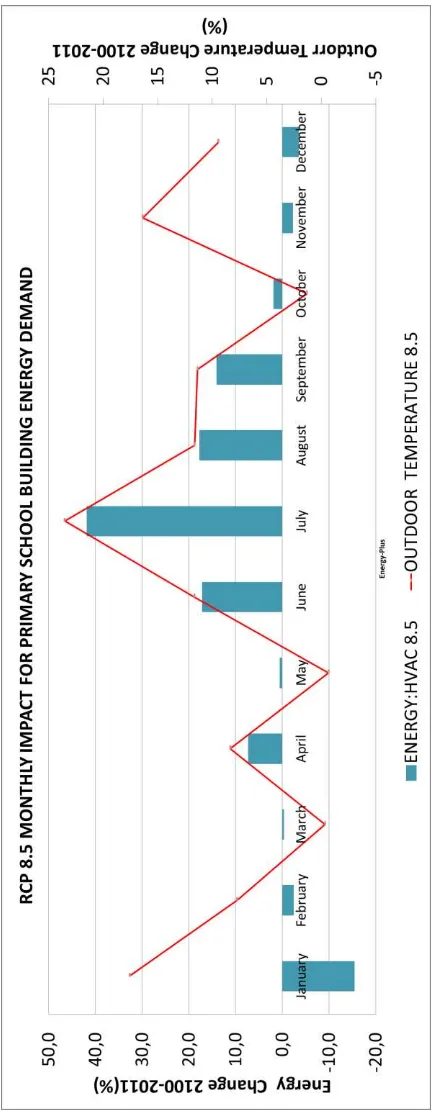
Figure 5 describes monthly average total HVAC energy demand variations (%) of a primary school. Fig. 3 corresponds with climate scenario RCP 8.5. Primary school is the type of building which will suffer the major increment of the energy demand (6.63 %).
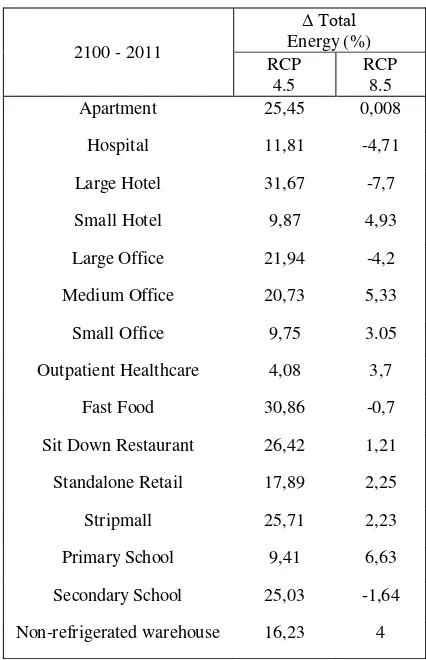
The table 1 compares the impact of climate change on HVAC annual total energy demand for fifteen types of prototype buildings by the 2100 respect to 2011 under the two possible climate scenarios.
2100 - 2011
Δ Total
Energy (%) RCP
4.5
RCP 8.5
Apartment 25,45 0,008
Hospital 11,81 -4,71
Large Hotel 31,67 -7,7
Small Hotel 9,87 4,93
Large Office 21,94 -4,2
Medium Office 20,73 5,33
Small Office 9,75 3.05
Outpatient Healthcare 4,08 3,7
Fast Food 30,86 -0,7
Sit Down Restaurant 26,42 1,21
Standalone Retail 17,89 2,25
Stripmall 25,71 2,23
Primary School 9,41 6,63
Secondary School 25,03 -1,64
Non-refrigerated warehouse 16,23 4
Table 1. Change in annual HVAC energy demand for 15 different types of buildings, RCP 4.5 and RCP 8.5.
Figure 5: Change 2100-2011 (%) in monthly energy demand (gas and electricity) and outdoor temperature for a prototype
primer school building of Madrid with RCP 8.5 climate scenario.
4. CONCLUSIONS
We have presented a dynamical downscaling approach to study the impacts of the global climate change on pedestrian comfort, human health and building energy demand over urban areas with high spatial resolution; the information can be used for
assessment of integrated climate change adaptation and mitigation strategies. A nesting procedure was used to assess the effects of climate change on three urban areas: Madrid, Milan and London with very high spatial resolution under two IPCC RCP possible scenarios, 4.5 and 8.5. The model chain included a global climate model (CESM), as well as mesoscale-urban (nested WRF/Chem with UCM spanning from 50 to 1 km resolution) and microscale (MICROSYS) models. The modelling system was used to simulate climate and air quality for present (2011) times and future (2030, 2050 and 2100) times, using 2011 emissions inventory, because we were interested on knowing the impact of future climate The nested modelling approach proposed and used is portable to other cities, requiring only the adjustment of model parameters and inputs to suit the locality. The larger increase of costs of mortality and morbidity was noted in the increasing scenario (RCP8.5) than the stabilization scenario (RCP4.5), because RCP 8.5 is known by temperature increments. With these simulations of high spatial resolution, we have been able to observe that the influence of buildings is very important in order to detect hot spots or sensitive areas to be affected by global climate change. It is important to recognize that there are many uncertainties in any effort to quantify the human health and economic impacts of climate change over the cities because there are model uncertainties in both economic and atmospheric simulations that are difficult to quantify. The results from this study could be usable by local authorities and stakeholders for assisting in developing better polices on health protections and balancing policy decisions. This study may enhance current understanding of climate change problems related to human health in the cities
Heating and cooling energy consumption of fifteen prototypes buildings and three real buildings during 2011 and 2100 in Madrid were simulated by using EnergyPlus model. We have showed the results for assessing energy demand responses to climate change. Results indicate that building energy demand in Madrid is very sensitive to the climate. The most serious impacts occur with the RCP 4.5 climate scenario for year 2100. The scenario RCP 4.5 for 2100 project to increases energy demand by around 23-24%, relative to the energy demand in 2011 for the three simulated buildings. Although part of the assessment is carried out for specific building prototypes, it demonstrates that both increase in heating energy and decrease in cooling energy over the RCP 8.5 can be significant due to climate change and the opposite results could be obtained with the RCP 8.5 with increments of electricity for cooling. The RCP 8.5 will produce climate conditions that are more favorable from a building energy demand point of view because it is characterized by temperature increments, so only increments for cooling are needed. The results through changes modelled in climate indicate that climate change (RCP 8.5) will not cause an increment of the energy consumption but if it is combatted (RCP 4.5) may increase energy consumption by 2100. In general, decreasing heating energy compensates the increased cooling energy.
ACKNOWLEDGEMENTS
The UPM authors acknowledge the computer resources and technical assistance provided by the Centro de Supercomputación y Visualización de Madrid (CeSViMa). The UPM authors thankfully acknowledge the computer resources, technical expertise and assistance provided by the Red Española de Supercomputación.). We acknowledge the DECUMANUS EU project from EU Space Call FP7-SPACE-2013-1 at SPA.20131.1-06. Ordnance Survey data for London: © Crown copyright and database rights 2015 OS 100021668.
REFERENCES
Bell ML, Peng RD, Dominici F.,2006. ”The exposure–
response curve for ozone and risk of mortality and the
adequacy of current ozone regulations,” Environ Health
Perspect 114:532–536.
Cartalis C, A. Synodinou, M. Proedrou, A. Tsangrassoulis, M. Santamouris, 2001. Modifications in energy demand in urban areas as a result of climate changes: An assessment for the southeast Mediterranean region. Energy Conversion Manage, 42pp. 1656–1674.
Christensen J.H. and Christensen O. B.,2007. “A summary of
the PRUDENCE model projections of changes in European
climate by the end of this century,” Climatic Change, vol. 81, pp. 7–30.
Department of Energy, 2010. EnergyPlus Engineering Reference,The Reference to EnergyPlus Calculations, Department of Energy, Washington, DC.
Grell GA, SE Peckham, R Schmitz, and SA McKeen, G Frost, WC Skamarock, and B Eder. 2005. Fully coupled 'online' chemistry in the WRF model. Atmos. Environ., 39, 6957-6976
Hutton G.,2011. “The economics of health and climate change:
key evidence for decision making,” Global Health 7:18.
IPCC, 2007. Climate Change. The Physical Science Basis; Cambridge University Press: Cambridge, UK; New York, NY, USA,
Oleson, K. W., A. Monaghan, O. Wilhelmi , M. Barlage , N. Brunsell , J. Feddema , L. Hu , and D. F. Steinhoff, 2010. Interactions between urbanization, heat stress, and climate change. Climatic Change, 129. 525-541.
Piringer M., E. Petz, I. Groehn, and G. Schauberger, 2007. “A
sensitivity study of separation distances calculated with the
Austrian Odour Dispersion Model (AODM),” Atmospheric
Environment, vol. 41, pp. 725-1735.
Radhi G.H., 2009. Evaluating the potential impact of global warming on the UAE residential buildings - A contribution to reduce the CO2 emissions. Building and Environment 44, 2451-2462.
Riahi, Steven Rose, Paul Runci, Ron Stouffer, Detlef van Vuuren, John Weyant, Tom Wilbanks, Jean Pascal van Ypersele, and Monika Zurek, 2008. Towards New Scenarios for Analysis of Emissions, Climate Change, Impacts, and
Response Strategies. Intergovernmental Panel on Climate Change, Geneva, 132 pp.
Riahi, K., Rao, S., Krey, V., Cho, C., Chirkov, V., Fischer, G., Kindermann, G., Nakicenovic, N., and Rafaj, P. , 2011. RCP 8.5-A scenario of comparatively high greenhouse gas emissions, Climatic Change, 109, 33–57
San Jose R, Juan L. Perez, Jose L. Morant, Rosa M. Gonzalez, 2007. European operational air quality forecasting system by using MM5-CMAQ-EMIMO tool, Simulation Modelling Practice and Theory, Volume 16, Issue 10.
San José R, J. Pérez, L. Pérez, R. González , J. Pecci, A. Garzón and M. Palacios,2016. “Impacts on the Urban Air Quality and Health of Global Climate Scenarios Using
Different Dynamical Downscaling Approaches,” Journal of
Geoscience and Environment Protection, 4, 168-174.
Smith, Ronald J. Stouffer, Allison M. Thomson, John P. Weyant1 & Thomas J. Wilbanks, 2010. The next generation of scenarios for climate change research and assessment. Nature 463, 747-756. doi:10.1038/nature08823
Vuuren, D.P., Edmonds, J., Kainuma, M., Riahi, K., Thomson, A., Hibbard, K., Hurtt, G.C., Kram, T., Krey, V., Lamarque, J.F., Masui, T., Meinshausen, M., Nakicenovic, N., Smith, S.J., Rose, S.K., 2011. The representative concentration pathways: an overview. Climatic Change 109, 5‐31.
Wilbanks, T. J. and Kates, R.W., 1999. Global change in local places: How scale matters, Climatic Change 43, 601–628.