AUTOMATIC CENTERLINE EXTRACTION OF COVERD ROADS BY SURROUNDING
OBJECTS FROM
HIGH RESOLUTION SATELLITE IMAGES
KEY WORDS: Maximum Likelihood Classification, Connected Component, RANSAC algorithm, Morphological Operators, Road Extraction, Minimum Map Unit (MMU) concept.
ABSTRACT:
This paper presents an automatic method to extract road centerline networks from high and very high resolution satellite images. The present paper addresses the automated extraction roads covered with multiple natural and artificial objects such as trees, vehicles and either shadows of buildings or trees. In order to have a precise road extraction, this method implements three stages including: classification of images based on maximum likelihood algorithm to categorize images into interested classes, modification process on classified images by connected component and morphological operators to extract pixels of desired objects by removing undesirable pixels of each class, and finally line extraction based on RANSAC algorithm. In order to evaluate performance of the proposed method, the generated results are compared with ground truth road map as a reference. The evaluation performance of the proposed method using representative test images show completeness values ranging between 77% and 93%.
1. Introduction
Automatic road and road centerline extraction from high-resolution satellite imagery has been an interesting research topic in the field of remote sensing (RS) and geographic information systems (GIS). Extracting precise and up-to-date road network information is a matter of issue when updating spatial databases.
The history of researches on road extraction from aerial and satellite images can be addressed on seventies. Road extraction methods based on image processing techniques have a widespread variety from road tracking methods that are based on state of semi-automatic and automatic definition of seed points (Bonnefon et al. 2002), morphological methods and filter techniques (Amini and Saradjian 2000; Amini et al. 2002; Talbot and Appleton 2007), deformable contour models (snakes) (Jeon et al. 2000; Laptev et al. 2000), segmentation and classification methods (Miao et al. 2014a; Shi et al. 2013), to artificial intelligent techniques such as neural network and genetic algorithms (Mokhtarzade and Zoej 2007). Classification of road extraction methods based on above criteria is available in the literatures (Mena 2003; Babaali at al. 2014).
Automatic road extraction methods from aerial and satellite images are clearly influenced by occlusion of road encircling objects such as buildings and trees. Moreover, occlusion caused by shadow of these objects is another factor affecting efficiency of the methods that use radiometric changes in their feature extraction step. In oppose, surrounding objects can sometimes provide supporting contextual information for road extraction (Miao et al. 2014b; Jin and Davis 2005).
Miao et al. (2014b) presented a semi-automatic method to extract road centerlines from VHR images. They argued that the surrounding objects, for instance occlusion of trees and shadows are problematic factors to optimize the extraction in high-resolution images. In order to overcome this issue, they
used a geodesic method with the help of road seed points which is semi-automatic and manual method. Jin and Davis (2005) presented an integrated system for automatic road mapping from high-resolution multi-spectral satellite imagery using multi-detector information fusion. The integrated system is implemented automatically and the results show a completeness range between 70 % and 86 % with correctness range between 70 % and 92 %. They believe that in high-resolution images, although the details such as street marking and cars provide additional context information, they also disrupt extracting the overall road classes as they faced some errors in their results due to disturbances from the surrounding objects.
The proposed method in this paper applies algorithms such as maximum likelihood classifier to categorize images into interested classes, connected component analysis to extract pixels of desired objects in each class, morphological operators to extract road centerline from satellite images, as well as RANSAC algorithm to convert road centerline into straight vector lines. The proposed method which is presented in section 2 applies on Quick-bird satellite resampled images with 1 m resolution from urban area of Isfahan city in Iran. This paper Followed by assesses performance and accuracy of the method in section 3, and discussion about the generated results in section 4.
2. Main Body
As discussed in introduction, many roads in urban city areas are surrounded by objects such as shadows, trees, vehicles etc., which they should be extracted and recognized by the method. Hence, classification of the images into different categorize based on maximum likelihood classifier method is done in advance.
2.1. Maximum likelihood classification Hamid Kamangir a; Mehdi Momeni b; Mehran Satari c
Dept. Geomatics, Faculty of Civil Engineering and Transportation, University of Isfahan, Isfahan, Iran
Maximum Likelihood (ML) is a supervised classification method that is based on the Bayes theorem. The general procedures in ML followed as:
1. Determining the number of classes within the study area.
2. Choosing the training pixel for each of the desired classes using pixel value information for the investigated area. Due to this purpose, Jeffries-Matusita (JM) distance presents class separability property of the chosen training pixels. In the normally distributed classes, JMs are calculated for two classes of JMij between i and j, as defined by following
equation:
�� = √ − −� (1)
Where α is the Bhattacharyya distance given by:
� =8 � − � � [(� +C )]− (� − � ) + | � +�
2 |
√|� ||� | (2)
Where � is mean vector and C is covariance matrix of each
class. JMij ranges from 0 to 2.0, where JMij > 1.9, 1.0 ≤ JMij ≤ 1.9 and JMij < 1.0 respectively indicate the property of ML
classifier algorithm as good, moderate and poor separability. For greater than 1 in this paper, more pixels were classified as background. However, due to misclassification for the values lower than 1, was empirically defined as 1.
3. Using training pixels to estimate the mean vector and covariance matrix of each class.
4. Finally, classifying each pixel of the image into one of the desired classes (Ahmad 2012).
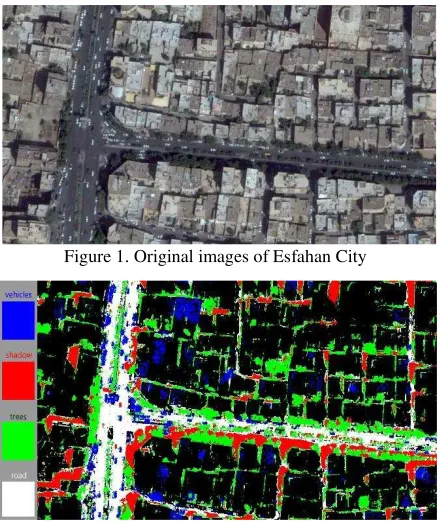
At first of the ML classification, images were categorized as 5 classes including: roads, trees, shadows, vehicles and other objects as background. Due to this purpose, some of the desired pixels were selected for each class according to their pixel values that is considered as training pixels. It is noteworthy that these training pixels are taken into account as a basic rule to classify all of the images. Figure 1 shows the original picture and the Figure 2 shows classified image.
Figure 1. Original images of Esfahan City
Figure 2. Classified image by maximum likelihood classifier
2.2. Modification process by morphological operators
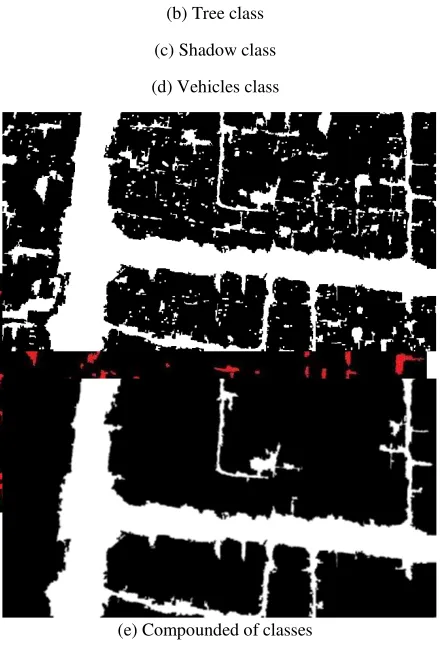
The obtained classes from the first step are including errors in the form of false positive pixels which are associated with the accuracy of ML classifier. These pixels affect the position accuracy of the extracted road centerline, thereafter they should be eliminated by applied modification processes. Due to this, a connected component algorithm based on morphological operators is used as the start point of the modification process to extract connected pixels as individual objects in each class (Sujatha and Selvathia, 2015). Then, some geometrical descriptors are applied to obtain the modified class of the objects and removing false positive pixels. The descriptors are extracted from background knowledge about shape of the objects such as high proportion of length to width in roads; definite length, width and area of vehicles which are rather small. The results of the proposed modification process are shown in Figures 3(a), 3(b), 3(c) and 3(d).
As it was mentioned in the introduction part, the extracted object classes consist of some supporting contextual information to extract a complete road network. For instance, in urban areas, some tree lines and linear shadows parallel to the road together with the detected vehicles help to verify segments of the road. Accordingly, objects of these classes which are connected with the class of the road are merged to create an initial raster road map as it can be seen from Figure 3(e). In order to get the final road as Figure 3(f), connected component and morphological operators from Figure 3(e) are taken into accounted once again.
(b) Tree class
(c) Shadow class
(d) Vehicles class
(e) Compounded of classes
(f) Final road map
Figure 3. (Test Image I): 3(a) Road class; 3(b) Tree class; 3(c) Shadow class; 3(d) Vehicles class; 3(e) Compounded of
classes; 3(f) Final road map
2.3. Road line extraction by morphological operators and RANSAC algorithm
In this step, pixels of road centerlines are extracted from raster road map by morphological operators such as dilation, closing, thinning and spur in a regular basis to filling the vacant spaces, removing jags of the edges, thinning the line and to remove additional branches respectively. As shown in Figures 4(a), if the morphological operators are just used once, it weakens the results, same as Figure 4(b). Hence, the operations are applied using a loop with a degree of iteration to obtain the pixels of road centerline. The number of iteration used in this investigation is 5 which is in accordance with experiences during calculations.
The last step is dedicated to obtain the final vector of road map using RANSAC algorithm. In this algorithm, a sample of data
is randomly selected which is considered as the primarily model. Then, a set of data points within threshold distance T of the model has been computed by the algorithm to re-estimate all of the points leading best fit line selection.
(a) Final road centerline by iteration technique
(b) Final road centerline by singly thinning and spur operators.
Figure 4. 4(a) Final road centerline by iteration technique; 4(b) Final road centerline by singly thinning and spur
operators.
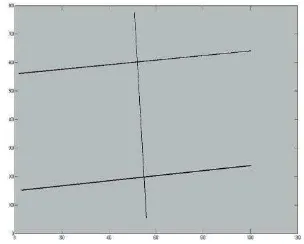
Calculation of threshold T requires the probability distribution of an inlier from the model. In practice, the distance threshold is often chosen empirically which is intended as 2 in this research. More information regarding RANSAC algorithm could be found in (Bolles and Fischler 1981). The final vector road centerlines generated from this study are shown in Figure 5.
Figure 5. Final vector road centerlines extracted by RANSAC algorithm
3. Performance assessment
In order to verify the performance of the proposed method, completeness, correctness, and quality indexes were calculated according to Minimum Map Unit (MMU) concept. MMU is an argument which asset the ability of an algorithm to detect, identify and classify urban land-use patterns
recorded on remotely sensed data. This arguments defined as
“the smallest size areal entity to be mapped as a discrete entity” (Rutchey et al. 2009). The size minimization is governed by the following factors (Welch 1982):
1. “The ability to consistently recognize, classify and delineate
parcels”.
2.”The available time for map compilation and the complexity
3.”The cartographic in accuracies involved in the portrayal
and measurement of small parcels”.
In this paper, extracted Road Network by the Method (RNM) is compare with extracted Road Network by an expert Operator (RNO) to calculate below indexes:
Completeness index is the ratio between matched reference road data that extracted by the method (RNM) and an expert operator (RNO) with total length of reference road map. The completeness is calculated by the following equation.
% = ℎ � ℎ ℎ ≅
��
��+��× (3)
Correctness index is the ratio between matched parts of RNM and RNO with total length of extracted road network which is calculated by the following equation: % = ℎ � ℎ � � �ℎ � � � ≅ ��+���� × (4)
Qualityof the road extraction result is measured using quality index. It considers both completeness and correctness of the extracted data. The value of quality is calculated by the following equation: � � = ℎ � � � � +ℎ � ℎ � � �ℎ � ℎ ≅��+��+���� × (5)
Where TP (true positive) is an element presented in RNO, RNM and FP (false positive) is an element present in RNM but not in RNO. FN (false negative) is an element present in RNO but not in the RNM (Sujatha and Selvathia 2015). 4. Discussion The proposed method is implemented on Quick-bird satellite resampled images with 1 meter resolution from urban area of Isfahan city in Iran. In order to assess the proposed method, Completeness, correctness and quality indexes are calculated in terms of percentage and round off to the nearest integer. To calculate these indexes, four areas are defined around each centerline in the raster RNO Figure 6 on different offsets. These offsets are defined as cell dimensions 3pixel×3pixel, 5 pixel ×5 pixel, 7 pixel ×7 pixel and 9 pixel ×9 pixel around the reference centerline pixels of RNO to assess the capability of the method in producing road centerline map with different scales. The result of assessment for test image I is presented in Table 1. Table 1. Performance measures of different index with different matrix dimension of Test image I. Matrix Dimension Completeness correctness Quality 3*3 78% 89% 77%
5*5 83% 94% 80%
7*7 88% 97% 86%
9*9 93% 99% 90%
According to images used in this paper, the allowed error to produce a 1/5000 map scale is 3 pixel offset around the reference centerline. The pixel offsets to produce 1/10000, 1/15000 and 1/20000 map scales are 5, 7 and 9 respectively. The results of implementing this algorithm for test image I in different offsets are shown in Table 1. As it can be seen from this Table, in order to produce a road centerline map with 1/5000 scale, 78 % completeness, 89 % correctness and 77 % quality were obtained.
Figure 6. Reference Ground truth of Test Image I
This algorithm is implemented on various images from Quick-bird images, as the corresponding results are given in Figure 7-8 and Table 2. The performance measures show that the lowest value of completeness is 77 % and the maximum value is 94 %.
(b) Raster map of centerline
(c) Vector map of centerline
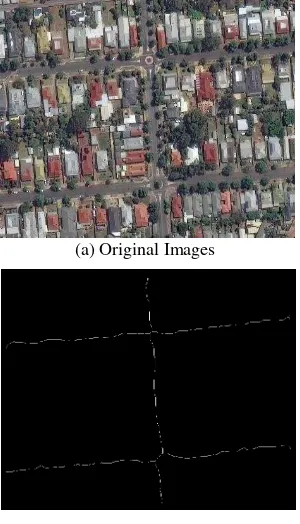
Figure 7. (Test Image II) Results of algorithm on various satellite images. 7(a) Original Images; 7(b) Raster map of
centerline; 7(c) Vector map of centerline.
(a) Original Images
(b) Raster map of centerline
(c) Vector map of centerline
Figure 8. (Test Image III) Results of algorithm on various satellite images. 8(a) Original Images; 8(b) Raster map of
centerline; 8(c) Vector map of centerline.
Table 2. Performance measures of proposed methodology with different images
Although fully automatic road extraction methods have been researched for many years, dissatisfied results have seen due
to surrounding objects (Miao et al. 2014a). In this article, an algorithm is proposed to extract roads which are influenced by surrounding objects such as trees, cars and shadows. Results showed that the proposed method is an efficient solution, especially, for disruption caused by shadows, trees and vehicles. The minimum and maximum completeness index values are 77 % and 94 % for tested areas in this paper. In very high resolution satellite and aerial raw images, some buildings have covered the roads surfaces due to relief displacements. This problem is out of the scope of this paper, however, it could be considered as a future work.
References
Ahmad, A. 2012. Analysis of Maximum Likelihood Classification on Multispectral Data. Applied Mathematical Sciences. Vol. 6, no. 129, 6425 - 6436.
Amini, J., Saradjian, M.R. 2000. Image map simplification by using mathematical morphology. ISPRS 33 (Part B3). 36. Amini, J., Saradjian, M.R., Blais, J.A.R., Lucas, C., Azizi, A. 2002. Automatic road side extraction from large scale image maps. Internat. J. Appl. Earth Observat. Geoinformat. 4, 95 107.
Babaali, K., Zigh, E., Djebbouri, M., Kadiri, M. 2014. Survey of Some New Road Extraction Methods. The International information system updating using remote sensing images. Pattern Recognition Lett. 23 (9), 1073–1083.
Jeon, B.K., Jang, J., Hong, K. 2000. Map based road detection in space-borne synthetic aperture radar images based on curvilinear structure extraction. Opt. Eng. 39 (9), 2413–2421. Jin, X., Davis, H.C. 2005. An integrated system for automatic road mapping from high-resolution multi-spectral satellite imagery by information fusion, Information Fusion. pp. 257– 273.
Laptev, I., Mayer, H., Lindeberg, T., Eckstein, W., Steger, C., Baumgartner, A. 2000. Automatic extraction of roads from aerial images based on scale space and snakes. Machine Vision and Applications.
Mena, J.B. 2003. State of the art on automatic road extraction for GIS update: a novel classification, Elsevier Pattern Recognition Letters 24, 3037–3058.
Miao, Z., Wang, B., Shi, W., Zhang, H. 2014. A Semi-Automatic Method for Road Centerline Extraction from VHR Images. IEEE GEOSCIENCE AND REMOTE SENSING LETTERS. VOL. 11, NO. 11, NOVEMBER.
Mokhtarzade, M., Zoej, M.J. 2007. Road detection from high resolution satellite images using artificial neural networks , International Journal of Applied Earth Observation and Geo information - INT J APPL EARTH OBS GEOINF. vol. 9, no. 1, 32-40.
Rutchey, K., Godin, J. 2009. Determining an appropriate minimum mapping unit in vegetation mapping for ecosystem restoration: a case study from the Everglades, USA. Landscape Ecol. 24:1351– 1362.
Shi, W., Miao, Z., Debayle, J. 2013. An Integrated Method for Urban Main-Road Centerline Extraction from Optical Remotely Sensed Imagery. IEEE TRANSACTIONS ON GEOSCIENCE AND REMOTE SENSING.
Sujatha, CH., Selvathia, D. 2015. Connected component based technique for automatic extraction of road centerline in high resolution satellite images. EURASIP Journal on Image and Video Processing. August.
Talbot, H., Appleton, B. 2007. Efficient complete and incomplete path openings and closings, Image and Vision Computing. Vol 25, Elsevier.