Volume 24, Number 1, 2009, 69 – 80
THE CONCENTRATION PATTERN AND IMPLICATION OF 2001
FLIGHT DEREGULATION POLICY ON DOMESTIC COMMERCIAL
FLIGHT INDUSTRY IN INDONESIA
Nurul Istifadah
Faculty of Economics, Airlangga University ([email protected])
ABSTRACT
To enhance competition in the transport market, the Government of Indonesia has, since 2001, implemented deregulation policy for the flight sector. Through the decree of Minister of Transportation No. 11/2001, the requirements to obtain a flight operator license are simplified and an airline company can operate even without having to have its own plane.
This research aims to analyze the condition before and after the flight deregulation policy. In particular, the purposes of this research are: (1) to analyze pattern of concentration for domestic commercial flight industry; (2) to calculate index of concentration for domestic commercial flight industry; (3) to analyze the market structure of domestic commercial flight industry; and (4) to analyze the implications of the flight deregulation policy in 2001. The measurement and analysis of the concentration pattern of domestic commercial flight industry are conducted using Hirschman-Herfindahl index, concentration ratio, and entropy index.
The results show that the concentration level of domestic commercial flight industry in Indonesia is smaller under the new policy than that under the regulated regime. Not only the number of airline companies increases, but the share of domestic flight market is also morediversed. While the structure of domestic commercial flight market in Indonesia is still oligopoly, it changes from rigid into less rigid.
Keywords: Concentration ratio; Hirschman-Herfindahl index; Entropy index; Domestic commercial flight industries; Flight deregulation policy.
BACKGROUND OF THE STUDY
A country with rapid economic develop-ment needs good and reliable transportation. Air transportation is important particularly when it is needed to save time. Moreover, a country such as Indonesia which consists of thousands of islands and a large number of citizens will be more efficient if reached by air transportation. Take an example, in Jakarta in which floods and traffic jams often occur, air transportation is now commonly used. Thus,
air transportation as a part of transportation sector becomes more important than other kinds of transportation.
decree no. 11 in 2001 on air flight procedures, Indonesian government gives an opportunity, especially, national investors to run their business in domestic flights. This decree ena-bles airlines to run their business in a mini-mum capital, 6 billion IDR. In the previous regulation, it was stated that an airline wanting to have flight transportation license had to have their own planes, while in the latest regulation, the companies do not need to own their private planes, but they may have access to the planes so that costly investment can be minimized.
The implication of the deregulation system increases private airlines in Indonesia, in which it also increases economic develop-ment in Indonesia. Prior to 2001, there were only five airlines serving domestic flights in Indonesia, namely Garuda Indonesia, Sempati Air, Merpati Nusantara, Bouraq Indonesia Airlines, and Mandala Airlines. They were not able to serve all regions in Indonesia. How-ever, since 2001, the number of domestic airlines has increased up to 14 companies.
The increase in the number of airlines is followed by rising competition among those companies and lowering market concentration. The consequence following that is price competitions. The ticket price becomes much cheaper, and this condition benefits the consumers as they have more choices to get low price tickets offered by the airlines. The phenomenon of low price tickets rises due to low cost carrier and low cost industry implemented by the companies.
The phenomenon of low cost carrier causes fierce competitions, not only in airlines but also in other transportation business. Many consumers prefer to use air transportation rather than other types of transportation such as: ship, bus, and train. Thus, the segment of air transportation is not only for upper class of society, but also medium up to lower class society.
The increase of airlines as the conse-quences of deregulation policy in 2001 brings
both positive and negative impacts toward airlines in Indonesia. Therefore, the impact of flight deregulation in 2001 toward flight industry in Indonesia must be analyzed thoroughly. The research can be focused either on domestic commercial flight or scheduled flight transportation. A scheduled flight is a flight transportation which is open to public and it is based on fixed and regular schedule, either arrival or departure.
This research aims to analyze the condi-tion prior to and after the flight deregulacondi-tion of Minister Decree no. 11 in 2001 on domestic commercial flight industry in Indonesia, namely: (1) analysis on concentration pattern; (2) calculating concentration index; (3) analysis on market structure; and (4) analysis on the implications due to flight deregulation policy in 2001.
RESEARCH METHODOLOGY
The definitions on concepts in the re-search are: concentration level, market structure, domestic commercial flight industry, and flight deregulation. Concentration level shows the competition among domestic com-mercial flight industry in Indonesia which is measured by Concentration Ratio (CR), Index of Hirschman-Herfindahl (IHH), and index of Entropy. The bigger the CR and IHH value, the bigger the concentration, and vice versa for index of Entropy.
The market structure of domestic com-mercial flight industry in Indonesia is measured from concentration level, barriers to
entry, and the number of company
barriers to entry and the market tends to be perfect in competition.
The three techniques used in this research are (Lipczynski&Wilson, 2001: 108-111) :
1. Concentration Ratio (CR) by measuring market share of n domestic commercial flight industry in Indonesia. The formula is as follow:
2. Index of Hirschman-Herfindahl (IHH) is formulated by adding quadrate of market share of all domestic commercial flight industry in Indonesia. The formulation is:
∑
where n is the total number of domestic commercial flight industry in Indonesia, and X1,..., Xn is the market share of each company. To find out how many companies are sustainable in the future, number equivalent is applied. Equivalent value is derived from 1/IHH.
3. Entropy coefficient measures uncertainty level of a certain company (Hart, 1971; Lipczynski, 2001). This measurement is used in information theory to find out the level of certainty level which can be achieved as a decision base. The formulation of entrophy coefficient is as follow:
FINDINGS AND DISCUSSION
The Development of Domestic Commercial Flight Industry In Indonesia
The national monetary crisis in 1998 affected the performance of domestic
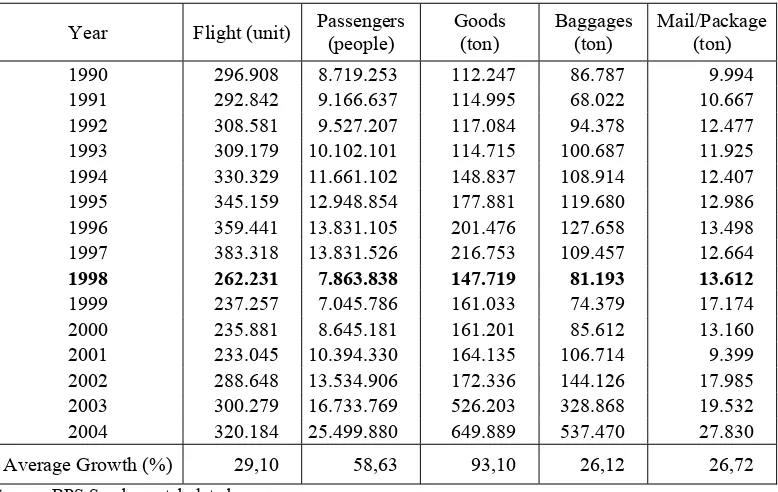
commercial flight industry in Indonesia. Compared to the previous years, the number of flight attendance generally decreased significantly. As shown in Table 1, in 1997 the number of passengers reached 13.831.526 people, while in 1998 there were only 7.863.838 people or decreased up to 43,15 percent. In 1999, the number of flight passengers decreased considerably, approxi-mately 10,40 percent. It was influenced by economic crisis and due to the increase of air transportation fare. Figure 1 showed that the number of flight attendance increased again after 2000.
Air fare increase in 1999 was almost three times higher than that prior to economic crisis. It was caused by Avtur increase and fuel as they were imported from other country. Moreover, the avtur price depended on USD fluctuation. The increase of air fare affected the number of passengers who went to various destination within Indonesia. Consequently, air transportation became the last choice for people to travel.
Nowadays, the trends of low cost
0 5,000,000 10,000,000 15,000,000 20,000,000 25,000,000 30,000,000
-60 -40 -20 0 20 40 60
Passengers 8,719,29,166,69,527,10,102,111,661,112,948,13,831,113,831,7,863,7,045,8,645,110,394,13,534,16,733,25,499
Growth 5 4 6 15 11 7 0 -43 -10 23 20 30 24 52
1990 1991 1992 1993 1994 1995 1996 1997 1998 1999 2000 2001 2002 2003 2004
(%
)
Passenge
rs
Gro
w
th
Source: BPS, tabulated.
Figure 1. The Growth of Domestic Flight Passangers During 1990 – 2004
Table 1. Departure of Flight Passengers, Goods, Baggages, and mail/Packages For Domestic Flight during 1990-2004
Year Flight (unit) Passengers
(people)
Goods (ton)
Baggages (ton)
Mail/Package (ton)
1990 296.908 8.719.253 112.247 86.787 9.994
1991 292.842 9.166.637 114.995 68.022 10.667
1992 308.581 9.527.207 117.084 94.378 12.477
1993 309.179 10.102.101 114.715 100.687 11.925
1994 330.329 11.661.102 148.837 108.914 12.407
1995 345.159 12.948.854 177.881 119.680 12.986
1996 359.441 13.831.105 201.476 127.658 13.498
1997 383.318 13.831.526 216.753 109.457 12.664
1998 262.231 7.863.838 147.719 81.193 13.612
1999 237.257 7.045.786 161.033 74.379 17.174
2000 235.881 8.645.181 161.201 85.612 13.160
2001 233.045 10.394.330 164.135 106.714 9.399
2002 288.648 13.534.906 172.336 144.126 17.985
2003 300.279 16.733.769 526.203 328.868 19.532
2004 320.184 25.499.880 649.889 537.470 27.830
Average Growth (%) 29,10 58,63 93,10 26,12 26,72
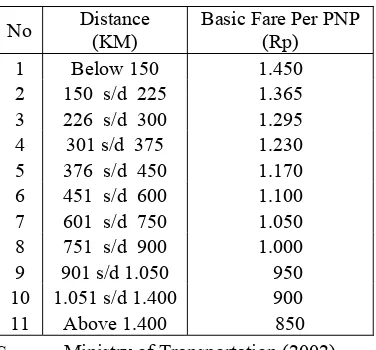
Based on Table 2, it is shown that since March 1, 2002, the government has issued the regulation of scheduled domestic air fare for economic class. The government, through minister decree no. 8 and 9 in 2002 has determined the maximum upper and lower limit which becomes the guideline of airlines. The regulation was made to protect the consumen and air transportation users. The Transportation Department has also imple-mented safety audit procedures for flight companies.
Table 2. Scheduled Domestic Air Fare Economic Class
No Distance
(KM)
Basic Fare Per PNP (Rp)
1 Below 150 1.450
2 150 s/d 225 1.365
3 226 s/d 300 1.295
4 301 s/d 375 1.230
5 376 s/d 450 1.170
6 451 s/d 600 1.100
7 601 s/d 750 1.050
8 751 s/d 900 1.000
9 901 s/d 1.050 950
10 1.051 s/d 1.400 900
11 Above 1.400 850
Source: Ministry of Transportation (2002)
The Passenger’s Safety Level of Domestic Commercial Flight Services
Safety, comfort, punctuality, and trust are the most important things in a flight service. Security means that air navigation orders are obliged by the company. In June 2005, the government through the Transportation Minis-ter issued a regulation (Peraturan Menteri Perhubungan) no. KM 35 in 2005 on the procedures of operating air transportation on jet engine category for air passengers. The
regulation stated that the air flight entering and registering for the first time in Indonesia had to have landing less than 50.000 times. In addition, the planes operated by companies were restricted to have 70.000 landing at most or no more than 35 years old, depending on which criteria reach the first time. According to the research of Aircraft Accident Investi-gation Commision/AAIC, aircraft accidents had risks five times more in Indonesia than in other countries.
Based on the data above, there were 169 aircraft accidents in Indonesia during 2001-2005. Of 169 accidents, 69 times (43 percent) happened in the airport due to coordination disconnection between plane guide on the airport and the pilot. Thus, it showed that the airport condition was very important consi-dering its function as the plane guide to take off. The airport had an important role in taking care of passengers’ safety. An airport having limited facility would result in less qualified service, and thus led to accidents. As a matter of fact, the high risk of accidents was not only caused by the airlines due to omitting some operational cost related to safety flight, but also caused by bad management of the airport as well as bad weather.
Table 3. The Policy Post Aircraft Accidents on Indonesian Aircraft Companies
No Date Description
1 March 22, 2007 The General Directorate of Air Transportation announced that none of the flight
companies in Indonesia fulfilled the highest score (category I) of passengers’ safety. Garuda Indonesia Company ranked the second position.
2 April 16, 2007 The United States prohibited its citizens living in Indonesia or in Asian countries
to use Indonesian airlines services.
3 June 26, 2007 The General Directorate of Air Transportation announced that Garuda Aircraft
company increased its rank into category 1, while other companies were still in the
2nd and 3rd rank.
4 June 26, 2007 Australia Embassy announced and warned Australian not to use Indonesian flight
companies which belonged to category 3.
5 June 28, 2007 European Union prohibited all Indonesian Aircraft companies to cross all over
European countries due to safety reason, and asked European people not to use Indonesian Aircraft companies.
Source: Jawa Pos, June 29, 2007
Based on various accidents happened in Indonesian Aircrafts, the government of Indonesia did evaluation on the performance of aircraft companies in Indonesia by using 20 items of evaluation criteria. The result of the auditing based on the criteria was then accu-mulated to determine the category of eva-luation as follows (www.hubud.dephub.go.id):
1. Category I
If the accumulation value was more than 161, the aircraft company was regarded as fulfilling the requirements of civil passenger safety.
2. Category II
If the accumulation was between 120 and 160, the aircraft company was regarded as fulfilling the minimum standard of flight safety, however; some requirements were still unfulfilled but did not affect the fight safety.
3. Category III
If the accumulation was less than 120, the aircraft company was regarded as fulfilling the minimum standard of flight safety, however; some requirements were still
needed to be fulfilled as they could affect the fight safety.
Besides publishing the announcement on flight audit result and planes grounded, the Ministry of Transportation also announced the flight companies which were banned. Since March 2005, 10 aircraft operator certificate (AOC) have been banned.
The Pattern of Concentration and the Market Structure of Domestic Commercial Flight Industry
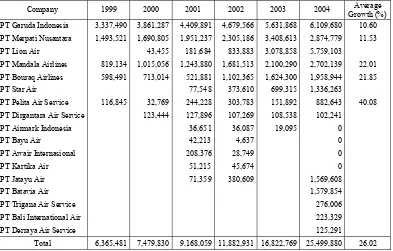
Table 4. The number of Passengers based on Domestic Airlines in Indonesia During 1999-2004 (people)
Company 1999 2000 2001 2002 2003 2004 Average
Growth (%) PT Garuda Indonesia 3,337,490 3,861,287 4,409,891 4,679,566 5,631,868 6,109,680 10.60
PT Merpati Nusantara 1,493,521 1,690,805 1,951,237 2,305,186 3,408,613 2,874,779 11.53
PT Lion Air 43,455 181,684 833,883 3,078,858 5,759,103
PT Mandala Airlines 819,134 1,015,056 1,243,880 1,681,513 2,100,290 2,702,139 22.01
PT Bouraq Airlines 598,491 713,014 521,881 1,102,365 1,624,300 1,958,944 21.85
PT Star Air 77,548 373,610 699,315 1,336,263
PT Pelita Air Service 116,845 32,769 244,228 303,783 151,892 882,643 40.08
PT Dirgantara Air Service 123,444 127,896 107,269 108,538 102,241
PT Airmark Indonesia 36,651 36,087 19,095 0
PT Bayu Air 42,213 4,637 0
PT Awair Internasional 208,376 28,749 0
PT Kartika Air 51,215 45,674 0
PT Jatayu Air 71,359 380,609 1,569,608
PT Batavia Air 1,579,854
PT Trigana Air Service 276,006
PT Bali International Air 223,329
PT Derraya Air Service 125,291
Total 6,365,481 7,479,830 9,168,059 11,882,931 16,822,769 25,499,880 26.02
Source: Ministry of Transportation, Air Statistics, tabulated.
Until 2001, the passengers of domestic commercial flight in Indonesia were dominated by Garuda Indonesia and Merpati Nusantara Airlines. However, since 2001 some new private airlines have been serving domestic commercial airlines in Indonesia. Although Garuda Indonesia owned bigger share of the passengers, its passengers’ growth decreased up to 12,12 percent. The growth was relatively lower compared to other private airlines such as Lion Air, Star Air, Jatayu Air, and Batavia Air. Those airlines were able to grow rapidly as they operated their business more efficiently and they were able to offer much cheaper tickets. Besides, those airlines served new routes. Having cheaper tickets, those private airlines were able to attract new customers to use air
transportation rather than land and sea transportation.
In order to measure the concentration level of domestic commercial airlines in
Indonesia, Concentration Ratio (CR),
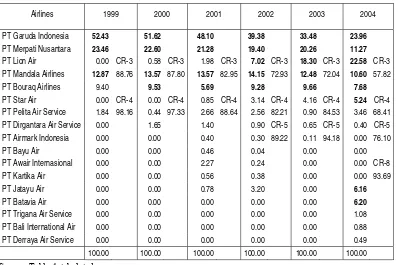
Table 5. Market Share and Concentration Ratio (CR) Index Based on Domestic Airlines in Indonesia During 1999-2004 (%)
Airlines
1999 2000 2001 2002 2003 2004
PT Garuda Indonesia 52.43 51.62 48.10 39.38 33.48 23.96
PT Merpati Nusantara 23.46 22.60 21.28 19.40 20.26 11.27
PT Lion Air 0.00 CR-3 0.58 CR-3 1.98 CR-3 7.02 CR-3 18.30 CR-3 22.58 CR-3
PT Mandala Airlines 12.87 88.76 13.57 87.80 13.57 82.95 14.15 72.93 12.48 72.04 10.60 57.82
PT Bouraq Airlines 9.40 9.53 5.69 9.28 9.66 7.68
PT Star Air 0.00 CR-4 0.00 CR-4 0.85 CR-4 3.14 CR-4 4.16 CR-4 5.24 CR-4
PT Pelita Air Service 1.84 98.16 0.44 97.33 2.66 88.64 2.56 82.21 0.90 84.53 3.46 68.41
PT Dirgantara Air Service 0.00 1.65 1.40 0.90 CR-5 0.65 CR-5 0.40 CR-5
PT Airmark Indonesia 0.00 0.00 0.40 0.30 89.22 0.11 94.18 0.00 76.10
PT Bayu Air 0.00 0.00 0.46 0.04 0.00 0.00
PT Awair Internasional 0.00 0.00 2.27 0.24 0.00 0.00 CR-8
PT Kartika Air 0.00 0.00 0.56 0.38 0.00 0.00 93.69
PT Jatayu Air 0.00 0.00 0.78 3.20 0.00 6.16
PT Batavia Air 0.00 0.00 0.00 0.00 0.00 6.20
PT Trigana Air Service 0.00 0.00 0.00 0.00 0.00 1.08
PT Bali International Air 0.00 0.00 0.00 0.00 0.00 0.88
PT Derraya Air Service 0.00 0.00 0.00 0.00 0.00 0.49
100.00 100.00 100.00 100.00 100.00 100.00
Source: Table 4, tabulated.
0.00 20.00 40.00 60.00 80.00 100.00 120.00
CR-3 88.76 87.80 82.95 72.93 72.04 57.82
CR-4 98.16 97.33 88.64 82.21 84.53 68.41
CR-5 89.22 94.18 76.10
1999 2000 2001 2002 2003 2004
Source: Table 5.
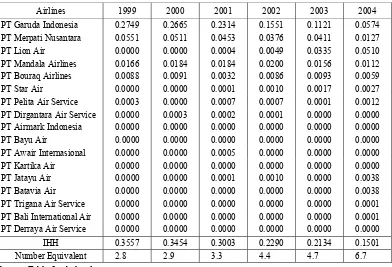
The calculation using IHH index was presented in Table 6 which showed decreasing value, from 0,3557 in 1999, 0,3003 in 2001, and 0,1501 in 2004. This tendency had an implication that market share was diversified to other airlines. The Market share which was previously dominated by PT Garuda Indo-nesia, PT Mandala Airlines, and PT Merpati Nusantara, were diversified in 2004 to other private airlines, such as Lion Air, Batavia Air, and etc. The decrease of IHH value was the effects of flight dereguation toward domestic commercial airlines. The market structure could be measured through the number of the company, market share distribution, or the concentration level of domestic commercial airlines in Indonesia (Lipczynski and Wilson, 2001).
Based on IHH calculation, the number equivalent could be counted. The calculation
showed that equivalent number was bigger after 2001. The equivalent number was de-rived from 1/IHH. The lower the IHH, the bigger is the equivalent number, vice versa. The equivalent number showed the companies which would be sustainable in the long period in certain IHH level. Thus, in the low concen-tration level (IHH) or bigger equivalent num-ber, more airlines would be sustainable.
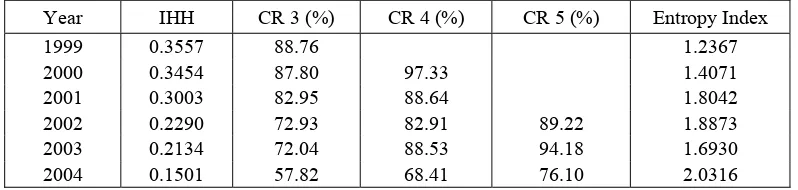
The calculation using Entrophy (E) index showed increasing number. Value E = 0 indi-cated monopoly market structure if there was no substitute product (Lipczynski & Wilson, 2001: 110). On the other hand, bigger value E indicated bigger gaps (Kuncoro, 2002: 89). Thus, the result of CR, IHH, and Entrophy index calculation shown in Table 7 generally described that the market structure of domestic commercial airlines in Indonesia tended to focus on oligopoly. The market structure
Table 6. Index of Hirschman Herfindahl and Number Equivalent Domestic Commercial Airlines Services in Indonesia During 1999-2004
Airlines 1999 2000 2001 2002 2003 2004
PT Garuda Indonesia 0.2749 0.2665 0.2314 0.1551 0.1121 0.0574
PT Merpati Nusantara 0.0551 0.0511 0.0453 0.0376 0.0411 0.0127
PT Lion Air 0.0000 0.0000 0.0004 0.0049 0.0335 0.0510
PT Mandala Airlines 0.0166 0.0184 0.0184 0.0200 0.0156 0.0112
PT Bouraq Airlines 0.0088 0.0091 0.0032 0.0086 0.0093 0.0059
PT Star Air 0.0000 0.0000 0.0001 0.0010 0.0017 0.0027
PT Pelita Air Service 0.0003 0.0000 0.0007 0.0007 0.0001 0.0012
PT Dirgantara Air Service 0.0000 0.0003 0.0002 0.0001 0.0000 0.0000
PT Airmark Indonesia 0.0000 0.0000 0.0000 0.0000 0.0000 0.0000
PT Bayu Air 0.0000 0.0000 0.0000 0.0000 0.0000 0.0000
PT Awair Internasional 0.0000 0.0000 0.0005 0.0000 0.0000 0.0000
PT Kartika Air 0.0000 0.0000 0.0000 0.0000 0.0000 0.0000
PT Jatayu Air 0.0000 0.0000 0.0001 0.0010 0.0000 0.0038
PT Batavia Air 0.0000 0.0000 0.0000 0.0000 0.0000 0.0038
PT Trigana Air Service 0.0000 0.0000 0.0000 0.0000 0.0000 0.0001
PT Bali International Air 0.0000 0.0000 0.0000 0.0000 0.0000 0.0001
PT Derraya Air Service 0.0000 0.0000 0.0000 0.0000 0.0000 0.0000
IHH 0.3557 0.3454 0.3003 0.2290 0.2134 0.1501
Number Equivalent 2.8 2.9 3.3 4.4 4.7 6.7
change resulted in fiercer competition among airlines or lower barriers to entry. Since 2001, the market share was not only concentrated on two airlines, namely Garuda Indonesia and Merpati Nusantara, but also scattered to some new airlines with various gaps.
THE CONCLUSION AND THE IMPLI-CATION OF FLIGHT DEREGULATION IN 2001
The policy of deregulation on domestic commercial airlines in Indonesia was marked by issuing the Decree of the Minister of Transportation No. 11 in 2001 on Air Trans-portation Procedures. The implication of the deregulation policy was increasing competi-tion among domestic commercial flight industry due to more number of airlines in Indonesia. The policy of flight deregulation gave an opportunity to national inverstors to enter domestic commercial flight market in Indonesia. After the deregulation was issued, the number of domestic commercial flight industry increased, from 5 to 17 airlines having new schedules.
The calculation on CR, IHH, and Entropy index showed that the concentration level of domestic commercial flight inductry in Indonesia was getting lower during 1999-2004 period. This condition resulted in fiercer competition among airlines, even distribution of market share among airlines, and smaller barriers to entry.
Moreover, based on IHH calculation, the equivalent number was also bigger. It indi-cated that there were more number of airlines which were sustainable on domestic commer-cial flight industry. It means that the perfor-mance of domestic commercial flight industry in Indonesia was better if more companies were sustainable on the market of domestic commercial flight industry. However, the more number the airlines (exceeded the equi-valent number), the worse is their performan-ce.
The increase of the competition among domestic commercial flight industry also resulted in the lower flight ticket (the flight ticket which used to be expensive turned to be cheaper). The lower ticket price caused the competition not only among airlines, but also among other kinds of transportation. Many people changed their ways of transportation, from land and sea transportation to air trans-portation so that the number of domestic commercial flight passengers increased every year.
To regulate price competition on flight industry, the government issued a regulation on flight cost scheduled domestically for economic class in March 1, 2002. The regu-lation determined the maximum upper and lower price for the sake of consumer/flight passengers. The price might be applied by airlines provided that it was within the mini-mum tariff. The price competition among airlines often resulted in bankruptcy as some Table 7. Index of Hirschman Herfindahl (IHH), Concentration Ratio (CR), and Index of Entrophy
Domestic Commercial Flight Inductry in Indonesia During 1999-2004
Year IHH CR 3 (%) CR 4 (%) CR 5 (%) Entropy Index
1999 0.3557 88.76 1.2367
2000 0.3454 87.80 97.33 1.4071
2001 0.3003 82.95 88.64 1.8042
2002 0.2290 72.93 82.91 89.22 1.8873
2003 0.2134 72.04 88.53 94.18 1.6930
2004 0.1501 57.82 68.41 76.10 2.0316
airlines could not compete with those which applied efficient management and offered lower ticket price.
The tariff competition, eventually, gave both positive and negative implication. The positive implication resulted in the airlines which were more efficient in operating their business, while the negative implication was indicated by the rise of the number of accidents in flight industries in Indonesia.
In order to avoid more accidents in air transportation, the government needs to have coordination with all parties related to air transportation system. Evaluation and better-ment on air transportation managebetter-ment such as supply and demand balance regulation, plane feasibility, airlines efficiency, airport management, and so forth had to be con-ducted. Finally, the government was expected not to give the opportunity to new airlines operate their business on air transportation. The number of airlines had even exceeded the equivalent number (the equivalent number in 2004 was 7 airlines).
REFERENCES
Adler, H. A., 1982. Evaluasi Ekonomi Proyek-Proyek Pengangkutan (Economic Evaluation on Tranportation Projects ). Jakarta: UI-Press.
Asari, D. C. H., dan Rahardjo, Gatot, 2006. “Mengurai Rencana Undang-Undang Menajuk Keselamatan”.(”Analyzing The Constitution Plan, Prominently The Savety”). Angkasa Magazine, Vol. 1, No. 5, Februari.
Badan Pusat Statistik Surabaya (Surabaya Berau of Statistic Centre), (City Goverment of Surabaya) (Pemerintah Kota Surabaya), Communication statistic (Transportation Statistics), 1990- 2005. Departemen Perhubungan (Department of
Communication), Keputusan Mentri No. 11 Tahun 2001 tentang Penyelenggaraan Angkutan Udara n (Ministry Decree Number 11/2001 about The
Implementation of Air Transportatio), Jakarta.
Dorimulu, P., 2003. Adu Kuat Penerbangan Nasional (Strength Fight of National Flight). Majalah Investor (Investor Magazine), Edisi 75, 9-22 April.
Hooper, Paul, 1998. Airlines Competition an Deregulation in Developed and Deve-loping Countries Contex Australian and India. Australia: University of Sidney. Kamaludin, Rustian, 2003. Ekonomi
Trans-portasi: Karakteristik, Teori, dan Kebi-jakan (Economic Transportation: Characteristic, Theory, and Policy. Jakarta: PT Ghalia Indonesia.
Kuncoro, Mudrajad, 2002. Analisis Spasial dan Regional, Studi Aglomerasi dan Kluster Indonesia (Spacial and Regional Analysis, Aglomerasi study and Indonesian Cluster). Yogyakarta: UPP AMP YKPN.
Kusumantoro, Iwan, Pradono, Syabri, Ibnu, Widiarto, 2007. Essays In Sustainable Transportation. Kelompok Keahlian Sis-tem Infrastruktur Wilayah dan Kota ITB, Bandung (ITB, Bandung Team Expertice of Regional and City Infrastructure System).
Locklin, D. Philip, 1966. Economic of Trans-portation, Sixth Edition: Air Transpor-tation, USA.
Martin, Stephen, 1988, Industrial Economics, Analysis and Public Policy. New York: Macmillan Publishing.
Nijkamp, Peter, 1986. Handbook of Regional and Urban Economic, Volume II, Nort Holland, Amsterdam.
Company Aviation Commerce on Air Plane Operation, Section 1 Article (2). In http://www.hubud.dephub.go.id.Sited on September 2,2008).
Polak, Jacob B., and Arnold Heertje, 2000. Analytical Transport Economics An Inter-national Perspective, Edward Elgar Publishing Limited, Cheltenham, UK, Northampton, MA, USA.
Rachbini, D. J., 2005, “Tak Harus Kembali ke Sistem Kartel” (”Dont have to return to Kartel System”). Quoted from Kompas Newspaper, June 15, 2005, P.15 (Kompas, 15 Juni 2005, hal. 15).
Republik Indonesia (Republic of Indonesia), Keputusan Menteri Perhubungan No. 11 tahun 2001 tentang Penyelenggaraan
Angkutan Udara (Ministry of
Communication Decree Number 11/ 2001 about The Implementation of Air Transportation). Jakarta
Republik Indonesia (Republic of Indonesia), Undang-Undang No. 15 tahun 1992. tentang Penerbangan (Contitution Number 15/ 1992 about Aviation). Rukmana, Nana, 1993. Manajeman Pembangunan Prasarana Perkotaan (Management of
Urban Infrastructure Building). Jakarta: LP3ES.
Stacey R. K., and M. L. Kenneth, 1996. Deregulation and Adaptation of Gover-nance Structure: The Case of US Airlines Industry. New York: University of Rochesth.
Salim, Abbas, 1993. Manajemen Transportasi (Tranportation Management). Jakarta: PT Raja Grafindo Persada,.
Sutaningtyas, Nanik, 2005. “Maskapai Sesuai-kan Tarif Terbang” (”Aviation Company Suit Flight Cost). Pagi Surya Newspaper, June. In http:// www.harianpagisurya.com (Surya, Juni. Dalam http://www. harianpagisurya.com).
SWA Sembada, 2004. ”Singa Belia Bernama Lion Air”(Young Lion Named Lion Air). SWA Sembada, 17/XX/19 Agustus-1 September 2004).