Jurnal Ekonomi dan Bisnis Indonesia Vol. 23, No. 2, 2008, 107– 123
THE IMPACT OF WORLD OIL PRICES
TO INDONESIA’S
MACROECONOMY: Crisis and After Crisis
Banoon Sasmitasiwi1, Malik Cahyadin2
Pusat Studi Ekonomi dan Kebijakan Publik (PSEKP) Universitas Gadjah Mada
(1banoon@psekp.ugm.ac.id, 2malikcahyadin@yahoo.com)
ABSTRAKSI
Penelitian ini bertujuan untuk menganalisis dampak kenaikan harga minyak dunia terhadap kinerja makroekonomi Indonesia. Kinerja makroekonomi Indonesia diindikasikan oleh Gross Domestic Product (GDP) riil, inflasi, tingkat suku bunga, dan defisit anggaran pemerintah. Tingkat inflasi dicerminkan oleh Indeks Harga Konsumen (IHK). Data yang digunakan dalam kajian empiris ini adalah data sekunder runtut waktu kuartalan dari tahun 1997.I sampai 2006.III atau 39 pengamatan yang diperoleh dari berbagai penerbitan. Alat analisis yang digunakan adalah model Structural Vector Autoregression (SVAR) dengan penekanan pada analisis impulse response.
Hasil estimasi model Structural Vector Autoregression (SVAR) yang ditunjukkan oleh analisis impulse response. Impulse Response Function (IRF) memberi informasi bahwa dengan asumsi Indonesia merupakan negara pengimpor minyak (net importer country) diperoleh hasil bahwa GDP riil memberikan respon negatif terhadap shock kenaikan harga minyak. Inflasi, tingkat suku bunga, dan defisit anggaran pemerintah memberikan respon positif terhadap shock kenaikan harga minyak, dan juga memberikan respon negatif terhadap shock makroekonomi. Dalam studi ini, shock makroekonomi adalah shock terhadap GDP.
Kata Kunci: shock harga minyak, kinerja makroekonomi Indonesia, model SVAR, impulse response
INTRODUCTION
Oil and natural gas sectors have important
role in Indonesia’s economy because as
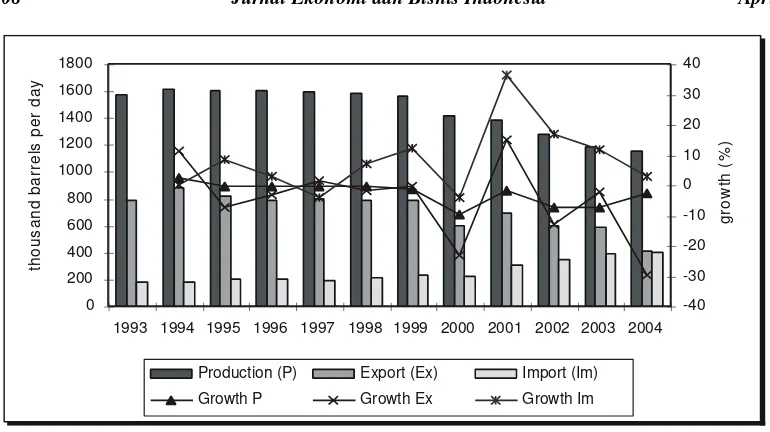
foreign exchange producer commodity and factors of production (raw material and fuel) for the sector of transportation, household, power plant and industry (Prawiraatmadja, 2005). In order to fulfilling the requirement of oil in Indonesia, at this moment there are 7 refineries with capacity installed, these are from Pangkalan Brandan, Dumai, Plaju, Cilacap, Balongan, Balikpapan and Shove (Maskurun, 2005). Production growth and
Indonesia’s crude oil export and import can be
seen in Figure 1.
Figure 1 shows that Indonesia crude oil
production continue to experience of
degradation accompanied by increasing import
oil. During period 1993 – 2004, it indicates
Nubi (Total Indonesia), Nilam, Zamrud South and SE BNE Bekasap (BOB Bumi Siak Pusako), and Argo field (JOB Petrochina Salawati). On the other side, OPEC (Organi-zation of Petroleum Exporter Countries) summit in Nigeria at middle of December 2006 has decided to clip quota of production equal to 500 thousand barrels per day start on February 2007. The cutting of last production has done in last month which counted 1.2 million barrels per day.
The production quota, meant for the
increase of oilprice which have slow down 20
percent since reaching its top about 78 percent per barrel on July and August 2006. OPEC wants world crude oil price in relatively constant price around 60 US dollars per barrel in 2007. That condition is constituted by reduction quota production of 39,000 barrels per day, whereas the cutting on Februari 2007 only 16,000 barrels per day. But Indonesia other side, government has released a policy to
increase price of oil/Bahan Bakar Minyak
(BBM) which of course has a direct
impli-cation to the inflation rate. The condition of
destroyed by oil price distortion a world of tend to increase since period early economic crisis in Indonesia, in the middle of the 1997. Figure 2 shows movement of world oil price at
year period 1995 – 2004, while Figure 3
shows movement of economic growth, deficit growth and inflation of governmental budget of Indonesia during period 1997 - 2004. Deficit growths of budget have fluctuation that tend to decrease and contrast with the direction of inflation rate. If related to the movement of budget deficit and world oil price also make a move up at is trade-off. This
0
1993 1994 1995 1996 1997 1998 1999 2000 2001 2002 2003 2004
th
Production (P) Export (Ex) Import (Im)
Growth P Growth Ex Growth Im
Source: Migas and Pertamina (modified)
2008 Sasmitasiwi & Cahyadin 109
condition means that the higher world oil price, the greater tendency of governmental budget deficit and growing of domestic
inflation, with the assumption that government still give oil subsidy to society in gross and Indonesia position as net importer country.
0
Source: WTI in http://www.iea.org (modified)
Figure 2. The World Oil Price (US$/barrel)
-100,00
Growth of GDP (%) Inflation (%) Growth of Budget Defisit (%)
Source: BPS and Bank Indonesia (modified)
Figure 3. The Growth of GDP, inflation and Growth of Budget Deficit of Indonesia (%)
The early stage of Indonesia’s Crisis
Related to budget deficit, government have authority to do adjust the budget according to the world oil price distortion, ability of domestic production and tendency of increasing of domestic oil consumption.
However, policy of BBM price righteously do
not only instructed to protect budget deficit because the policy consequence extremely big to inflation rate, society purchasing power and distortion in transportation sector. Ikhsan (2005) explains the level of governmental budget allocation impact for the subsidy of oil at state budget shall be as follows:
“Each month postponement will be
valuable of Rp10 trillion subsidy additions or let leakage equal to Rp8 trillion per month. Delaying 1 month will be about Rp10 trillion deficit additions that it’s not clear of financing source. Adding domestic debt will be very costly its expense because the loans that be asked by market for governmental obligation is almost 15%. Become its fare not merely adding governmental debt equal to Rp10 trillion but also interest expenses equal to Rp150 trillion per year. It is important to know that budget amount is Rp10 trillion and its loans have financed the rehabilitation of all schools and building infrastructure for 7,150
villages in Indonesia.”
On November 2007, world crude oil price reached US$95 per barrel. This condition had impact to depreciation of exchange rate and governmental budget deficit. This condition
was caused by increasing subsidy of BBM.
The depreciation of Rupiah exchange rate happened from Rp9.315 per US$ became Rp9.390 per US$ in the middle of November
2007 (Media Indonesia, November 2007).
Government had predicted that amount of
subsidy of BBM and electricity would increase
sharply at this time. The subsidy of BBM
increased to Rp87 trillion from the target of
governmental budget (APBN) equal to Rp55
trillion. Meanwhile, subsidy of electricity
became Rp42 trillion from early prediction equal to Rp34 trillion (Suhud, 2007).
At this time, the production of Indonesia crude oil less than its target. From 150 oil fields that Indonesia have, only 58 fields that active. Minister of Energy and Mining
Resources, Purnomo Yusgiantoro felt
disappoint with the decreasing of crude oil production after Regional Autonomy exist. As example, the oil field in Riau after it was organized by regional government, the production decreased from 60,000 barrels to 22,000 barrels. In 2007, production of Indonesia crude oil will reach 910 barrel per day. If the targets of lifting can not be reached, government can do compensation policy with increasing of price side amount of 118% (Media Indonesia, November 2007).
Based on phenomenon movement of world oil price, economic growth, interest rates, Indonesia budget deficit and inflation, the research about the impact of world oil price to Indonesian economy is really important. Condition of Indonesia economy in
this research is expressed by GDP, economic
growth, interest rates, budget deficit and inflation. Analysis method which is used in this research is Structural Vector Auto
regression (SVAR) model.
THE RESEARCH QUESTION
The question of this research is “to what
extent world oil price shocks have brought any impacts on macroeconomic performance in
Indonesia?” The macroeconomic perfor-mances are depicted by growth of real GDP,
SBI 3-months interest rates, governmental
budget deficit, and consumer price index.
THE RESEARCH BENEFITS
2008 Sasmitasiwi & Cahyadin 111
oil to society. In addition, increasing of world oil price would affect the Indonesia inflation rate caused by tendency that Indonesia becomes net importer country.
THEORETICAL FRAMEWORK
World Oil Prices and Domestic Inflation
Oil prices remain an important determi-nant of global economic performance. Increasing of oil price leads to a transfer of income from importing to exporting countries through a shift in the terms of trade (IEA, 2004).
The explanation of the impact between oil prices and inflation had been developed by
Hooker (2002) in FRBSF (2005), 1962–2000
periods. His model used the rate of change of oil prices, the unemployment gap (which is the prevailing unemployment rate relative to a benchmark known as the natural rate of unemployment) and lagged inflation to predict core PCI inflation. Statistical tests found a break in the estimated relationship among these variables at the end of 1980. When he allowed this relationship to differ between the
periods 1962–1980 and 1981–2000, he found
that oil prices had a significant impact on inflation in the earlier period, but not in the later period.
Roubini and Setser (2004) found that oil prices shocks have a stagflation effect on the macroeconomic of an oil importing country. The size of the output growth/level effect and inflation rate/price level effect of an oil shock depend on many factors. They are: (1) the size of the shock, both in terms of the percentage increase in oil prices and the real price; (2) the
shock’s persistence; (3) the dependency of the economy on oil and energy; and (4) the policy response of monetary and fiscal authorities.
Cartel Phenomena
The OPEC cartel has pursued a high price strategy in an oil market under pressure from rising demand. While it may have encountered
short-run capacity constraints, OPEC did not commit to increase oil output and bring the price to a lower, more manageable level.
Instead, it has actually cut oil output
intermittently (Saxton, 2007). The movement and development of oil market in the world
significantly dependent on the role of OPEC’s
mission. The Mission of the OPEC is to coordinate & unify the petroleum policies of Member Countries & ensure the stabilization of oil prices in order to secure an efficient, economic & regular supply of petroleum to consumers, a steady income to producers & a fair return on capital to those investing in the petroleum industry.
Theoretically, cartel markets are identified
as a group of producer’s organization to
anticipate and reduce risk from competitors through collusive agreement. Generally, cartel can be divided into two types; (1) cartel for maximizing profit and (2) cartel in order to separate market (Sudarman, 2002).
METHODOLOGY
Econometric Specification
Most oil price increases have been followed by a raise in the federal funds rate. Historically, increases in the price of crude oil tend to raise inflationary pressures and
governmental budget deficit1. Based on
Bernanke et al (1997) argue that the
systematic component of monetary policy accounts for a large portion of the decline in GDP growth that follows an oil shock. Although, the magnitude of the systematic component is a matter of debate (Hamilton and Herrera, 2004, Herrera and Pesavento,
2006, and Bernanke et al, 2004), there is no
doubt that identifying the effect of systematic
1
monetary policy is central to understanding the dynamic response of macro variables to oil shocks and macroeconomic shocks across the periods of interest.
In order to explore the role of monetary policy in the dynamic response of macro variables to oil shocks and macroeconomic shocks, we extend the modified VAR
framework of Bernanke et al (2004), to
analyze the effect of oil price shocks across
the two periods of interest.2 We estimate a
quarterly structural VAR describing the
behavior of the vector yt, which contains three
blocks of variables. The first block includes the following macroeconomic variables: the log growth of real GDP (gdp_rev,t), interest rates (sbi,t), the log of governmental budget deficit (def_revisi,t), and net oil price increase (net_oil_adj,t). The following block contains the log growth of real GDP (gdp_rev,t), interest rates (sbi,t), the log of consumer price index as expressed of the inflation rate
(ihk_1,t), and net oil price incease
(net_oil_adj_t). Especially, the last block includes three variables in VAR model, which are the log growth of real GDP (gdp_rev,t), innovations. We identify the response function
L
crisis periods.placing restrictions on certain elements ofB03.
The restrictions are given by:
0 _
0
0 Source of Data
In this paper we use quarterly data, in the
spirit of Bernanke et al (2004). In this manner
we are able to include 3- quarterly lags in our
VAR specification. This is of particular
relevance given that we split the sample in two smaller sub-periods, which are crisis and after crisis. In addition, using quarterly data allows us to make our results comparable to previous literature on output and the other macro variables volatility.
The data include macroeconomic
variables series from the first quarter of 1997 to the third quarter of 2006. As we mentioned before, the macroeconomic variables include the log growth of real GDP, the log of consumer price index as expressed the inflation rate, the net oil price increase, the log
of governmental budget deficit, and the SBI
3-months interest rates. Data for real GDP, governmental budget deficit, consumer price index, and the SBI 3-months interest rates were obtained from the Statistical of Indonesian Finance and Economics database of the Central Bank of Indonesia. As a measure of oil price changes we use the net oil price increase which records the percentage change in the price of oil from the
International Energy Agency (IEA) Report.
2008 Sasmitasiwi & Cahyadin 113
Stationary Data
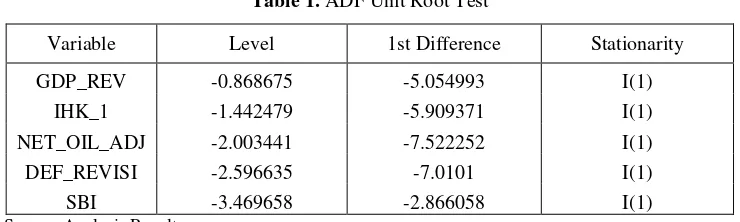
Based on Augmented Dickey Fuller
(ADF) unit root test is known that variables
can be used in this research, including log growth of real GDP, log of consumer price index as expressed the inflation rate, net oil price increase log of governmental budget
deficit, and SBI 3-months interest rates is
stationer in first differences or I(1).
VAR ANALYSIS AND DISCUSSION
As mentioned in the previous section, the
data span between 1997 and 2006.
Nevertheless, as initially documented by Kim and Nelson (1999) and Mc-Connell and Perez-Quiros (2000) there is strong evidence of a structural break in volatility of GDP growth at the beginning of 1984. More recent work has confirmed the presence of a break anywhere between the fourth quarter of 1982 and the first quarter of 1989 with 90% confidence interval (Herrera and Pesavento, 2005). Therefore, in this research we divide the sample in two sub-samples: 1997:1 to 1999:4
and 2000:1 to 2006:34. We have two reasons
to split the sample at those particular dates.
4
Chow Break Point Test on period of 1998:1 – 2005:4 (the date should be within the current sample of observations) shows that null hypothesis (H0) is
accepted or rejected. Its mean that there is a structural break point or not. Generally, the result of Chow Break Point Test on period of 1998:1 – 1999:4 is significant. Its mean that in those periods have structural break. And also on period of 2000:1 – 2005:4 have structural break (see appendix).
First, because we want to study whether the
economy’s response to an oil price shock has
changed and macroeconomic shocks in crisis period, we need to eliminate the period in which the structural break is possibly located. Second, we want to investigate the macro variables of oil shocks and macroeconomic shocks after crisis period. The exclusion of the possible break provides the additional advantage that the model would not have a structural break in the variance covariance matrix during the estimation of our VAR.
Oil Price Shocks
Oil prices remain an important determi-nant of global economic performance. Overall, an oil price increase leads to a transfer of income from importing to exporting countries through a shift in the terms of trade. The magnitude of the direct effect of a given price increase depends on the share of the cost of oil in national income, the degree of dependence on imported oil and the ability of end-users to reduce their consumption and switch away from oil. Naturally, the bigger the oil price increase and the longer higher prices are sustained, the bigger the macroeconomic impact. For net oil-exporting countries, a price increase directly increases real national inco-me through higher export earnings (Interna-tional Energy Agency, 2004).
Higher oil prices since 1999 lead to inflation, increased input costs, reduced non-oil demand and lower investment in net non-
oil-Table 1. ADF Unit Root Test
Variable Level 1st Difference Stationarity
GDP_REV -0.868675 -5.054993 I(1)
IHK_1 -1.442479 -5.909371 I(1)
NET_OIL_ADJ -2.003441 -7.522252 I(1)
DEF_REVISI -2.596635 -7.0101 I(1)
SBI -3.469658 -2.866058 I(1)
importing countries. Tax revenues fall and the budget deficit increases, due to rigidities in government expenditure, which drives interest rates up. An oil price increase also changes the balance of trade between countries and exchange rates. Net oil-importing countries normally experience deterioration in their balance of payments, putting downward pressure on exchange rates. As a result, imports become more expensive and exports less valuable, leading to a drop in real national income. Without a change in central bank and government monetary policies, the dollar may
tend to rise as oil-producing countries’
demand for dollar-denominated international reserve assets grow (International Energy Agency, 2004).
Based on Figure 4 and Figure 5, we can suggest that interest rates and governmental budget deficit give negative response to Gross
Domestic Product (GDP) in Impulse Response
Function (IRF). This condition is shown by
path position from interest rates and governmental budget deficit in below of main
line (0.0). It’s mean that if interest rates and
governmental budget deficit increase, the Gross Domestic Product (GDP) will decreases at a long time. And also we can see the dynamic response of interest rates and budget deficit to oil price increase. The interest rate and budget deficit give positively response to oil price increase. Whereas oil price increase gives negative response to Gross Domestic Product (GDP), our macroeconomic shocks.
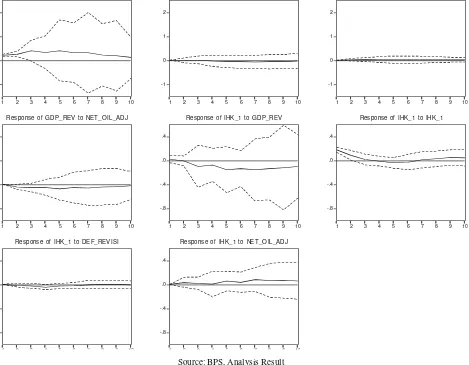
Based on Figure 6, we can suggest that consumer price index as expressed by the inflation rate gives negative response to Gross Domestic Product (GDP) in Impulse Response Function (IRF). It means that if the inflation rate increases, Gross Domestic Product (GDP) will decreases significantly. In Impulse Response Function (IRF), we can also suggest that the inflation rate gives positive response to oil price increase. It means that the higher oil price will cause the higher inflation rate.
Based on Figure 7, we can suggest that the inflation rate gives positive response to inte-rest rates significantly. It means that higher interest rates will cause higher inflation rate. Therefore, the inflation rate gives negative response to Gross Domestic Product (GDP). This condition shows that relationships between Gross Domestic Product (GDP) and inflation rate are negative significantly.
J Response of GDP_REV to GDP_REV
-1.5 Response of GDP_REV to SBI
-1.5 Response of GDP_REV to DEF_REVISI
-1.5 Response of GDP_REV to NET_OIL_ADJ
-40 Response of SBI to GDP_REV
-40 Response of SBI to SBI
-40 Response of SBI to DEF_REVISI
-40 Response of SBI to NET_OIL_ADJ
-1.2 Response of DEF_REVISI to GDP_REV
-1.2 Response of DEF_REVISI to SBI
-1.2 Response of DEF_REVISI to DEF_REVISI
-1.2 Response of DEF_REVISI to NET_OIL_ADJ
-40 Response of NET_OIL_ADJ to GDP_REV
-40 Response of NET_OIL_ADJ to SBI
-40 Response of NET_OIL_ADJ to DEF_REVISI
-40 Response of NET_OIL_ADJ to NET_OIL_ADJ Response to Cholesky One S.D. Innovations ± 2 S.E.
Figure 4. IRF for effect inflation rate and interest rate response to GDP and interest rates
response to oil price increase
Sa
Response of SBI to GDP_REV
-40
Response of SBI to SBI
-40
Response of SBI to DEF_REVISI
-40
Responseof SBI to NET_OIL_ADJ
esponse of DEF_REVISItoGDP_REV
-1.2
Response of DEF_REVISI to SBI
-1.2
Response of DEF_REVISI to DEF_REVISI
-1.2
Response ofDEF_REVISI to NET_OIL_A
Source: Ministry of Finance, Analysis Result
J
Response of IHK_1 to GDP_REV
-.3
Response of IHK_1 to IHK_1
-.3
Response of IHK_1 to DEF_REVISI
-.3
Response of IHK_1 to NET_OIL_ADJ
esponse of DEF_REVISI to GDP_REV
-.8 -.4 .0 .4 .8
Response of DEF_REVISI to IHK_1
-.8 -.4 .0 .4 .8
Response of DEF_REVISI to DEF_REVISI
-.8 -.4 .0 .4 .8
Response of DEF_REVISI to NET_OIL_A
Source: Bank Indonesia, Analysis Result
J
ur
na
l Ek
o
n
o
m
i d
a
n B
is
nis
I
nd
o
nes
ia
A
p
ril
1
19
Source: BPS, Analysis Result
Figure 8. IRF for effect Gross Domestic Product response to oil price increase
-10 1 2
1 2 3 4 5 6 7 8 9 10
-1 0 1 2
1 2 3 4 5 6 7 8 9 10
-1 0 1 2
1 2 3 4 5 6 7 8 9 10
1 2 3 4 5 6 7 8 9 10
Response of GDP_REV to NET_OIL_ADJ
-.8 -.4 .0 .4
1 2 3 4 5 6 7 8 9 10
Response of IHK_1 to GDP_REV
-.8 -.4 .0 .4
1 2 3 4 5 6 7 8 9 10
Response of IHK_1 to IHK_1
Response of IHK_1 to DEF_REVISI
-.8 -.4 .0 .4
Supply and Demand Sides of the World Crude Oil
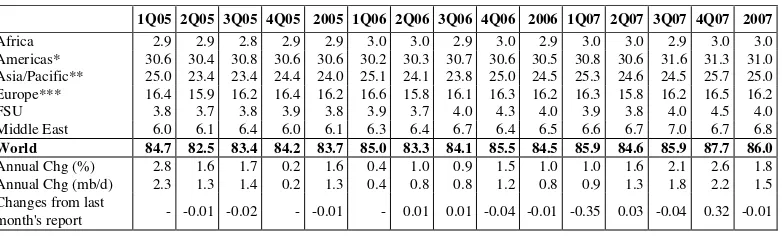
Global oil product demandhas been kept
virtually unchanged at 84.5 mb/d in 2006 and 86.0 mb/d in 2007. Downward revisions to 4Q06 OECD data were largely offset by upward changes in non-OECD figures. In percentage terms, world demand is estimated to have grown by 1.0% in 2006; in 2007, it is
expected to increase by 1.8% 5.
OECD oil product demand has been
slightly lowered by 35 kb/d in 2006 and 56 kb/d in 2007. Data revisions and continuing mild temperatures, particularly in Europe and the Pacific, weighed down on heating and residual oil demand. Total OECD oil product demand is estimated to have declined by 0.9% in 2006, but it is still expected to rebound by 0.8% in 2007 to 49.6 mb/d.
Non-OECD oil product demand has been
adjusted upwards slightly in 2006 and 2007,
due to a rebasing of India’s consumption and
revisions to FSU and China apparent demand. Non-OECD oil product consumption is now estimated to have grown by 3.7% in 2006.
This year, demand is expected to rise by 3.3% to 36.5 mb/d.
World oil supply drifted lower by 65 kb/d in February to 85.5 mb/d as a 130 kb/d reduction in total OPEC supply countered a modest rise from non-OPEC. Preliminary data suggest that the UK, Canada, Kazakhstan, Brazil, Angola and Iraq saw higher February output, offset by markedly lower production from the US, Mexico, Norway, Saudi Arabia and Venezuela.
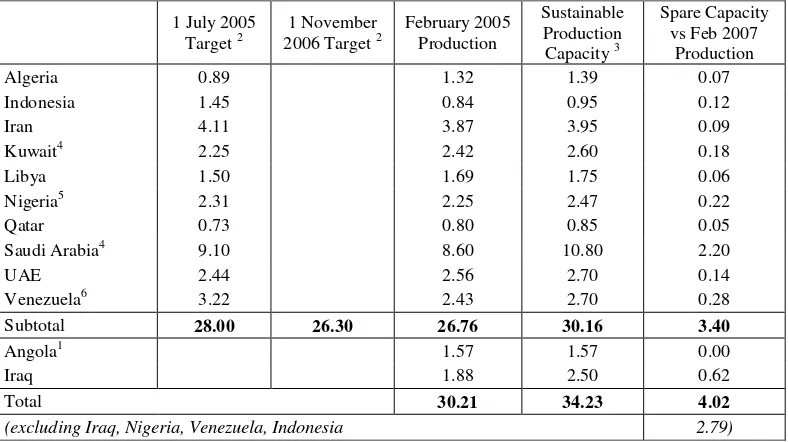
Total OPEC crude supply averaged 30.2
mb/d in February, a fall of 125 kb/d versus January. Recovering southern exports pushed Iraqi supply up by 185 kb/d to 1.9 mb/d while rising new field output saw Angolan produc-tion breach 1.55 mb/d. Offsetting supply cuts came from all other OPEC members, led by Saudi Arabia (100 kb/d), Venezuela (65 kb/d), Kuwait, Iran and UAE (35-40 kb/d each). Nigerian production continues to struggle, with up to 800 kb/d of shuttered production in early March. Effective spare OPEC capacity was up by 320 kb/d to 2.8 mb/d in February. Sustainable production capacity could rise by some 800 kb/d to 35 mb/d by end-2007.
Table 2. Global Oil Demand (million barrels per day)5
1Q05 2Q05 3Q05 4Q05 2005 1Q06 2Q06 3Q06 4Q06 2006 1Q07 2Q07 3Q07 4Q07 2007
Africa 2.9 2.9 2.8 2.9 2.9 3.0 3.0 2.9 3.0 2.9 3.0 3.0 2.9 3.0 3.0
Americas* 30.6 30.4 30.8 30.6 30.6 30.2 30.3 30.7 30.6 30.5 30.8 30.6 31.6 31.3 31.0
Asia/Pacific** 25.0 23.4 23.4 24.4 24.0 25.1 24.1 23.8 25.0 24.5 25.3 24.6 24.5 25.7 25.0
Europe*** 16.4 15.9 16.2 16.4 16.2 16.6 15.8 16.1 16.3 16.2 16.3 15.8 16.2 16.5 16.2
FSU 3.8 3.7 3.8 3.9 3.8 3.9 3.7 4.0 4.3 4.0 3.9 3.8 4.0 4.5 4.0
Middle East 6.0 6.1 6.4 6.0 6.1 6.3 6.4 6.7 6.4 6.5 6.6 6.7 7.0 6.7 6.8
World 84.7 82.5 83.4 84.2 83.7 85.0 83.3 84.1 85.5 84.5 85.9 84.6 85.9 87.7 86.0
Annual Chg (%) 2.8 1.6 1.7 0.2 1.6 0.4 1.0 0.9 1.5 1.0 1.0 1.6 2.1 2.6 1.8
Annual Chg (mb/d) 2.3 1.3 1.4 0.2 1.3 0.4 0.8 0.8 1.2 0.8 0.9 1.3 1.8 2.2 1.5
Changes from last
month's report - -0.01 -0.02 - -0.01 - 0.01 0.01 -0.04 -0.01 -0.35 0.03 -0.04 0.32 -0.01
* OECD North America & Latin America ** OECE Pacific, China & other Asia *** OECD & non-OECD
Source: International Energy Agency – Oil Market Report in http://www.oilmarketreport.org
5 Oil Market Report.
Jurnal Ekonomi dan Bisnis Indonesia April 121
Table 3. OPEC Crude Production (million barrels per day)
1 July 2005
Target 2 2006 Target 1 November 2 February 2005 Production
Sustainable Production Capacity 3
Spare Capacity vs Feb 2007
Production
Algeria 0.89 1.32 1.39 0.07
Indonesia 1.45 0.84 0.95 0.12
Iran 4.11 3.87 3.95 0.09
Kuwait4 2.25 2.42 2.60 0.18
Libya 1.50 1.69 1.75 0.06
Nigeria5 2.31 2.25 2.47 0.22
Qatar 0.73 0.80 0.85 0.05
Saudi Arabia4 9.10 8.60 10.80 2.20
UAE 2.44 2.56 2.70 0.14
Venezuela6 3.22 2.43 2.70 0.28
Subtotal 28.00 26.30 26.76 30.16 3.40
Angola1 1.57 1.57 0.00
Iraq 1.88 2.50 0.62
Total 30.21 34.23 4.02
(excluding Iraq, Nigeria, Venezuela, Indonesia 2.79)
1. Angola joins OPEC effective 1 January 2007.
2. Target production levels superseded by decision to cut output by 1.2 mb/d from 1 November 2006 and 0.5 mb/d from 1 February 2007. Implied aggregate production targets around 26.3 mb/d from November and 25.8 mb/d from February.
3. Capacity levels can be reached within 30 days and sustained for 90 days. 4. Includes half of Neutral Zone Production.
5. Nigeria excludes some 545 kb/d of shut-in capacity
6. Includes Orinoco extra heavy oil assumed at 525 kb/d in February
Source: International Energy Agency – Oil Market Report in http://www.oilmarketreport.org
CONCLUSIONS
In this paper we analyze the contribution of oil prices shocks and macroeconomic
shocks to the decline in Indonesia’s output,
budget deficit and inflation volatility. Oil prices remain an important macroeconomic variable: higher prices can still inflict substantial damage on the economies of oil-importing countries and on the global economy as whole. For this period, the impulse response indicates dynamic response macro variables, which include Gross Domestic Product (GDP), governmental budget deficit, interest rates, and inflation rate to oil shocks and macroeconomic shocks.
Based on this research analysis, interest rates and governmental budget deficit give negative response to Gross Domestic Product
increase in Impulse Response Function (IRF). Because of oil price increase leads to inflation and the budget deficit increases, so Gross Domestic Product (GDP) downturn.
The implication of world oil price fluctuation has affected budget deficit significantly. This condition is a result from an increasing of oil subsidy allocation in governmental budget. Unfortunately, this research does not studying about effect of oil price to oil subsidy allocation, so expected existence of furthermore research.
The results of the simulations presented in this paper suggest that further increases in oil prices sustained over the medium term would undermine significantly the prospects for continued global economic recovery.
Oil-importing developing countries would
generally suffer the most as their economies are more oil-intensive and less able to weather the financial turmoil wrought by higher oil-import costs.
APPENDIX
Chow Break Test
Chow Breakpoint Test: 1998:1 1999:4
F-statistic 6.383728
Probability
0.000641
Log likelihood ratio 22.35152
Probability
0.000171
Source: Analysis Result
Chow Breakpoint Test: 2000:1 2005:4
F-statistic 8.641613
Probability
0.000069
Log likelihood ratio 27.94756
Probability
0.000013
Source: Analysis Result
REFERENCES
Arpa, Markus, Jesus Crespo Cuaresma, Ernest Gnan and Maria Antoinette Silgoner.
2006. “Oil Price Shock, Energy Prices and
Inflation — A Comparison of Austria and
the EU”. Monetary Policy & the Economy Q1.
Bernanke, B.S., M. Gertler, and M. Watson.
1997. “Systematic Monetary Policy and
the Effects of Oil Price Shocks.”
Brookings Papers on Economic Activity, 91-142.
Bernanke, B.S., M. Gertler, and M. Watson.
2004. “Reply to Oil Shocks and
Aggregate Macroeconomic Behavior: The
Role of Monetary Policy: Comment.”
Journal of Money, Credit, and Banking
36(2), 286-291.
Enders, Walter. 1995. Applied Econometric
Jurnal Ekonomi dan Bisnis Indonesia April 123
FRBSF. 2005. “Oil Price Shocks and Inflation”. Economic Letter Number
2005-28. October 28. San Francisco.
Hamilton, J.D., and A.M. Herrera. 2004. “Oil Shocks and Aggregate Economic Beha-vior: The Role of Monetary Policy:
Comment.” Journal of Money, Credit, and Banking 36(2), 265-286.
Herrera, A.M., and E. Pesavento. 2005. “The
Decline in U.S. Output Volatility: Structural Changes and Inventory
Invest-ment.” Journal of Business & Economic Statistics, Vol. 23, No.4. pp.462-472 Herrera, A.M. and Elena Pesavento. 2006.
“Oil Price Shocks, Systematic Monetary Policy and the “Great Moderation.”
Humpage, Owen F. and Eduard Pelz. 2003.
“Do Energy Price Spikes Cause Infla
-tion?”. Federal Reserve Bank of Cleve -land. April 1.
Ikhsan, Mohamad. 2005. www. kolom.pacific.
net.id. 03 Oktober.
International Energy Agency (IEA). 2004.
“Analysis of the Impact of High Oil Prices
on the Global Economy”. May.
Jones, Donald W., Paul N. Leiby, and Inja K.
Paik. 2002. “Oil Price Shocks and the
Macroeconomy: What Has Been Learned
Since 1996.”
Kim C. and C. R. Nelson. 1999. “Has the U.S.
Economy Become More Stable? A Bayesian Approach Based on a
Markov-Switching Model of Business Cycle.”The Review of Economics and Statistics, 81 (4), 608-616
Kompas, 18 Februari 2008.
Maskurun. 2005. “Minyak Mentah, BBM dan
Teknologi-Process di Kilang Minyak (Refinery). STEKPI dan IIEE. Jakarta.
McConnell, M.M. and G. Perez-Quiros. 2000.
“Output Fluctuations in the United States: What Has Changed Since the early
1980s?”. American Economic Review, 90 (5), 1464-1476.
Media Indonesia, November 2007.
Nova, Rully. 2007. Rupiah Dekati 9.400 per Dolar AS. Media Indonesia
Prawiraatmadja, Widhyawan. 2005. “Gambar
-an Terkini Sektor Migas”. STEKPI dan IIEE. Jakarta.
Roubini, Nouriel and Brad Setser. 2004. “The
Effects of the Recent Oil Price Shock on
the U.S. and Global Economy”. August.
http://www.stern.nyu.edu/globalmacro
Saxton, Jim, 2007. “OPEC Strategy and Oil Price Volatility”. Joint Economic
Committee.
Suara Karya, 26 Desember 2006.
Sudarman, Ari. 2002. Teori Ekonomi Mikro. BPFE. Yogyakarta. Edisi Empat.
Schneider, Martin. 2004. “The Impact of Oil
Price Changes on Growth and Inflation”.
Monetary Policy & the Economy Q2.
Suhud, Raja. 2007. Subsidi BBM Melonjak Tajam 2007. Media Indonesia.
www.bi.go.id.
www.bps.go.id.
www.iea.org.
www.oilmarketreport.org.