CHAPTER 1 INTRODUCTION
1.1. Background
Climate change refers to changes in climate that can be identified by changes
in the average temperature or the variability in nature and lasts for a long period,
usually decades, according to Climate Change 2007-Synthesis Report of
Intergovernmental Panel on Climate Change (IPCC) [1]. Climate change brings
abnormal variations in the Earth's atmosphere and subsequent effects on other parts of
the planet, as inland plants, and reduction of annual yield. The melting of the polar
icebergs causes sea level rise and flooding in the lowlands [2].
Climate change is the most serious, complex, and multidimensional challenge
to humanity at the beginning of the 21st century, maybe even until the 22nd century.
There is no country or group of people in the world able to escape from this
challenge. The challenge of climate change and global warming forces to revise
human behaviors and lifestyle. Political decisions, patterns of development, choice of
technology, socioeconomic conditions, and international agreements are important
aspects of climate change.
There are facts that the earth's temperature is increasing, rainfall patterns
change drastically, climate and weather becomes extreme, catastrophic droughts
happen, huge storms and flood attack, the heat waves and forest fires spread almost
clean water haveincreasingly threatened by the failure and decline of agriculture and
fishery outcomes, as well as face health problems and malnutrition, famine and
plague [3].
Weather and climate on Earth actually change seasonally, annually and in
decades. However, extreme weather comes more frequently than in previous years
and seems to continue for the long period. The study by the scientists, who are
members of the Intergovernmental Panel on Climate Change (IPCC), indicated that
climate change started in the last 150 years and it was found not only in nature, but
alsoin consequence of human activities.
Human activity is a driving force of the global warming and climate change.
Human activities, especially activities related to the utilization of energy resources
from fossil fuels (petroleum, natural gas and coal) should be mentioned.
1.1.1. Global Warming
Global warming is one of typical phenomena of climate change. Activities in
the industry and the transport sections have emitted exhaust gases since the industrial
revolution in Western Europe and the emitted gases have been accumulated in the air
for a long time. The accumulation of atmospheric pollutants transformed into
greenhouse gas (GHG) brings about the phenomenon of global warming. Among
greenhouse gases, the most important ones are carbon dioxide (CO2), methane (CH4),
nitrous oxide (N2O), and chloro fluoro carbon (CFC). All these elements contribute
temperature of the earth's atmosphere is warmed up and heated up, which is called
global warming.
Global warming occurs gradually over hundreds of years, but its impact has
been recognized in the present. Although the industrial age began almost one million
years before, the concentration of CO2 in the atmosphere was only about 170-250
ppm at that era. When the industrial revolution began in England around 1850, the
concentration of CO2 in the atmosphere began to rise to 280 ppm and Earth's average
temperature increased by about 0.740C. However, it is estimated by IPCC scientists
that the accumulation of CO2 in the atmosphere has reached 390 ppm160 years after
the industrial revolution. The burning of fossil fuels and part of forest conversion
cause this phenomenon. If the patterns of production and consumption, and life styles
are kept unchanged, it is estimated that in 100 years later, CO2 concentration will
continue to increase up to 580 ppm or over double of that before the industrial
revolution.
The earth's average temperature will rise by 1.10C over a period of 50-100
years, if humans do not take any action to stabilize GHG in the atmosphere.
Therefore, according to the IPCC assessments, international communities fought
through the United Nations Framework Convention on Climate Change (UNFCCC)
and enacted Kyoto Protocol 17 years ago, which aimed to keep the earth's
temperature rise of less than 20C threshold. To keep the earth's temperature rise of
less than 20C, the concentration of CO2 in the atmosphere should be suppressed and
stop the CO2 emission or at least reduce CO2 emission by 80% of the emission level
in 1910.
Small island states in the Pacific Ocean belong to the Alliance of Small Island
Developing States (AOSIS) set a target of the maximum temperature rise of 1.50C
and the CO2 concentration in the atmosphere of less than 350 ppm, which must be
achieved by 2015. All countries should follow the AOSIS target and reduce their
carbon emission by 2015. The earth's temperature rise of more than the 20C threshold
will negatively affect small islands and low-lying. It is estimated that nearly 40% of
small islands will be submerged in the ocean [4].
To reduce CO2 emission, other energy resources replacing fossil fuels are
developed in the world. One of big potential energy resources is a renewable energy
resource like biomass represented by woods. However, convenience in the use of
fossil fuels must be kept for renewable energy resources. Gasification of wood is one
of most promising ways.
1.1.2. Energy Crisis
It is anticipated that world energy consumption increases by approximately
70% during the period 2000 to 2030 as shown in Fig 1.1 [5]. Therefore, it should be
noted that an average increase per year of 2.38% is significantly larger than 1.4%
increase per year in the period from 1980 to 2000. In 2030, fossil fuels (coal, oil,
Figure 1.1. Worlds Energy Consumption [5].
In figure 1.2. the evolution of energy consumption per capita in 2030 is
illustrated for various regions of the world. Except Community of Independent States
(CIS), Central and Eastern European Countries (CEEC), energy consumption per
capita in each region gradually increases to 2030. As shown at the left hand side of
the figure, energy consumption of the world also gradually increases to 2030.
Since the world population is projected to also increase every year and reach more
than 8.3 billion in 2030 from 6.1 billion in 2000, it can be easily understood that the
world energy consumption significantly rises to 17,000 (=2. 1x8.3x109) Mtoe
(million ton of oil equivalent) in 2030.
Oil, gas and coal supplies in the world are anticipated sufficing for the next
three decades. In figure 1.3. the world oil production is projected to increase up to
around 6,000 Mtoe in 2030.++
Figure 1. 3. World Oil Production [5].
Sources: World energy, technology and climate policy outlook 2030 (WETO)
Similarly, world gas and coal productions are projected to increase up to 4,800
and 4,400 Mtoe in 2030, respectively in World energy, technology and climate policy
outlook (WETO) by the European Commission. The total world fossil fuel
production in 2030 can suffice for world consumption of fossil fuel in 2030.
energy consumption is projected to increase from 504.7 quadrillion Btu (1270 Mtoe)
in 2008 to 769.8 quadrillion Btu (1990 Mtoe) in 2035. It is also projected that energy
consumption in developing countries in Asia will increase from 137.9 quadrillion Btu
(348 Mtoe), which is around a half of the OECD, in 2008, to 298.8 quadrillion Btu
(751 Mtoe) in 2035, which is corresponding to total energy consumption of OECD in
2035 [6].
As mentioned above, demand for fossil fuels will be still strong in 2030. The
developing countries in Asia, especially, China and India will continue their
economic development that needs large amount of energy. Indonesia, Malaysia,
Thailand and Vietnam will run after two heading countries in Asia. If fossil fuel has
still a dominant role in energy supply in 2030 and later as shown in Fig. 1.1, it is very
difficult to moderate the climate change and prevent the global warming. We need a
scenario to solve such energy crisis.
1.1.3. Indonesia Energy Conditions
Energy consumption in 2000 reached 760 million Barrel Oil Equivalent
(BOE) and increased gradually to reach 829 million BOE in 2004 at an average
increase rate of 2.1% per year and decreased by 0.12% of total consumption in the
previous year in 2005. However, in 2006 to 2010, energy consumption again
Figure 1.4. The Energy Consumption in 2000 - 2010 by Type [6]
According to Indonesia Energy Outlook 2012, as shown in Fig. 1.5, the basic
scenario based on the average GDP growth rate of 7.6% per year projects that energy
demand in 2030 becomes nearly three times larger than the energy demand in 2010.
According to the scenario MP3EI based on the GDP growth rate of 10.4% per year,
the anticipated energy demand in 2030 rises to 4.3 times of the energy demand of this
year 2013. In the short term, namely in the year 2015, energy demand is increasing at
a rate of 4.5 % per year. The energy demand in the short term has no significant
difference between the basic scenario and the scenario MP3EI.
As the driving force of the national economy, the energy demand of the
industrial sector is expected to continually rise and dominate the total final energy
demand, followed by the transportation sector's energy demand as a supporter of
Figure 1. 5.Projection of total final energy demand by energy sector [6]
1.1.4. Renewable Energy Status in Indonesia
Development of renewable energy today is still relatively low, but has an
important role in contributing to the electric energy supply in Indonesia. Some
renewable energy comes from solar energy, wind energy (wind), biomass,
hydroelectric power (hydropower) and geothermal energy. In Fig.1.6, it is indicated
that the Presidential Decree No. 5 decided a government program to increase the
production of renewable energy from 7 percent to 15 percent in fraction of total
energy production by 2025. The government should positively advance the
installation of renewable energy power plants in order to achieve the target that the
Figure 1.6. Current Energy Mix versus Future Energy Goals [7].
According to the Renewable Energy Market Assessment Report: Indonesia,
Indonesia has a source of renewable energy is large enough, as shown in Table 1.1. It
means that there is big potential in Indonesia to develop carbon-neutral energy that
can moderate climate change and prevent further global warming:
1. Hydropower:
Indonesia as an archipelagic country has great potential for developing
energy from hydroelectric power (hydropower) and ocean energy
technology. Indonesia State Electricity Company has estimated energy of
75,650 MW by water. Currently, Indonesia produces only 4,264 MW of
hydropower. In 2007, the United Nations provides grants to the Indonesian
government in the form of integrated development programs to accelerate
2. Geothermal energy:
Indonesia has large geothermal energy sources as known in the world.
Currently, geothermal energy plants have been installed only 1,052 MW of
total estimated energy source, 27,510 MW. By 2025, the government is
planning to increase the geothermal energy up to 5% of total energy.
3. Biomass Energy:
Sources of biomass energy in Indonesia reached 49,810 MW. This is a
huge potential, next to hydropower potential, but currently only 445 MW is
utilized. In 2025, the government target is to produce electrical energy of
810 MW from biomass. This number is still small compared to the amount
of potential availability. Sewage plants, namely logs, lumber waste, rice
husk, bagasse, rubber, oil palm empty fruit bunches and all kinds of plants
can be used to generate electricity.
4. Solar Energy (solar energy):
The potential of solar radiation in the whole of Indonesia is estimated at
4.8kWh/m2/day. Until now, Indonesia has installed12.1 MW plants. High
investment cost is necessary, because the main tool sand solar photovoltaic
modules are imported from other countries and the efficiency of
photovoltaic modules is only 16% and as a result, the price of1 kW solar
electricity is still relatively high. Such constraints discourage the
increase the installed capacity of solar plant, the Government should issue a
regulation or devise programs for solar plant development in Indonesia.
5. Wind Energy:
Indonesian potential for wind energy is still limited because of the lack of
wind along the equator. The area in small islands has potential for wind
power, but in those islands, the population is quite likely small. The total
wind potential is estimated at 9,910 MW, but only 1.10 MW plant has been
installed.
Table 1. 1. Renewable Energy Potential in Indonesia [7].
No Energy Installed Resource Undeveloped
Biomass is one of the energy resources used for cooking in rural households.
Besides, it is also used for a raw material in the energy industry and commercial
sector. In the processing industry and forest plantations, biomass is used to generate
According to the Basic Scenario 2010-2030 [8], biomass supply is statistically
projected to drop from 41 million BOE (5.5 Mtoe) in 2010 to 34 million BOE (4.6
Mtoe) in 2030. The decline is due to the limited supply of biomass resulting from
substitution to the easier accessible energy source, such as coal.
However, the Security Scenarios 2010-2030 [8], actually expects that biomass
supply slightly increases from 41 million BOE (5.5 Mtoe) in 2010 to 51.5 million
BOE (7.0 Mtoe) in 2030 at an average rate of 1.2% per year. The share of biomass in
the primary energy mix is only 1.3% in 2030. This value is far small as compared
with the target value of 5% by the Presidential Decree as shown in Fig. 1.6. The
increase in biomass consumption can be expected associated with incentives to use
energy with low-emission of carbon dioxide, or carbon neutral property to moderate
climate change and prevent further global warming.
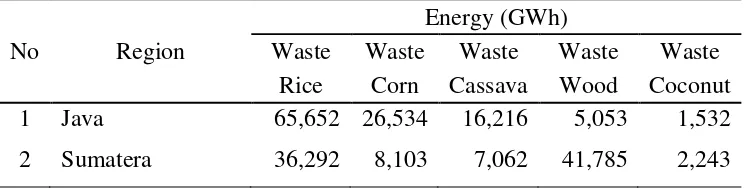
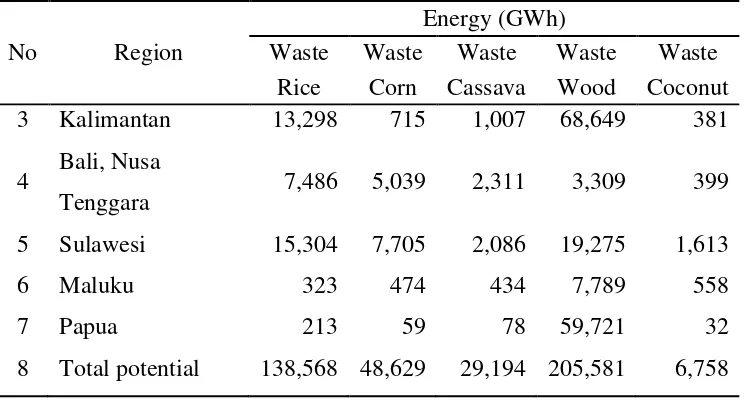
As mentioned earlier, Indonesia has the huge potential of biomass energy and
the government should promote technology development to produce high quality of
biomass energy, cheaply, effectively and efficiently. Table 1.2. shows that each
region of Indonesia has a large biomass energy sources. In general, organic wastes are
not fully utilized yet, as described earlier.
Table 1. 2. Energy Potential of Biomass by Region in Indonesia
Table 1.2. Energy Potential of Biomass by Region in Indonesia (Continued)
Based on the background of the above issues, then how can we use high
potential biomass for energy, especially wood waste? There are several ways of
energy conversion of wood waste. These are as follows:
1. Direct burning for heat
2. Liquids fuel production
3. Gasification of biomass
Direct burning of wood has been used as the easiest way of energy conversion
since ancient era. Technology to produce liquid fuel and gas fuel from wood is
positively developed in the recent few decades. The main technology is pyrolysis. In
1.2. Limitation of Problem
Based on the description of the background above is obtained a description of
the issues dimention are quite broad. However, the author aware of the limitations of
time and ability, therefore the author considers necessary to provide clear boundaries
and focus issues. The next issues are the object of study is only limited in the
conversion of biomass using the pyrolysis paths.
Pyrolysis is the thermal decomposition of fuel into liquids, gases, and char
(solid residue) in the absence of oxygen. Pyrolysis is a technology that has long been
developed, but the process of pyrolysis phenomenon has not been widely known.
Therefore, the discussion of the pyrolysis phenomenon in the reactor chamber is the
main research, this study, because pyrolysis phenomena take place inside the
chamber. To describe the pyrolysis phenomenon, the numerical approach with the
ANSYS software is used.
1.3. Research Objective
This work aims to obtain information about the phenomena accompanying
wood pyrolysis in the pre-vacuum chamber and a key to improving the pyrolysis
performance. Therefore, several issues should be examined through this numerical
analysis:
a. Temperature distribution and pressure inside chamber, especially
temperature of wood pieces.
c. Gas Content number of wood volatile.
![Figure 1. 2. Energy consumption per capita (1990, 2000, 2010 and 2030) [5].](https://thumb-ap.123doks.com/thumbv2/123dok/1877488.1170126/5.612.152.482.111.299/figure-energy-consumption-per-capita-and.webp)
![Figure 1. 3. World Oil Production [5].](https://thumb-ap.123doks.com/thumbv2/123dok/1877488.1170126/6.612.108.526.299.507/figure-world-oil-production.webp)
![Figure 1.4. The Energy Consumption in 2000 - 2010 by Type [6]](https://thumb-ap.123doks.com/thumbv2/123dok/1877488.1170126/8.612.152.493.114.339/figure-energy-consumption-type.webp)
![Figure 1. 5.Projection of total final energy demand by energy sector [6]](https://thumb-ap.123doks.com/thumbv2/123dok/1877488.1170126/9.612.146.493.117.319/figure-projection-total-final-energy-demand-energy-sector.webp)
![Figure 1.6. Current Energy Mix versus Future Energy Goals [7].](https://thumb-ap.123doks.com/thumbv2/123dok/1877488.1170126/10.612.124.519.136.293/figure-current-energy-mix-versus-future-energy-goals.webp)
![Table 1. 1. Renewable Energy Potential in Indonesia [7].](https://thumb-ap.123doks.com/thumbv2/123dok/1877488.1170126/12.612.123.519.361.531/table-renewable-energy-potential-indonesia.webp)