The Measurements of Calcification Rates in Reef
Corals Using Radioisotope
45
Ca at Pongok Sea,
South Bangka
G. Diansyah1*, T.Z. Ulqodry1, M. Rasyid1 and A. Djawanas2
1Program Study of Marine Science, Faculty of Natural Science, Sriwijaya University, Palembang, Indonesia 2Center for the Application of Isotopes and Radiation Technology, National Atomic Energy Agency
Jl. Lebak Bulus Raya No. 49, Jakarta 12440, Indonesia
A R T I C L E I N F O A B S T R A C T
Article history:
Received 08 December 2009
Received in Revised form 05 April 2011 Accepted 05 April 2011
Keywords:
Calcification rates Reef coral
45Ca
Pongok sea
Coral reef ecosystem is one of the most important ecological systems in the Indonesian coastal zone. The aim of this study which was undertaken between August - October 2006, is to measure the calcification of corals in a reef coral in the Pongok Sea, South Bangka using 45Ca. The steps in conducting this study were surveying of the site, preparation, transplanting, incubation in the 45Ca - solution, and analysis of the coral fragments. The results showed that at the depth of 5 m different counts per minute (cpm) trend occurred. For the samples taken from the transplantation of the Artificial Colony (Ac) the cpm showed that with the progress of time the cpm declined, reaching its lowest cpm at 5 hours after retransplanting of the coral fragments. On the other hand the samples obtained from the natural (Nc) colony showed that the cpm increased with time progress. At the 10 m depth where only the coral fragment of the natural colony (Nc) was observed a different pattern showed up. Here with the progress of time up to 3 hours the cpm increased and after that it declined to reach a low cpm at 5 hours of observation. The cpm values were then transformed to disintegrations per minute (dpm), µCi and at the end to
45Ca content. The same trend is shown for dpm, µCi/0.5 g sample and µg Ca/0.5 g
sample. The 45Ca content (µg/0.5g sample) were used to show the calcification
rates of coral fragments. It showed clearly that 45Ca could be used to calculate the magnitude of calcification.
© 2011 Atom Indonesia. All rights reserved
INTRODUCTION∗∗∗∗
Coral reef ecosystem is one of the most important ecological systems in the Indonesian coastal zone. Indonesian’s coral reef is the most extensive in the Southeast Asia region. The area of reef corals in Indonesia is around 50,000 km2 found on 841 sites, consist of 5.23% in very good condition, 24.26% on good condition, 37.34% at condition between good and worse and 33.17% at worse condition [1]. Eighty-two percent of this large area is in danger to be demolished by bombing and the use of potassium for reef fish catching and to take the corals for high sale prices. The rehabilitation of the reef corals will take time but is urgently needed to be done. The building up and the rehabilitation of the coral reef could be carried out using several methods, such as, building artificial reef [2]; reef transplantation [2,3]; use of electric stimulation to enhance reef growth [4].
∗
Corresponding author.
E-mail address: [email protected]
Another method was developed which is the measurement of calcification rates of corals in reef corals colony. The calcification rate is a complex and dynamic process which is completely controlled by outside factors. The main factors are environment temperature and light. To be able to measure the calcification rate more accurately is using of 45Ca. The use of 45Ca is to determined the calcification rate in quantity in matter of hours. The
45
Ca is used to measure calcification rates with the progress of time. The calcification process which is measured by its calcification rates is an assumption that there is growth in the coral reefs. This study was done to measure the calcification rates of corals in a reef coral in the Pongok Sea South Bangka using 45Ca.
MATERIALS AND METHOD
Site and time of the experiment
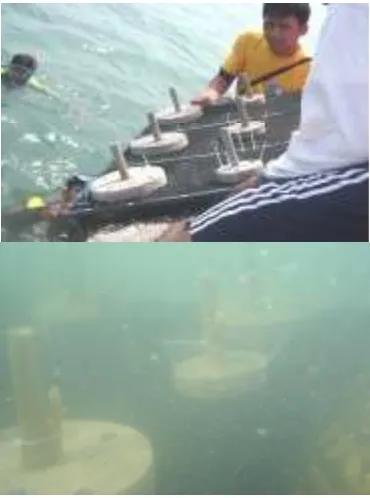
The study was carried out at coral reef ecosystem of Pongok Sea South Bangka, from August to October 2006. The coordinate of the site at sea is 20 49’ 48” S and 1070 02’ 24” E as shown in Fig. 1. Figure 1 and 2 are the sites of the area where the coral fragments were taken from and the boat where the coral fragments were incubated in the 45Ca- solution.
Fig. 1. The study site at Coral Reef Area of Pongok Sea, South Bangka.
The steps in conducting this experiment were done by starting with, survey of the site, preparation of the coral fragments, incubation of the coral fragments in the 45Ca-solution and ended by analyzing of the coral fragments.
Fig. 2. Preparation and transplantation of the coral fragment.
Equipment used in the experiment
The main equipments used in this study is for incubation of the coral fragment in 45Ca solution were fluorescent lamps, lux meter, glass vials, aluminium foil, hand refractometer, counting vial, balances, gamma spectrometer, hot plate, sieve (2 mm diameter size), aerator, aquapro filter 5 µm,
stopwatch and incubator.
The materials used were radioisotope 45CaCl2
130 µCi/10ml, Aquadest (pH 7), and coral fragment.
Coral fragments preparation
Prior to the incubation treatment the coral colony was transplanted on steel trays at sites which have been determined previously. The growth of the corals was observed visually two months before incubation with 45Ca took place. This was done to check whether the transplanted coral colony was still alive. The trays were put at a 5 and 10 m depth in the sea water. After cutting the coral fragments, they were put in glass vial with fresh sea water and then treated for 45Ca incubation.
Coral fragments incubation in 45Ca solution
The coral fragments collected were dissolved in fresh sea water for one hour prior to 45Ca
incubation. Thereafter, 45CaCl2 at a rate of
in the radioactive solution was done for 8 hours. The fluorecent lamp was put at a 1 m height above the incubation container. An aerometer was put into the incubation container to supply oxygen (O2)
countinously during the whole incubation process. The incubation process was done following the method of van der Meulen and Muscatine [5] with same alteration.
Transplantation of the coral fragments
After the 8-hour incubation period in the 45Ca solution, the coral fragments were transplanted to their original colony site. The coral sites were at a 5 and 10 m depth. At the 5 m depth, the colony consisted of an artificial (using trays) and natural site. On the other hand at the 10 m depth only a natural colony was maintained. The coral fragments were left for 1, 3, and 5 hours after transplanting, at the site where they were taken from, before the harvest was carried out.
Harvesting of the coral fragments
As mentioned before the coral fragments which have been incubated in 45Ca before transplanted at the original coral colony were harvested at 1, 3 and 5 hours after transplanting. Thereafter, the samples of the coral fragments were brought to the isotope lab of PATIR (The Center of Radioisotepe and Radiation Technology), BATAN, Jakarta. Here the coral fragments samples, were analysis for their 45Ca content. The calcification rates are based on the 45Ca content in the coral fragments. Low or high 45Ca content is used as an indication of the low or high calcification rates.
Analysis for 45Ca content
In the lab, the coral fragments were dried using an oven until they reach a constant dry weight. After drying the coral fragment were grinded to pass 2 mm sieve. A 0.5 g of coral fragments samples were taken and ashed in a furnace at 650oC for 12 hours. The coral samples were dissolved in 17 ml concentrated HCl and heated using a hot plate at 100oC till the solution becomes clear. A one ml solution was taken and put into counting vials and 14 ml water was added to each counting vials. The counting vials were then counted for the 45Ca content of each sample. For counting a liquid scintillation counter was used. The counting vial consisting liquids of back ground, samples, and standard were put into the sample holder of the Liquid Scintilation Counter and was operated automatically, resulting in the cpm numbers of the
background, samples and standards. The analysis of
45
Ca from the counting vials was stated in cpm (counts per minute). The cpm values were transformed to dpm (disintegrations per minute), by dividing the number of cpm by the efficiency factor of the liquid scintillation counter which in this case was 0.5 and thereafter to µCi/0.5 g samples and at last to µg Ca/0.5 g samples. Each sample is counted in duplo to get an average of the cpm.
RESULTS AND DISCUSSION
Results
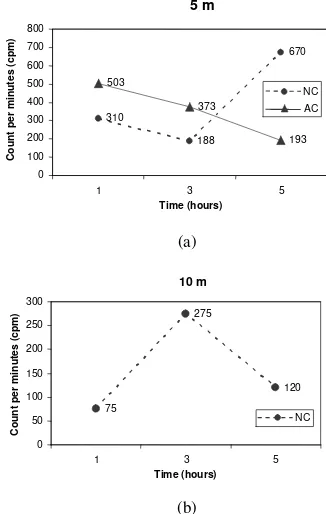
The results of this experiment are presented in Figs. 3,4,5 and 6. The counts per minute (cpm) of the coral fragment sample as one of the main parameter for calcification is the base for the other parameters. Fig. 3a and 3b showe the cpm of the coral samples.
Figure 3a showe that at the depth of 5 m different cpm trend occurred. For the samples taken from the transplantation of the Artificial Colony (Ac) the cpm showed that with the progress of time the cpm declined, reaching it lowest cpm at 5 hours after retransplanting of the coral fragments. On the other hand the samples obtained from the natural (Nc) colony showed that the cpm increased with time progress.
(a)
(b)
(a)
(b)
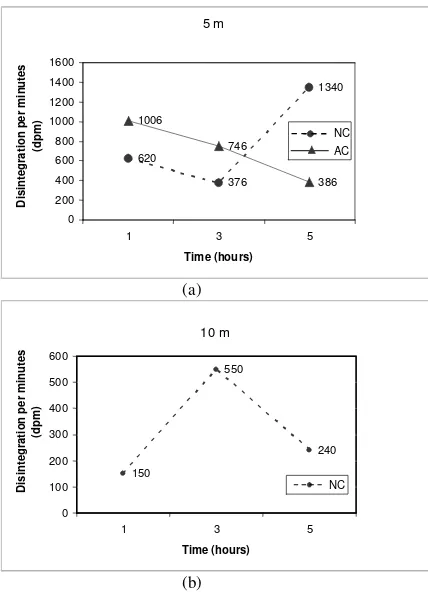
Fig. 4. Desintegration per minutes (dpm) of the coral fragments at Natural (Nc) and Artificial Environment (Ac) different depth (5 & 10 cm).
At the 10 m depth where only the coral fragment of the natural colony (Nc) was observed a different pattern showed up. Here with the progress of time up to 3 hours the cpm increased and after that in declined to reach a low cpm at 5 hours of observation. The cpm values of the coral samples were then transformed to dpm values, from there to µCi/0.5 g values, end ended with the content of 45Ca (µg/0.5 g).
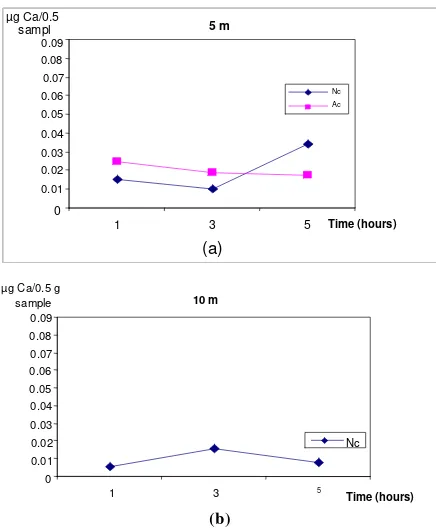
The 45Ca values were used as an indicator of the calcification rates. In the discussion 45Ca content is used and as an indicator for the calcification rates. The same trend is shown for dpm, µCi/0.5 g sample and µg Ca/0.5 g sample. These figures showed clearly that 45Ca could be used to calculate the magnitude of calcification.
Discussion
Theoretically, the content of calcium carbonate deposition increased with time and is irreversible as long as the coral colony is alive. According to Goreau [6], there is a positive correlation between photosynthesis and calcification. This is based on the statement by Goreau and Goreau [7] that the role of zooxantellae which play an important role in the process of
calcification. They do the photosynthesis for the corals and this activity play the main role to make the corals able to carry out the calcification process.
At the 5 m depth apparently the process of photosynthesis was inhibited. This inhibition could be due to the growth disturbance of the corals when taken for 45Ca incubation and after transplanted at their original site. It could be that the disturbances include the disturbance of the zooxantellae growth and this further disturbed the photosynthesis activity resulting in decreasing calcification rates for the artificial corals colony as shown by Figs. 3a, 4a, 5a and resulting in low 45Ca content (Fig. 6a). The opposite was shown for the natural corals at the same depth. As shown in Figs. 3a, 4a, 5a, 6a for the natural colony the increase in cpm, dpm,
µg/0.5 g and ended with 45Ca content as an indication of the calcification rates, which increased with the time progress. It might be that the coral fragments obtained from the natural colony could resiststress which was experienced by the artificial corals. This was shown by the increase calcification rates where apparently inhibition to their photosynthesis activity did not occur (Fig. 6a). For the 10 m depth, a different observation was obtained (Figs. 3, 4, 5, 6b). Here, it is shown that first there was an increase in calcification rate at the 3-hour observation and then declined at the 5-hour observation. The increase and decrease of the calcification rates did not differ from hour to hour similar as found by Idris [8]. In a way, that as found by Idris [8] similar trend of calcification rates was found in this study. He forwarded that the low calcification increase at a 10 m depth is mostly due to the coral morphology and not to the stress which could also occur in a 10 m depth.
(b)
Fig. 5. µCi of the coral fragments at Natural (Nc) and Artificial Environment (Ac) at different depth (5 and 10 m).
(b)
Fig. 6. µ g Ca of the coral fragments at Natural (Nc) and Artificial Environment (Ac) at different depth (5 and 10 m).
In general it could be forwarded that in this study the 45Ca method was able to determine the calcification rates quantitatively.
CONCLUSIONS
The 45Ca method has proved that it could be used satisfactorily to measure the calcification rates of the coral fragments under study. This method also showed that different calcification rates occur between coral fragments taken from artificial and natural coral colony at a 5 m depth. The natural
colony at the 10 m depth which contributed the coral fragment, to be used for calculating calcification rates showed different rates compared to that of the 5 m depth.
Some suggestion to further carry out this work is to have more different location and longer time (>5 hours) of observation and to determine the photosynthesis rates occurring in the reef corals.
ACKNOWLEDGEMENTS
The authors wish to thank Mr. Havid Rasjid and Prof. Ir., Elsje L. Sisworo, MS for their involvement in the field and laboratory assay, and especially to the latter for editing this paper. The efforts of PATIR - National Nuclear Energy Agency (BATAN), as a counterpart who provide the radioisotope material, and do the analysis is recognized. We also would like to thank DP2M DIKTI for funding this study.
REFERENCES
1. Suharsono, Jenis-Jenis Karang yang Umum Dijumpai di Perairan Indonesia, Proyek Penelitian dan Pengembangan Daerah Pantai, Pusat Penelitian dan Pengembangan Oseanologi, Lembaga Ilmu Pengetahuan Indonesia (2006).
2. S. Clarck and A.J. Edward, Coral Transplantation as an Aid to Reef Rehabilition Evaluation of a Case Study in the Malolive Islands, Univ. of Newcastle, Newcastle (1995).
3. A. Birkeland, R.H. Randall and G. Grimm,
Three Methods of Coral Transplantation for Purposes of Re-Establishing a Coral Community in Thermal Effluent Area of the
Tangguisson Power Plant, Tech. Rep. 60,
Univ. of Guam, Marine Lab., Guam (1979) 124.
4. W. Hilbertz, D. Fletcher and D. Krausse, Mineral Aeratium Technology Application Architecture and Aquaculture, Industrial Forum 8 (1977) 75.
5. J.H. Van Der Meulen and L. Muscatine,
Influence of Symbiotic Algae on Calsification
in Reef Corals: Critic and Progress Report, in:
Symbiosis in the Sea, W.B. Vernberg (Ed.), Univ. of South Carolina Press, USA (1974) 1.
7. T.F. Goreau, The Physiology of Skeleton Formation in Corals: A Method for Measuring the Rate of Calcium Deposition by Corals under Different Conditions, Biol. Bull. 116
(1959) 59.
8. Idris, Pendugaan Laju Kalsifikasi Karang Dengan Menggunakan Radioisotop 45CaCl2