Unmet Need and Problems Accessing Core Health Care Services
for Children with Autism Spectrum Disorder
Giuseppina Chiri•Marji Erickson Warfield
Published online: 11 June 2011
ÓSpringer Science+Business Media, LLC 2011
Abstract To investigate the health care experiences of children with autism spectrum disorder, whether they have unmet needs, and if so, what types, and problems they encounter accessing needed care. We address these issues by identifying four core health care services and access problems related to provider and system characteristics. Using data from the 2005–2006 National Survey of Chil-dren with Special Health Care Needs (NS-CSHCN) we compared children with autism spectrum disorder with children with special health care needs with other emo-tional, developmental or behavioral problems (excluding autism spectrum disorder) and with other children with special health care needs. We used weighted logistic regression to examine differences in parent reports of unmet needs for the three different health condition groups. Overall unmet need for each service type among CSHCN ranged from 2.5% for routine preventive care to 15% for mental health services. After controlling for predisposing, enabling and need factors, some differences across health condition groups remained. Families of children with aut-ism spectrum disorder were in fact significantly more at risk for having unmet specialty and therapy care needs. Additionally, families of children with autism spectrum disorder were more likely to report provider lack of skills to treat the child as a barrier in obtaining therapy and
mental health services. Disparities in unmet needs for children with autism suggest that organizational features of managed care programs and provider characteristics pose barriers to accessing care.
Keywords Autism spectrum disorderUnmet needs
Access to careAccess problems
Introduction
The Centers for Disease Control and Prevention (CDC) has found that more children than ever before are being clas-sified as having autism spectrum disorders (ASDs). Research conducted by the CDC found that for the 2006 surveillance year, approximately 9 per 1,000 (or one in every 110 children) was classified as having an ASD and that the average prevalence of ASDs identified among children aged 8 years increased 57% in 10 sites from the 2002 to the 2006 surveillance year [1].
This is a dramatic increase from the 1990s when autism was believed to occur in 2.0–7.0 per 1,000 children and from the 1980s when the rate was 0.1–0.4 per 1,000 chil-dren [2]. Assuming that the prevalence rate has remained stable over the past two decades and that approximately 4 million children are born in the United States every year, the CDC estimates that potentially up to 730,000 individ-uals between the ages of 0–21 have an ASD [3]. Although it is still not clear whether the increase is due to a change in how the disorders are identified or to a true increase in prevalence, ASDs have now become the second most common developmental disability after mental retardation among children [4].
These data on the prevalence of autism will be reflected in a concomitant increase in the demand for health care and G. Chiri (&)
Lurie Institute for Disability Policy, Heller School for Social Policy and Management, Brandeis University, MS 035, 415 South Street, Waltham, MA 02453, USA
e-mail: [email protected]
M. E. Warfield
The Nathan and Toby Starr Center, Heller School for Social Policy and Management, Brandeis University, Waltham, MA, USA
health related services. Therefore, understanding the nature of health care needs and the experiences this population has in seeking health care and related services, is of paramount importance.
Using the 2007 National Survey of Children’s Health, Newacheck and colleagues found that about 4% of US children have unmet medical care needs [5].
A higher occurrence of unmet health care needs among children with special health care needs (CSHCN) has been identified in various studies. Focusing on this subpopula-tion, Newacheck and colleagues found that about 12% had at least one unmet health care need when it came to medical care, dental care, mental health care and pre-scriptions, and/or eyeglasses over a period of a year [6]. Davidoff [7] reported a similar percentage; almost 14% of the CSHCN in the 2000–2001 National Health Interview Survey had at least one unmet need for one of five selected health care services (general medical care, prescription drugs, dental care, mental health services, and vision ser-vices). Finally, Warfield and Gulley [8] reported that as the number of needed services increased, so did the number of reports of unmet needs. For instance, among CSHCN needing only one to two services, 7% of parents claimed at least one unmet need, while among children needing three to four services an average of 16% of parents reported at least one unmet need. This percentage increased to 25 among children needing five or all six selected services.
The percentage of unmet health care needs has been found to be even higher among children with autism. A study by Kogan and colleagues [9] utilized the 2005–2006 National Survey of Children With Special Health Care Needs to compare the health care experiences of CSHCN reported by their parents to have ASD with that of CSHCN without ASD. The analyses revealed that CSHCN who also had ASD were appreciably more likely than CSHCN without a reported ASD to have at least one unmet need for health care services: 30% of parents of children with ASD reported at least one unmet health care need, versus 12% of parents of CSHCN without ASD. These differences remained even after statistically controlling for sociode-mographic factors, the child’s functional abilities and health insurance coverage. The ASD group was further compared with a group of children with other emotional, developmental, or behavioral problems (EDB) who did not have ASD. Relative to children with other EDB problems who did not have ASD, parents of children with ASD were more likely to report at least one unmet health care need (31% vs. 25%, respectively) [9].
Children with ASD have also been reported to have significantly greater utilization of health services in terms of annual outpatient visits (41.5 vs. 3.3), annual physician visits (8.0 vs. 2.2), and number of medications prescribed annually (21.8 vs. 2.1) compared to children in general
[10]. When comparing health care utilization of children with and without ASD in the same health plan, Croen et al. [11] found that children with ASD had a substantially higher annual mean number of total clinic (5.6 vs. 2.8), pediatric (2.3 vs. 1.6), and psychiatric outpatient visits (2.2 vs. 0.3) compared to those without ASD. Two other stud-ies, one conducted using the 2003–2004 National Survey of Children’s Health [12] and the other using North Dakota Medicaid claims from 1998 through 2004 [13], echo these findings. Research has also found that children with ASD can experience greater difficulties accessing needed ser-vices. A study conducted by Krauss and colleagues [14] found that over one-third of the children with autism reported experiencing problems accessing specialty care, compared to just one-fifth of children with mental retar-dation, and one-fifth of children with other types of special health care needs.
While informative, the literature on the health care experiences of children with autism is still scanty, and provides only a partial picture of the health care experi-ences of these children. Although important characteristics and trends in unmet health care needs, health care utiliza-tion and health care access have been identified, the spe-cific health care services families of children with ASD lack, and the reasons for having those unmet needs, are unclear. Recommendations for programmatic and policy improvements could benefit from this information.
This paper looks specifically at this gap in the literature, focusing on the unmet health care needs of children with ASD, as it is widely accepted that unmet need for health care represents a critical marker of access to health care [8, 15]. While access to health care is the ‘‘foundation and hallmark of a high performance health system,’’ [16] having access to health care (having health insurance or a medical home or a primary care physician) does not guarantee that all existing health problems are appropri-ately addressed [6, 8, 17]. Thus, access to health care services must be investigated further by identifying the kinds of problems families face in their efforts to obtain various services from different providers [8].
groups. Finally, it will examine which individual factors, if any, are associated with unmet needs.
We employ the Behavioral Model of Health Services Use as a framework to understand patterns in unmet health care needs. This model postulates that health care utiliza-tion is a funcutiliza-tion of three sets of variables: predisposing, enabling and need [18]. In our models, predisposing vari-ables include demographic factors such as age, gender, language spoken at home, race and ethnicity, and marital status; enabling factors include family income, insurance coverage status and region of residence. Region of resi-dence was chosen as a proxy for provider supply, a com-munity enabling factor according to Andersen’s model. The third component in Andersen’s model is need, which in this case was captured by the respondent’s perception of the child’s functional ability status. To these measures we have added a variable indicating whether the child has ASD, EDB or other CSHCN in order to assess if group differences remain even after controlling for other factors.
Methods
Data used for this analysis came from the 2005–2006 National Survey of Children with Special Health Care Needs (NS-CSHCN). The survey is sponsored by the Maternal and Child Health Bureau (MCHB) and allows the estimation of the prevalence of CSHCN at the state and national level, as well as providing detailed information on the ‘‘demographic characteristics of these children, the types of health and support services they and their families need, and their access to and satisfaction with the care they receive’’ [19].
Although the MCHB definition of CSHCN includes children who are at risk, the NS-CSHCN survey only included children with existing special health care needs [20]. The final sample of 40,723 was achieved by screening 363,183 children representing 191,640 households nation-wide. In the end approximately 750 CSHCN from each state and the District of Columbia were included in the sample.
The respondents were parents or guardians who were well informed about their child’s health and health care. Children were classified as having special health care needs using the CSHCN Screener, a tool which identifies children who experience one or more of five health needs (e.g., need for special therapies or prescription medications) that could be the consequence of a physical, mental, behavioral or other type of health condition that has lasted or is expected to last at least 12 months. If more than one child in the household were identified as having special health care needs, one was randomly selected to be the subject of a detailed interview [22].
The survey identified children as having an autism spectrum disorder if the respondent answered affirmatively to the question ‘‘To the best of your knowledge, does your child currently have autism or autism spectrum disorder, that is, ASD?’’
CSHCN were classified as having chronic emotional, developmental, or behavioral problems if the respondent answered affirmatively to two questions from the CSHCN Screener: ‘‘Does your child have any kind of emotional, developmental, or behavioral problem for which he/she needs treatment or counseling?’’ and ‘‘Has your child’s emotional, developmental, or behavioral problem lasted or is it expected to last 12 months or longer?’’
We restricted our sample to children ages 3 and older, because research has shown that although possible, early diagnosis of autism is laden with problems, whereas an accurate diagnosis can be made when the child is 3 or older [21]. This led to a final sample size of 38,373 children.
The total number of children ages 3–17 years reported to have ASD is 2,088. This corresponds to approximately 535,000 children nationally with both SHCN and ASD. The total number of children ages 3–17 years reported to have EDB but not ASD is 9,534 (about 2,333,235 nation-ally). A total of 26,751 children ages 3–17 years had spe-cial health care needs other than ASD or EDB (close to 6,671,714 nationally).
Measures
Unmet Health Care Needs
Of the 15 health care services the NS-CSHCN inquires about, we selected four core health care services for anal-ysis: routine preventive care, specialist care, physical, occupational or speech therapy and mental health care or counseling. The unmet need for these selected medical services was assessed by using survey items asking whe-ther a particular service that the respondent deemed nec-essary was received in the previous year. Those who needed a service but did not receive it were considered to have an unmet need.
Access Problems
survey items underscored problems associated with health plan policies including getting referrals for services, gen-eral health plan problems and finding a doctor who accepts the insurance plan. Other survey items referenced provider-based issues such as lack of skilled providers, shortage of providers that can be easily accessed, difficulties getting appointments, and dissatisfaction with the provider.
In Tables3 and4, we report the percentage in each of the three groups who experienced each of the ten specific problems.
Data Analysis
The NS-CSHCN data were obtained using a complex sample design that included clustering of children within households and stratification of households within states. To produce estimates that are representative of children nationally and within each state sampling weights were used. These sampling weights account for the unequal probability of selection of each household and child, and they include adjustments for multiple-telephone house-holds, unit nonresponse, and noncoverage of nontelephone households, as well as adjustments to known population
control estimates [22]. STATA [23] statistical software was used to obtain accurate variance estimates in all the anal-yses we performed.
Results
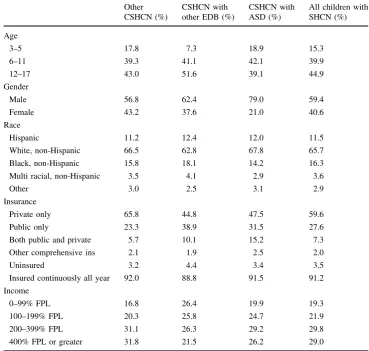
Selected characteristics of the study population are described in Table 1 for each of the health condition groups and for the overall sample.
Although boys represent the majority of all CSHCN (almost 60%), they are over represented in the ASD cate-gory (79%). While the majority of CSHCN were white non-Hispanic (65.7%), 11.5% were Hispanic, and 16.3% black non-Hispanic. The racial distribution is similar across the three health condition groups.
Just under 60% of respondents reported that their child had private health insurance only and almost 30% reported having public insurance only. A small fraction reported having both public and private insurance (7.3%), other comprehensive insurance (2%), or being uninsured at the time of survey (3.5%). Children with ASD are more likely than the other two groups to have both public and private
Table 1 Selected child characteristics and insurance coverage status by health condition group
Other CSHCN (%)
CSHCN with other EDB (%)
CSHCN with ASD (%)
All children with SHCN (%)
Age
3–5 17.8 7.3 18.9 15.3
6–11 39.3 41.1 42.1 39.9
12–17 43.0 51.6 39.1 44.9
Gender
Male 56.8 62.4 79.0 59.4
Female 43.2 37.6 21.0 40.6
Race
Hispanic 11.2 12.4 12.0 11.5
White, non-Hispanic 66.5 62.8 67.8 65.7
Black, non-Hispanic 15.8 18.1 14.2 16.3
Multi racial, non-Hispanic 3.5 4.1 2.9 3.6
Other 3.0 2.5 3.1 2.9
Insurance
Private only 65.8 44.8 47.5 59.6
Public only 23.3 38.9 31.5 27.6
Both public and private 5.7 10.1 15.2 7.3
Other comprehensive ins 2.1 1.9 2.5 2.0
Uninsured 3.2 4.4 3.4 3.5
Insured continuously all year 92.0 88.8 91.5 91.2
Income
0–99% FPL 16.8 26.4 19.9 19.3
100–199% FPL 20.3 25.8 24.7 21.9
200–399% FPL 31.1 26.3 29.2 29.8
insurance (15.2%), however compared to other CSHCN they are less likely to carry private insurance only (47.5% vs. 65.8%) but more likely to have public insurance only (31.5% vs. 23.3%).
In order to address our research questions, we conducted bivariate and logistic regression analyses. First, the per-centage of respondents reporting unmet health care needs was calculated for each of the four core health care services and for each of the three health condition groups. Second, the percentage of respondents reporting access problems was computed for each group. Bivariate analyses provide group-specific prevalence rates and explore unadjusted associations of the four core health care services and for each of the three health condition groups. Lastly, four separate logistic regression models were analyzed to identify differential predictors of the probability of expe-riencing each of the four unmet health care needs. All estimates are weighted to reflect population characteristics and to be nationally representative.
Research Question #1 How does parent report of unmet need vary by service type and health condition group (other CSHCN vs. EDB vs. ASD)?
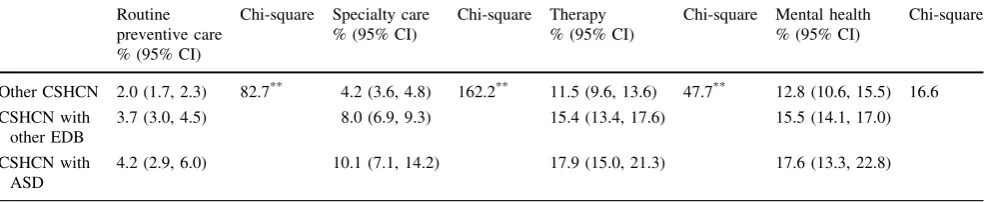
Overall unmet need for each service type was relatively low among CSHCN, ranging from 2.5% for routine pre-ventive care to 15% for mental health services. Despite this, significant differences in reports of unmet needs are found by health condition group for three of the four selected core health care services (Table2). Parents of children with ASD were more likely to report an unmet need than parents of children with other SHCN except for mental health where they reported similar levels of unmet needs. Parents of children with EDB were also always more likely than parents of children with other SHCN to report unmet needs on all the measures except for mental health. Parents of children with EDB and ASD reported similar levels of unmet health care needs on all the core health care services.
Research Question #2 How does parent report of specific access problems vary by service type and health condition group (other CSHCN vs. EDB vs. ASD)?
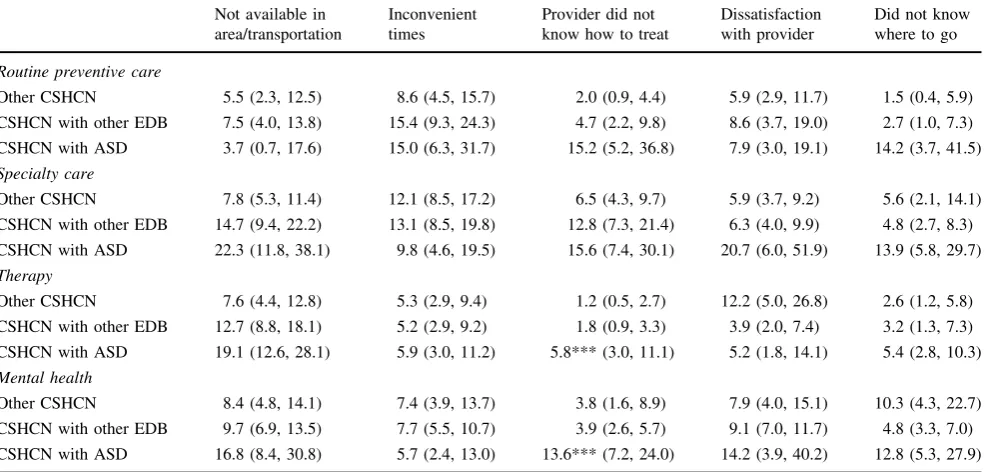
Tables3 and 4 show specific access problems parents encountered as they tried to obtain care for their children. Given the large number of comparisons performed, we have adjusted the statistical significance to P\0.001 in
order to reduce Type I errors [24]. As the table shows, there were only a few statistically significant differences among the groups with respect to experiencing problems accessing care. Families of children with ASD were more likely to report provider inability to treat the child as a barrier in obtaining therapy and mental health services (5.8 and 13.6%, respectively). Children with ASD also experienced greater impediments than the other health condition groups in getting routine preventive care due to having difficulties obtaining referrals (7.0%).
Research Question #3 How do predisposing characteris-tics, enabling resources and need predict the likelihood of experiencing an unmet need? After controlling for these factors, do differences across the three health condition groups still exist?
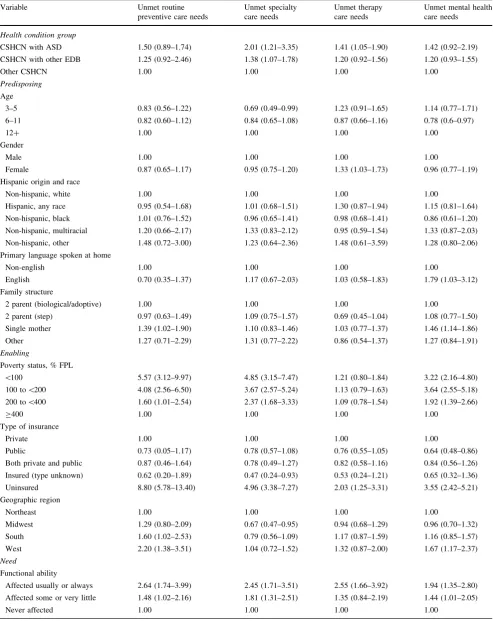
Four separate logistic regression models, one for each of the potential unmet need, were analyzed to address this question (Table5). The dependent variables were coded one if the respondent reported not having received the needed service, and zero if the respondent reported having received the needed service.
The logistic regression models revealed an important set of findings. First, the predisposing factors of age, gender, and race were not significant predictors of experiencing unmet needs in any category. Being a single mother pre-dicted more unmet routine preventive and mental health care needs. English as a primary language in the home also predicted more unmet mental health care needs.
Second, each enabling factor was a significant predictor of different types of unmet need. Poverty and being
Table 2 Differences in reports of unmet needs for services by health condition group Routine
preventive care % (95% CI)
Chi-square Specialty care % (95% CI)
Chi-square Therapy % (95% CI)
Chi-square Mental health % (95% CI)
Chi-square
Other CSHCN 2.0 (1.7, 2.3) 82.7** 4.2 (3.6, 4.8) 162.2** 11.5 (9.6, 13.6) 47.7** 12.8 (10.6, 15.5) 16.6
CSHCN with other EDB
3.7 (3.0, 4.5) 8.0 (6.9, 9.3) 15.4 (13.4, 17.6) 15.5 (14.1, 17.0)
CSHCN with ASD
4.2 (2.9, 6.0) 10.1 (7.1, 14.2) 17.9 (15.0, 21.3) 17.6 (13.3, 22.8)
Chi-square test of the null hypothesis of no group differences
uninsured, two markers of social vulnerability, are signif-icantly associated with the likelihood of having an unmet need on several of the selected core health care services. Type of insurance is by and large not crucial in determining whether or not a child will lack health care, with the exception of public health insurance which lowered the risk
of having unmet mental health care needs. South and West geographic regions are positively associated with increased likelihood of having unmet routine care needs and mental health needs (for the South region only). This is a potential indication that health system resources are not evenly distributed throughout the country.
Table 3 Prevalence of health plan-based access problems by service and health condition group (% and 95% CI)
Cost too much No insurance Health plan problem No referral Provider does not accept insurance
Routine preventive care
Other CSHCN 31.7 (24.2, 40.2) 38.3 (30.1, 47.3) 12.6 (8.5, 18.4) 0.2 (0.0, 1.3) 2.4 (1.0, 5.4)
CSHCN with other EDB 30.9 (22.4, 40.9) 26.9 (18.6, 37.2) 19.1 (10.5, 32.3) 0.1 (0.0, 0.5) 4.2 (1.5, 10.8)
CSHCN with ASD 28.4 (14.9, 47.2) 10.4 (4.3, 23.1) 13.4 (6.2, 27.1) 7.0*** (2.3, 19.2) 5.5 (1.5, 17.9)
Specialty care
Other CSHCN 22.4 (16.5, 29.6) 17.0 (12.3, 22.9) 20.1 (14.3, 27.5) 4.0 (2.0, 7.8) 4.1 (2.4, 7.0)
CSHCN with other EDB 22.0 (16.4, 28.7) 16.1 (11.0, 22.9) 14.3 (9.9, 20.3) 2.5 (1.2, 5.1) 8.0 (4.9, 12.9)
CSHCN with ASD 31.0 (17.7, 48.3) 10.4 (4.8, 21.3) 19.6 (10.0, 34.8) 6.8 (1.9, 21.4) 17.0 (6.8, 36.2)
Therapy
Other CSHCN 11.1 (7.1, 17.0) 9.4 (5.4, 15.7) 28.8 (19.3, 40.6) 2.0 (0.8, 4.7) 1.5 (0.7, 3.4)
CSHCN with other EDB 20.5 (15.2, 27.1) 6.0 (3.7, 9.8) 18.6 (13.1, 25.8) 2.6 (0.9, 7.2) 4.9 (2.2, 10.5)
CSHCN with ASD 17.3 (11.7, 24.7) 6.0 (2.8, 12.4) 16.0 (10.9, 22.8) 1.2 (0.5, 3.2) 6.7 (3.3, 12.9)
Mental health
Other CSHCN 28.8 (20.4, 39.0) 14.1 (8.2, 23.2) 10.0 (5.4, 17.6) 0.8 (0.3, 2.1) 7.4 (3.5, 15.3)
CSHCN with other EDB 20.8 (16.4, 25.9) 13.4 (9.9, 18.1) 15.2 (11.2, 20.2) 1.3 (0.7, 2.5) 6.0 (4.2, 8.5)
CSHCN with ASD 18.0 (10.7, 28.6) 6.7 (3.3, 13.1) 11.5 (6.1, 20.8) 4.1 (1.1, 14.6) 16.6 (7.8, 31.9)
Chi-square test of the null hypothesis of no group differences
***P\0.001
Table 4 Prevalence of provider-based access problems by service and health condition group (% and 95% CI) Not available in
area/transportation
Inconvenient times
Provider did not know how to treat
Dissatisfaction with provider
Did not know where to go
Routine preventive care
Other CSHCN 5.5 (2.3, 12.5) 8.6 (4.5, 15.7) 2.0 (0.9, 4.4) 5.9 (2.9, 11.7) 1.5 (0.4, 5.9)
CSHCN with other EDB 7.5 (4.0, 13.8) 15.4 (9.3, 24.3) 4.7 (2.2, 9.8) 8.6 (3.7, 19.0) 2.7 (1.0, 7.3)
CSHCN with ASD 3.7 (0.7, 17.6) 15.0 (6.3, 31.7) 15.2 (5.2, 36.8) 7.9 (3.0, 19.1) 14.2 (3.7, 41.5)
Specialty care
Other CSHCN 7.8 (5.3, 11.4) 12.1 (8.5, 17.2) 6.5 (4.3, 9.7) 5.9 (3.7, 9.2) 5.6 (2.1, 14.1)
CSHCN with other EDB 14.7 (9.4, 22.2) 13.1 (8.5, 19.8) 12.8 (7.3, 21.4) 6.3 (4.0, 9.9) 4.8 (2.7, 8.3)
CSHCN with ASD 22.3 (11.8, 38.1) 9.8 (4.6, 19.5) 15.6 (7.4, 30.1) 20.7 (6.0, 51.9) 13.9 (5.8, 29.7)
Therapy
Other CSHCN 7.6 (4.4, 12.8) 5.3 (2.9, 9.4) 1.2 (0.5, 2.7) 12.2 (5.0, 26.8) 2.6 (1.2, 5.8)
CSHCN with other EDB 12.7 (8.8, 18.1) 5.2 (2.9, 9.2) 1.8 (0.9, 3.3) 3.9 (2.0, 7.4) 3.2 (1.3, 7.3)
CSHCN with ASD 19.1 (12.6, 28.1) 5.9 (3.0, 11.2) 5.8*** (3.0, 11.1) 5.2 (1.8, 14.1) 5.4 (2.8, 10.3)
Mental health
Other CSHCN 8.4 (4.8, 14.1) 7.4 (3.9, 13.7) 3.8 (1.6, 8.9) 7.9 (4.0, 15.1) 10.3 (4.3, 22.7)
CSHCN with other EDB 9.7 (6.9, 13.5) 7.7 (5.5, 10.7) 3.9 (2.6, 5.7) 9.1 (7.0, 11.7) 4.8 (3.3, 7.0)
CSHCN with ASD 16.8 (8.4, 30.8) 5.7 (2.4, 13.0) 13.6*** (7.2, 24.0) 14.2 (3.9, 40.2) 12.8 (5.3, 27.9)
Chi-square test of the null hypothesis of no group differences
Table 5 Adjusted ORs (and 95% CI) for factors associated with measures of unmet needs Variable Unmet routine
preventive care needs
Unmet specialty care needs
Unmet therapy care needs
Unmet mental health care needs
Health condition group
CSHCN with ASD 1.50 (0.89–1.74) 2.01 (1.21–3.35) 1.41 (1.05–1.90) 1.42 (0.92–2.19) CSHCN with other EDB 1.25 (0.92–2.46) 1.38 (1.07–1.78) 1.20 (0.92–1.56) 1.20 (0.93–1.55)
Other CSHCN 1.00 1.00 1.00 1.00
Predisposing
Age
3–5 0.83 (0.56–1.22) 0.69 (0.49–0.99) 1.23 (0.91–1.65) 1.14 (0.77–1.71) 6–11 0.82 (0.60–1.12) 0.84 (0.65–1.08) 0.87 (0.66–1.16) 0.78 (0.6–0.97)
12? 1.00 1.00 1.00 1.00
Gender
Male 1.00 1.00 1.00 1.00
Female 0.87 (0.65–1.17) 0.95 (0.75–1.20) 1.33 (1.03–1.73) 0.96 (0.77–1.19) Hispanic origin and race
Non-hispanic, white 1.00 1.00 1.00 1.00
Hispanic, any race 0.95 (0.54–1.68) 1.01 (0.68–1.51) 1.30 (0.87–1.94) 1.15 (0.81–1.64) Non-hispanic, black 1.01 (0.76–1.52) 0.96 (0.65–1.41) 0.98 (0.68–1.41) 0.86 (0.61–1.20)
Non-hispanic, multiracial 1.20 (0.66–2.17) 1.33 (0.83–2.12) 0.95 (0.59–1.54) 1.33 (0.87–2.03) Non-hispanic, other 1.48 (0.72–3.00) 1.23 (0.64–2.36) 1.48 (0.61–3.59) 1.28 (0.80–2.06) Primary language spoken at home
Non-english 1.00 1.00 1.00 1.00
English 0.70 (0.35–1.37) 1.17 (0.67–2.03) 1.03 (0.58–1.83) 1.79 (1.03–3.12)
Family structure
2 parent (biological/adoptive) 1.00 1.00 1.00 1.00
2 parent (step) 0.97 (0.63–1.49) 1.09 (0.75–1.57) 0.69 (0.45–1.04) 1.08 (0.77–1.50)
Single mother 1.39 (1.02–1.90) 1.10 (0.83–1.46) 1.03 (0.77–1.37) 1.46 (1.14–1.86) Other 1.27 (0.71–2.29) 1.31 (0.77–2.22) 0.86 (0.54–1.37) 1.27 (0.84–1.91)
Enabling
Poverty status, % FPL
\100 5.57 (3.12–9.97) 4.85 (3.15–7.47) 1.21 (0.80–1.84) 3.22 (2.16–4.80)
100 to\200 4.08 (2.56–6.50) 3.67 (2.57–5.24) 1.13 (0.79–1.63) 3.64 (2.55–5.18)
200 to\400 1.60 (1.01–2.54) 2.37 (1.68–3.33) 1.09 (0.78–1.54) 1.92 (1.39–2.66)
C400 1.00 1.00 1.00 1.00
Type of insurance
Private 1.00 1.00 1.00 1.00
Public 0.73 (0.05–1.17) 0.78 (0.57–1.08) 0.76 (0.55–1.05) 0.64 (0.48–0.86)
Both private and public 0.87 (0.46–1.64) 0.78 (0.49–1.27) 0.82 (0.58–1.16) 0.84 (0.56–1.26) Insured (type unknown) 0.62 (0.20–1.89) 0.47 (0.24–0.93) 0.53 (0.24–1.21) 0.65 (0.32–1.36)
Uninsured 8.80 (5.78–13.40) 4.96 (3.38–7.27) 2.03 (1.25–3.31) 3.55 (2.42–5.21) Geographic region
Northeast 1.00 1.00 1.00 1.00
Midwest 1.29 (0.80–2.09) 0.67 (0.47–0.95) 0.94 (0.68–1.29) 0.96 (0.70–1.32) South 1.60 (1.02–2.53) 0.79 (0.56–1.09) 1.17 (0.87–1.59) 1.16 (0.85–1.57)
West 2.20 (1.38–3.51) 1.04 (0.72–1.52) 1.32 (0.87–2.00) 1.67 (1.17–2.37)
Need
Functional ability
Third, parents of children whose functional ability is always or usually affected by their condition are more likely to report having unmet needs on all of the selected core health care services.
Finally, after controlling for all identified predisposing, enabling and need factors, some differences across health condition groups remained. Families of children with ASD are in fact significantly more at risk for having unmet specialty and therapy care needs. However there were no group differences in the likelihood of having unmet routine or mental health care needs.
Discussion
This study presents the first set of estimates of the preva-lence of reported unmet need for four core health care services for children with ASD. Understanding the nature and extent of health disparities is the first step toward the creation of policies aimed at narrowing those disparities [25].
The analysis generated four key findings.
1 Children with ASD are more likely than the compar-ison groups to experience unmet needs and access problems.
Our study showed important disparities in unmet needs by health condition group. The multivariate analysis revealed that significant differences in unmet need for services remained among these groups even after control-ling for potentially confounding relationships. Following Andersen’s model of health care utilization, we controlled for factors that have been shown to affect health care uti-lization in order to isolate the effect of having an ASD. All other things being equal, children with ASD were signifi-cantly more at risk of not receiving needed specialty and therapy care. In terms of unmet specialty care needs, their experience is comparable with that of children with EDB problems, but it appears to be unique in terms of therapy needs.
Some have attributed the large occurrence of unmet needs to the organizational features of managed care pro-grams [7, 26–28]. In the past decade, children’s health insurance has gradually shifted from private to public coverage, and concurrently managed care has become the leading financing and delivery mechanism for both private and public plans [28]. From 1991 to 2004 the proportion of the Medicaid population enrolled in managed care has in fact risen from 9.5 to 60.7% [29]. While managed care has many features that can promote excellent care, it also has the potential to limit quality, encourage inadequate ser-vices, or diminish the breadth of services provided. Fur-thermore, regular use of ‘‘carve-out’’ measures to manage
costs—many state Medicaid programs have separate con-tracts for behavioral health services, for example—can render care coordination between pediatricians and other health care professionals more difficult [30]. Thus, children with ASD or EDB face an important challenge in accessing all needed services in a largely managed care environment. Families of children with ASD struggled particularly with finding providers with the necessary skills to deliver therapy and mental health services to their children. This finding is not surprising if one considers that a survey of a random sample of US physicians in both primary care and specialty fields revealed that most physicians believed their medical training to treat chronic conditions was unsatis-factory. They lamented that their clinical training was not adequate to diagnose and treat complex conditions and thus felt ill-equipped to meet the demand of their current practice [31]. This suggests that changes in medical cur-ricula could improve physicians’ competency to treat children with chronic, complex conditions [31]. Research has also shown that provider-based access problems, such as finding experienced providers, increase greatly when children have a behavioral condition, autism or their health care needs are not stable, and that these problems are not correlated with insurance status [8, 14]. It is therefore likely that increasing insurance coverage and financing will not be sufficient to address this specific issue and that combined financial and system-related approaches might be more successful [8,15,32].
2 Unmet service need was found to vary by service type.
Our analysis shows that nationally 77.3 and 51.0% of all CSHCN needed routine and specialty care in the 12 months prior to the survey. A smaller but still sizeable percentage also reported needing therapy or mental health care (22.5 and 26.6%, respectively) for the same time period. Parents of children with ASD, however, compared to parents of chil-dren with other SHCN and chilchil-dren with EDB, expressed significantly higher needs for specialty care (64.5% vs. 51.0%, v2=315.3, P\0.01) and for therapy services
(75.1% vs. 22.5%,v2=4,115.3,P\0.01).
that children are more likely than adults to be affected by coverage that limits the number of days or visits as they are more likely to exceed such limits [36]. While health insurance in general makes children’s behavioral health care more affordable, benefit restrictions or diagnostic exclusions can mean that some children become in effect uninsured if they require services more complex or intense than those covered under the plan, or if they need treatment for conditions that are not included in the plan [37].
In recent years several states have adopted laws requiring insurers to provide coverage for the treatment of autism. Even though most mandates include a benefit cap or some other kind of limitation, these policies are likely to still have a positive impact especially in times of shrinking public resources as they will provide children and families with additional coverage and access to treatment.
Finally, we also found lower reports unmet mental health needs among non-English speaking respondents. Cultural differences about what constitutes a medical and mental disorder and the propensity among some non-English speaking groups to underreport lack of care could explain this finding [38, 39]. Additionally, our analyses revealed that race/ethnicity was not a contributing factor in explaining unmet health care needs. This could be attrib-uted to the ‘‘healthy-immigrant effect’’, some other cultural factor or to the way in which respondents with different ethnic backgrounds are screened into the NS-CSHCN sample [40,41].
3 The prevalence of specific access problems varied by service type.
Although we found no statistically significant differ-ences among health condition groups for the health plan-based access measures, our analyses showed that a sub-stantial percentage of all parents attributed having unmet needs to high cost, lack of insurance coverage or more general health plan problems. Obtaining referrals or having providers who did not accept the family’s insurance were perceived as less pervasive problems. These data indicate the presence of systemic problems. At the system level, the first barrier to overcome is access to health insurance. During the past decade, both federal and state governments have made efforts to expand health care coverage for all children, including those with special health care needs. The State Children’s Health Insurance Program (SCHIP) and other federal and state-led efforts have created unprecedented opportunities for outreach and enrollment to ensure that all children have access to the care they need to be healthy [42]. Overcoming obstacles to insurance cov-erage is important because data show that in states where more people are insured, adults and children are more likely to have a medical home and receive recommended preventive and chronic care [16].
4 The prevalence of unmet needs is greater for children whose functional ability is always or often affected.
Within the larger group of children with special health care needs, there appears to be a subgroup of children with severe limitations in activities. Even after controlling for insurance status and other relevant predictors of access to care, parents of these children are more likely to report unmet needs on all four health care outcomes compared with similar reports for CSHCN with fewer limitations. In line with our finding of greater difficulties accessing care, other research has also found consistent patterns of dis-parities whereby CSHCN with greater functional limita-tions have a higher risk of having delayed or forgone care [43], experience greater adverse impact on the family’s finances, time, and employment [44], and are less likely to have a medical home and be in greater need of care coordination [42]. Further research to understand why these children experience greater difficulties can help inform future efforts to insure a more equitable distribution of health care services.
Limitations
This study is not without limitation. First of all, the NS-CSHCN relied on parents’ reports of an ASD diagnosis rather than medical record data. However, there is some evidence that parents can reliably report such a diagnosis [45]. Secondly, the survey relied on parents accurately assessing their child’s unmet needs. Again, this can be subject to recognition and recall errors.
Conclusions
Despite these limitations, this study has expanded what is currently known about unmet health care needs and health care access problems for children with ASD and their families by examining four core health care service areas and specific types of access problems.
References
1. Centers for Disease Control and Prevention. (2009). Prevalence of autism spectrum disorders—Autism and developmental dis-abilities monitoring network, United States, 2006.Morbidity and Mortality Weekly Report, 58(SS10), 1–20.
2. Centers for Disease Control and Prevention. (2007). Prevalence of autism spectrum disorders–Autism and developmental dis-abilities monitoring network, 14 sites, United States 2002. Mor-bidity and Mortality Weekly Report, 56(SS1), 12–28.
4. Newschaffer, C. J., Croen, L. A., Daniels, J., et al. (2007). The epidemiology of autism spectrum disorders*.Annual Review of Public Health, 28(1), 235–258.
5. Strickland, B. B., Jones, J. R., Ghandour, R. M., et al. (2011). The medical home: health care access and impact for children and youth in the United States.Pediatrics, 127(4), 604–611. 6. Newacheck, P. W., McManus, M., Fox, H. B., et al. (2000).
Access to health care for children with special health care needs. Pediatrics, 105, 760–766.
7. Davidoff, A. J. (2004). Insurance for children with special health care needs: patterns of coverage and burden on families to pro-vide adequate insurance.Pediatrics, 114(2), 394–403.
8. Warfield, M. E., & Gulley, S. (2006). Unmet need and problems accessing specialty medical and related services among children with special health care needs. Maternal and Child Health Journal, 10(2), 201–216.
9. Kogan, M. D., Strickland, B. B., Blumberg, S. J., et al. (2008). A national profile of the health care experiences and family impact of autism spectrum disorder among children in the United States, 2005–2006.Pediatrics, 122(6), e1149–e1158.
10. Liptak, G. S., Stuart, T., & Auinger, P. (2006). Health care uti-lization and expenditures for children with autism: Data from US national samples. Journalof Autism and Developmental Disor-ders, 36(7), 871–879.
11. Croen, L. A., Najjar, D. V., Ray, G. T., et al. (2006). A com-parison of health care utilization and costs of children with and without autism spectrum disorders in a large group-model health plan.Pediatrics, 118(4), e1203–e1211.
12. Gurney, J. G., McPheeters, M. L., & Davis, M. M. (2006). Parental report of health conditions and health care use among children with and without autism: National survey of children’s health.Archives of Pediatrics and Adolescent Medicine, 160(8), 825–830.
13. Peng, C. Z., Hatlestad, P., Klug, M. G., et al. (2009). Health care costs and utilization rates for children with pervasive develop-mental disorders in North Dakota from 1998 to 2004: impact on Medicaid.Journal of Child Neurology, 24(2), 140–147. 14. Krauss, M. W., Gulley, S., Sciegaj, M., et al. (2003). Access to
specialty medical care for children with mental retardation, aut-ism, and other special health care needs. Mental Retardation, 41(5), 329–339.
15. Newacheck, P. W., Hughes, D. C., Hung, Y. Y., et al. (2000). The unmet health needs of America’s children.Pediatrics, 105(4 Pt 2), 989–997.
16. Cantor, J. C., Schoen, C., Belloff, D., et al. (2007). Aiming higher: Results from a state scorecard on health system perfor-mance. New york: The Commonwealth Fund Commission on a High Performance Health System.
17. Kuhlthau, K., Nyman, R. M., Ferris, T. G., et al. (2004). Corre-lates of use of specialty care.Pediatrics, 113(3), e249–e255. 18. Andersen, R. M. (1995). Revisiting the behavioral model and
access to medical care: Does it matter? Journal of Health and Social Behavior, 36(1), 1–10.
19. US Department of Health and Human Services, Health Resources and Services Administration, Maternal and Child Health Bureau. The National Survey of Children with Special Health Care Needs Chartbook 2005–2006. Rockville, Maryland: US Department of Health and Human Services 2007.
20. Bethell, C. D., Read, D., Stein, R. E. K., et al. (2002). Identifying children with special health care needs: Development and evalua-tion of a short screening instrument.Ambulatory Pediatrics, 2(1), 38–48.
21. Osterling, J. A., Brooks, C. A., Unis, A. S., et al. (2000). A child with an autism spectrum disorder. In M. J. Guralnick (Ed.), Interdisciplinary clinical assessment of young children with developmental disabilities. Baltimore: Paul H. Brookes Pub. Co.
22. Blumberg, S. J., Welch, E. M., Chowdhury, S. R., et al. (2008). Design and operation of the national survey of children with special health care needs, 2005–2006. National center for health statistics.Vital Health Statistics, 1(45), 1–188.
23. StataCorp. (2007).Stata statistical software: Release 10. College Station, TX: StataCorp LP.
24. Breakwell, G. M. (2006).Research methods in psychology(3rd ed.). London; Thousand Oaks, CA: Sage Publications.
25. Kilbourne, A. M., Switzer, G., Hyman, K., et al. (2006). Advancing health disparities research within the health care system: a conceptual framework. American Journal of Public Health, 96(12), 2113–2121.
26. Fox, H. B., & McManus, M. A. (2001). A national study of commercial health insurance and medicaid definitions of medical necessity: What do they mean for children?Ambulatory Pediat-rics, 1(1), 16–22.
27. Kastner, T. A. (2004). Committee on children with disabilities. Managed care and children with special health care needs. Pediatrics, 114(6), 1693–1698.
28. Honberg, L. E., Kogan, M. D., Allen, D., et al. (2009). Progress in ensuring adequate health insurance for children with special health care needs.Pediatrics, 124(5), 1273–1280.
29. Tang, M. H., Hill, K. S., Boudreau, A. A., et al. (2008). Medicaid managed care and the unmet need for mental health care among children with special health care needs. Health Services Research, 43(3), 882–900.
30. Simpson, L., & Fraser, I. (1999). Children and managed care: What research can, can’t, and should tell us about impact. Med-ical Care Research and Review, 56(Suppl 2), 13–36.
31. Darer, J. D., Hwang, W., Pham, H. H., et al. (2004). More training needed in chronic care: A survey of US Physicians. Academic Medicine, 79(6), 541–548.
32. Halfon, N., Inkelas, M., & Wood, D. (1995). Nonfinancial bar-riers to care for children and youth. Annual Review of Public Health, 16, 447–472.
33. Mayer, M. L., Skinner, A. C., & Slifkin, R. T. (2004). Unmet need for routine and specialty care: data from the national survey of children with special health care needs. Pediatrics, 113(2), e109–e115.
34. DeRigne, L., Porterfield, S., & Metz, S. (2009). The influence of health insurance on parent’s reports of children’s unmet mental health needs.Maternal and Child Health Journal, 13(2), 176–186. 35. Benedict, R. E. (2006). Disparities in use of and unmet need for therapeutic and supportive services among school-age children with functional limitations: A comparison across settings.Health Services Research, 41(1), 103–124.
36. Peele, P. B., Lave, J. R., & Xu, Y. (1999). Benefit limits in managed behavioral health care: Do they matter?The Journal of Behavioral Health Services and Research, 26(4), 430–441. 37. Peele, P. B., Lave, J. R., & Kelleher, K. J. (2002). Exclusions and
limitations in children’s behavioral health care coverage. Psy-chiatric Services, 53(5), 591–594.
38. Yu, S. M., Huang, Z. J., Schwalberg, R. H., et al. (2006). Parental english proficiency and children’s health services access. Amer-ican Journal of Public Health, 96(8), 1449–1455.
39. Welterlin, A., & LaRue, R. H. (2007). Serving the needs of immigrant families of children with autism. Disability and Society, 22(7), 600–747.
40. Shenkman, E., Vogel, B., Brooks, R., et al. (2001). Race and ethnicity and the identification of special needs children.Health Care Financing Review, 23(2), 35–51.
41. Yu, S. M., & Singh, G. K. (2009). Household language use and health care access, unmet need, and family impact among CSHCN.Pediatrics, 124(Suppl 4), S414–S419.
children with special health care needs. Pediatrics, 113(5), 1485–1492.
43. Huang, Z. J., Kogan, M. D., Yu, S. M., et al. (2005). Delayed or forgone care among children with special health care needs: an analysis of the 2001 National Survey of Children with Special Health Care Needs.Ambulatory Pediatrics, 5(1), 60–67. 44. van Dyck, P. C., Kogan, M. D., McPherson, M. G., et al. (2004).
Prevalence and characteristics of children with special health care
needs.Archives of Pediatrics and Adolescent Medicine, 158(9), 884–890.