Improving Heat Exchanger Network Design of a Revamped
Chemical Plant
Zulfan Adi Putra*
Department of Chemical Engineering, Universiti Teknologi Petronas, Bandar Seri Iskandar, Perak 32610, Malaysia
*Corresponding author: Email: [email protected]; Tel.: +605368 7579
A B S T R A C T S A R T I C L E I N F O
Pinch analysis has been known as one of the tools for smart energy management. This technique has successfully been applied in more than three decades in various industries. Here, the purpose of this study was to describe how to use pinch analysis for improving heat exchanger network design of a revamped chemical plant. In a revamping project of a chemical plant, the pinch analysis is applied to find a better design. The analysis reveals that the revamped case can be further improved to achieve more energy saving. This is done by applying one of the golden rules in pinch analysis, which is not to transfer heat across the pinch. The proposed solution is rather simple and straightforward, leading to only few
o ths of pay a k pe iod a d k€ pe a ual sa i g. © 2017 Tim Pengembang Jurnal UPI
Article History:
Received 01 February 2017 Revised 03 February 2017 Accepted 16 Februari 2017 Available online 01 April 2017
____________________
Keyword: Pinch analysis, Industrial system, Utility,
Heat exchanger, Payback Period.
Indonesian Journal of Science & Technology
1. INTRODUCTION
Pinch analysis is a well-known tool to give insights on thermal energy saving. (Aspelund et al., 2007) Its diverse applications in various industries show its usefulness. (Varbanov, 2014) For further information, literatures have covered this subject in great details. (Kemp, 2005;
Linnhoff, 1993; Feng & Zhu, 1997).
Previous study has been reported about early phase process evaluation, (Putra, 2016). Here, in this article, the pinch analysis has been applied to improve the design of a chemical plant. A revamp project was done on the plant to keep up to the increasing
market demands. As background
information, its current and revamped situations will be discussed. Next, a pinch analysis of the plant is applied and a straightforward solution is recommended. Due to confidentiality, all drawings and data have been changed from the original case, leaving only the similar problem and the recommended solution.
2. CURRENT SITUATION
The chemical production is a very simple process, where the feed is reacted in a reactor and the outlet stream is separated in two sequential distillation columns. (Douglas, 1985) Unreacted feed is recycled to a feed tank, while the product and the waste are sent to their corresponding destinations. (Adams & Seider, 2006) The plant has already had an existing heat integration feature, where the feed stream is preheated with several streams coming from reactor and distillation columns. (Stankiewicz & Moulijn, 2000)
The current plant runs without using heat exchanger HE-16, upstream of D1 (see Figure 1). The heat exchanger is connected to the cooling water system to further reduce the temperature of the outlet reactor before entering D1. Unfortunately, it was broken. Nonetheless, the operators did not have any problem in running the plant. Hence, HE-16 was bypassed and the stream was not further cooled (See Figure 1).
3. REVAMPED SITUATION reactor is installed, while the two distillation columns are not modified. They are apparently big enough for the new capacity. The bigger outlet stream from the reactor exchanger would be re-operated. Hence, this was the slight difference from the current situation.
DOI: http://dx.doi.org/10.17509/ijost.v2i1
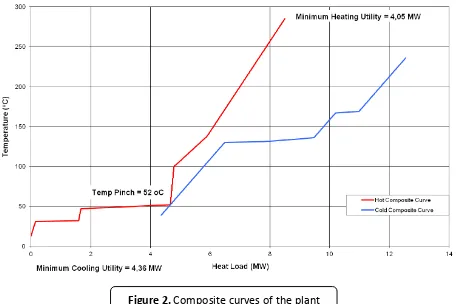
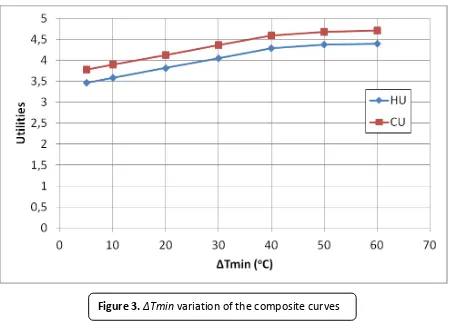
A pinch analysis was performed (see Figure 2). This figure shows relationship between yielded hot/cold composite curves and temperature. The curves were obtained by different temperature minimum (∆Tmin) of 30C. It was calculated that the revamped case would be about 29% higher and 27% this expansion project regarding the energy consumption? If it is possible, how much energy could be reduced and how would be done that?
4. ANALYSIS OF THE EXISTING HEAT EXCHANGER NETWORK DESIGN
To answer such questions, the composite curves were revisited and the
heat exchanger network design was observed deeper. (Kazantzi, 2006) Squeezing more from the heat integration does not
From this figure, it has been found that even using a small temperature ∆Tmin, it
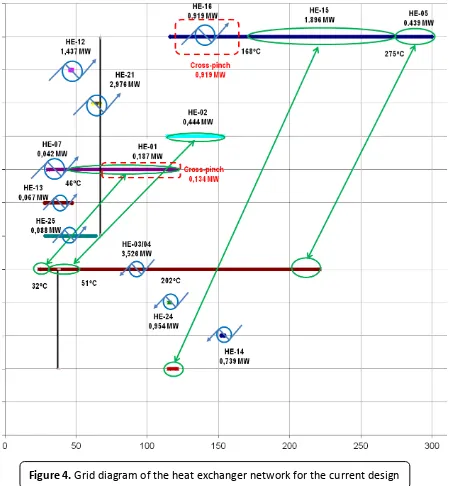
would not reduce both utilities significantly. On the contrary, it would definitely increase the plant complexity. Another look at the current heat exchanger network design, presented in a grid diagram, is shown in Figure 4. The grid diagram is constructed with the temperature ∆Tmin of 30oC and
pinch temperature of 52oC (see Figure 2).
DOI: http://dx.doi.org/10.17509/ijost.v2i1
p- ISSN 2528-1410 e- ISSN 2527-8045 Based on this analysis, there are two of 0.92 MW also yields the same amount of penalty to the heating utility.
The second violation is a heat transferred across pinch in HE-01. The amount of heat is with the amount of 0.134 MW. This will also give the same amount of penalties to both heating and cooling utilities.
5. PROPOSED SOLUTION
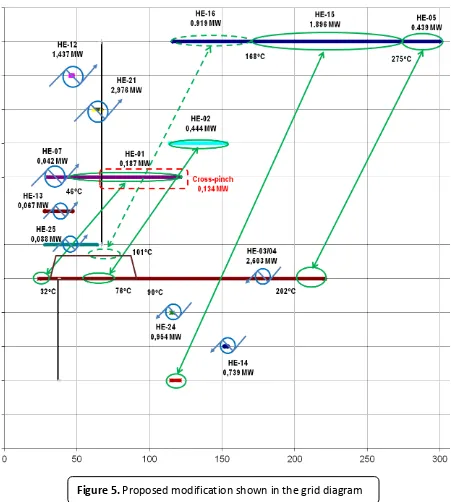
The above observation clearly shows what needs to be done to improve the current heat exchanger network design. Due to its significant amount and simpler to implement, removing the first violation is relatively a straightforward solution. Hence, the feed stream downstream of HE-01 is split into two streams. One part goes to its current destination (the existing HE-02), and the other part is rerouted to the existing HE-16. With this modification, the heating
This modification requires additional areas in the existing HE-16, which is symbolized in the additional blue part of HE-16 in Figure 6. In-house capital expenditure (CAPEX) estimation shows a required i stalled ost of a out k€. This cost can be considered good.
The comparison of utilities in several
temperatures ∆Tmin) is shown in Table 1.
DOI: http://dx.doi.org/10.17509/ijost.v2i1
p- ISSN 2528-1410 e- ISSN 2527-8045 about 6% lower than the targets. It has been
improved significantly from the original revamped case.
Compared to the current utilities of the revamped case, the proposed modification
has a saving opportunity of about 0.92 MW. This translates i to k€/y of sa i g, which is significant. Based on the estimated investment, the payback period is about 3 months.
DOI: http://dx.doi.org/10.17509/ijost.v2i1
p- ISSN 2528-1410 e- ISSN 2527-8045 Without heat
integration
Current utilities Target at ∆Tmin=30oC
A pinch analysis has been performed to improve a design of a revamping chemical project. A slight difference in the revamped case that was thought not to give any issue is apparently the reason for higher energy consumption. Some pipe rerouting and additional heat exchanger areas are proposed, which gives only 3 months of conflict of interest regarding the publication of this article. Authors confirmed that the data and the paper are free of plagiarism.
9. REFERENCES
Adams, T. A., & Seider, W. D. (2006). Semicontinuous distillation with chemical reaction in a middle vessel. Industrial and engineering chemistry research, 45(16), 5548-5560. Aspelund, A., Berstad, D. O., & Gundersen, T. (2007). An extended pinch analysis and design
procedure utilizing pressure based exergy for subambient cooling. Applied thermal engineering, 27(16), 2633-2649.
Douglas, J. M. (1985). A hierarchical decision procedure for process synthesis. AIChE journal, 31(3), 353-362.
Feng, X., & Zhu, X. X. (1997). Combining pinch and exergy analysis for process modifications. Applied thermal engineering, 17(3), 249-261.
Kazantzi, V. (2006). Novel visualization and algebraic techniques for sustainable development through property integration (Doctoral dissertation, Texas A&M University).
Kemp, I. C. (2005). Reducing dryer energy use by process integration and pinch analysis. Drying technology, 23(9-11), 2089-2104.
Linnhoff, B. (1993). Pinch analysis: a state-of-the-art overview: Techno-economic analysis. Chemical engineering research and design, 71(5), 503-522.
DOI: http://dx.doi.org/10.17509/ijost.v2i1
Putra, Z. A. (2016). Early phase process evaluation: Industrial practices. Indonesian journal of science and technology, 1(2), 238-248.
Stankiewicz, A. I., & Moulijn, J. A. (2000). Process intensification: transforming chemical engineering. Chemical engineering progress, 96(1), 22-34.
Varbanov, P. S. (2014). Energy and water interactions: implications for industry. Current opinion in chemical engineering, 5, 15-21.