A DISCRETE TRACKING BASED-ON
REGION FOR RED-LIGHT RUNNING
DETECTION
ISWANJONO
Department of Electrical Engineering, Faculty of Engineering, Universitas Indonesia, Depok, West Java, 16424, Indonesia
[email protected]; [email protected] http://www.te.usd.ac.id
BUDIARDJO, B.
Department of Electrical Engineering, Faculty of Engineering, Universitas Indonesia, Depok, West Java, 16424, Indonesia
[email protected] http://www.ee.ui.ac.id
RAMLI, K.
Department of Electrical Engineering, Faculty of Engineering, Universitas Indonesia, Depok, West Java, 16424, Indonesia
[email protected] http://www.ee.ui.ac.id Abstract:
Red-light running problem has been recognized as a significant safety problem in Indonesia as well as throughout the world. This is a frequent and highly dangerous driving act. Reducing this risk behavior depends on understanding its prevalence, as well as the drivers involved. However, it should also improve the infrastructure system in order to be an intelligent system. In this study, modeling and simulations are made to measure the speed of each vehicle that will pass through the intersection to predict the possibility of vehicles violating traffic lights. The detection of vehicle IDs used discrete tracking algorithm base on region. The result showed that the position data and time detection sensor used successfully to determine the average speed, the distance from the intersection and acceleration of the movement of vehicles. From the predicted results, a vehicle violates traffic lights reached 82.68%.
Keywords: Red-Light Running (RLR); region-based; violation detection; discrete tracking algorithm. 1. Introduction
Modeling and simulation of traffic control system in an intersection are the basic for the management of urban traffic area system. The traffic light arrangements are used to control the intersection, however the traffic flow can be influenced through driver information/guidance. Heavy traffic can cause frustration and violation events. Traffic crashes are the most significant cause of preventable death and injury in Jakarta, Indonesia. The Indonesia Police Commission (IPC) reports that on “Operasi Patuh Jaya July 2010” alone, nearly 77 people were killed and approximately one thousand people were injured in intersection related crashes [1]. It is same cause on North America, these intersection-related crashes account for about 40%-45% of all crashes. According to 2005 data from Fatality Analysis Reporting System of The National Highway Traffic Safety Administration (NHTSA), crashes caused by Red-Light-Running (RLR) resulted in an estimated 805 fatalities [2].
In recent years, researchers have considered some ’dynamic’ countermeasures. The basic idea is to adapt to Impending conflict depending on the prediction of vehicle behaviors and impending signal phase and timing (SPAT). For example, in the case of high speed signalized intersection conflict, Bonneson and Zimmerman have focused on extending the length of the yellow cycle [3]. Recently, under the Cooperative Intersection Collision Avoidance System (CICAS) sponsored by the United States Department of Transportation, researchers have focused on enhancing the conspicuity of the red signal by providing an additional roadside warning display [4], and an in-vehicle audible or visual alert [5].
A red-light running (RLR) research has been conducted over a decade in terms of traffic safety. The driver behavior of RLR violators has been investigated [9]. Daily fluctuation of RLR on hourly basis with linear regression analysis is examined under various condition, such as average daily traffic (ADT), number of approach lanes, speed limits, number of cross lanes and distance of preceding and following intersections [10]. In this case the probability of RLR vehicles entries the dilemma zones with a certain speed is obtained and evaluated using Autoscope camera.
Development of RLR detection system has been investigated use combinations of video camera, red digital camera, flash light and sensor loop. The system is provided that capable to keep a license plate number on bad weather or in night day. But then the system have disadvantage caused by limited of video and camera specification on capturing of high speed vehicle movement [11].
Based on RFID reader network we proposed a new tracking model and simulation for a signalized intersection of multilane traffic flow. The coverage area of RFID antenna is capable for a red-light running model based on region. The tracking algorithm for RLR prediction and detection is implemented on Scilab software. This algorithm can predict RLR at yellow onset and can detect RLR at red-phase.
This paper has two main goals:
proposed a discrete tracking algorithm at the intersection to model red-light running (RLR) prediction and detection based on ID. Simulation of the model is running under Scilab.
studied the RLR behavior of individual and cluster vehicles. 2. Related Works
The prediction of RLR is a crucial part for the collision avoidance systems, which must be able to sense the dynamic characteristics of a vehicle approaching the intersection from a reasonable range. A dynamic “state-map” of the intersection defined by Zennaro and Misener can then be built upon the sensed components [12]. Based on the state-map, violation needs to be predicted to enable the engineering measures such as issuing a warning or dynamically adapting the signal to protect vehicles affected by the violator [13]. Zhang, L., et al. defines a predictive encroachment time (ET) to probabilistically model RLR-related hazards. The predictive ET associates the statistical model of the RLR trajectories with the empirical distribution of the entry time of vehicles that will encroach with the violator. The hazardous situation (instead of collision, which is very rare in both space and time such that its prediction is very difficult is then predicted to enable the engineering measures to protect vehicles affected by the violator [14].
Red-light violation detection use video technology, such as those which is worked Chen, Y. and Yang, C. to detect red-light violation base-on region. It present a vision vehicle detection algorithm based on region according to the practice of crossroads and the characteristics of vehicles running red -light. The method can eliminate the disturbance aroused by illumination, shadow, foot passenger, etc. The principle of vehicle detection algorithm based on region is according to the fact that vehicles are required to stop in front of stop line in the red light signals at the crossroads. They set detection region from the beginning of the stop line to the font of sidewalks and implement the detection on moving vehicles according to the judgment on covering detection region [15]. The other ways, that has been investigated the RFID-based simulation for RLR detection using scilab [16]. Using RFID, the system capable to detect violator, count traffic and predict violator speed.
3. A Method of Discrete Tracking Based-on RFID
A discrete tracking is designed to track persons and objects attached by region-based of RFID tags moving in an RFID Reader Network. The RFID Reader Network herein consists of densely deployed RFID Readers (or RFID Interrogators), which are connected by short-range wireless technologies in ad hoc mode. Since the position of RFID tag is located by RFID readers, the ideal performance of this algorithm is achieved in the condition that the distance between two readers is far greater than the interrogation range of RFID system.
Figure 1 shows the principle of discrete tracking based-on region. In Fig. 1, the black point stands for a RFID reader and the matrix is a RFID Reader Network. As Fig. 1 depicted, when a tag moves from reader (1,1) to reader (2,1), the straight line between them is regarded as the track of the tag by us. Therefore, when moving along the thick curve in the figure, which denotes the real path of a person or object in the RFID Network, the tag is interrogated by readers along the path. And the virtual line is defined as the track of the tag. So the track in Fig. 1 is:
Track = (1,1) (2,1) (2,3) (1,4) (2,5) (3,5) (3,4) (4,3) (3,2) (4,1)
{(1,2), (1,3), (1,4), (2,2), (2,4), (3,2), (3,3), (3,4)}
Therefore, discrete tracking algorithm must choose adjacent readers along the track.
Fig. 1. Principle of a Discrete Tracking
Tracking vector (TV) plays a key role in collecting tracking information and calculating the track. It defines the combination of the tag identity, the interrogation time and the identifier of reader as Tracking Vector [17]. The structure of TV is:
< Vi ,tj,Rk > = < Vehicle Tag i, time-stamp j, Reader k > (1) Here, the tag identity is a global unique number stored in the electronic chip of each tag and interrogated by reader. The discrete tracking can simultaneously track tens, even hundreds of tags tagged on objects or persons within a single network by classifying different tags according to the unique identity in each TV. Timestamp is the interrogation time of RFID reader when the tag entering its interrogation zone. We assume that all RFID readers in RFID Reader Network are synchronous. And only one tracking vector is generated no matter how long a tag stays within the interrogation zone of one reader. The third parameter in TV is the identifier of the reader.
The tracking calculation is simply. Suppose the following two TVs are sent to RFID Application System simultaneously.
{< V1 ,t1 ,R1 > < V2 ,t2 ,R2 > } t1< t2 (2) The former reports that the reader with the identifier R1 has interrogated vehicle tag V1 at time indicated by timestamp t1. And the latter is the result of the reader R2 interrogated the vehicle tag V2 at time indicated by timestamp t2. If V1 is equal to V2, two tracking vectors are derived from the same vehicle. Suppose t2 is greater than t1 and two readers are adjacent to each other, the track is:
Track = R1→ R2 (3)
However, the above is merely the simplest and ideal condition of tracking. The generalized conditions are given as follows.
When vehicle tag ID V1 is equal to V2, these two TVs are derived from one single tag and should be classified into the same vector group to calculate the track of this tag. Otherwise, they are classified into different vector groups for tracking vehicle tag V1 and V2, respectively. About timestamp, when t1 is less than t2, it is simply. And if t1 is greater than t2, we can exchange the sequence of two tracking vectors and it is exactly as same as the above condition. Since two readers may interrogate one tag simultaneously, time-stamp t1 sometimes equals to t2.
4. Red-Light Running Prediction
2 1 * 1 0
* 2 2 0 2 0
0 ( )
2 1 ) (
2
v w L a
a v v x x
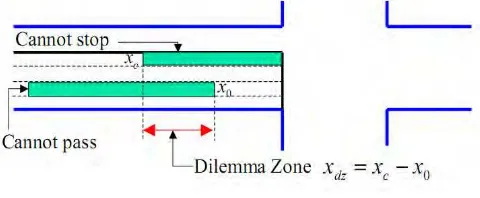
xdz c (5)
where:
xc = the critical distance for a smooth “stop” under the maximum deceleration rate;
x0 = the critical distance for “pass” under the maximum acceleration rate;
= duration of the yellow phase (sec);
1 = reaction time-lag of the driver-vehicle complex (sec);
2 = decision-making time of a driver (sec);
v0 = approaching speed of vehicles (ft/sec); a1 = average vehicle acceleration rate (ft/s2);
a1* = maximum acceleration rate of the approaching vehicles (ft/s2); a2 = average vehicle deceleration rate (ft/s2 );
a2* = maximum deceleration rate of the approaching vehicles (ft/s2);
w = intersection width (ft); and L = average vehicle length (ft).
Note that both the length and the location of a dilemma zone may vary with the speed of the approaching vehicles, driver reaction times, and vehicle acceleration/deceleration rates. Under the same condition, one can use a longer yellow phase to eliminate the dilemma zone if both the reaction time and vehicle acceleration/deceleration rates are identical among the driving populations. However, in reality the parameters,
1 and 2, which represent the perception and reaction times may vary significantly among driving
populations. The maximum acceleration/deceleration rates (denoted as a1* and a2*), and the approaching speed
(v0) may also be distributed in a wide range among different driver and vehicle groups.
Fig. 2. A graphical illustration of the dilemma zone at signalized intersections
Denote the duration of the yellow phase as Y, the average perceptive reaction time (PRT) as δ and the speed of the vehicle as v(t), a simple kinematics formulation of the dilemma zone [18] is that when the distance of the vehicle x(t) satisfies both
x(t) > Y · v(t), (6)
and
a v t v t x
2 ) ( . ) (
2
(7)
where ”a” is the acceleration rate to stop safely/comfortable.
Note that in the definition, we assume that the vehicle do not accelerate to proceed through the intersection, and this is based on our simulation from field intersection (see later sections of this paper). Actually if the vehicle accelerates to proceed, it may be able to clear the intersection even if it is in the dilemma zone defined in (6) and (7).
For data processing, each approaching vehicle i, we have a series of time-stamps
{t1(i) , t2(i) , . . . , tK(i)}, (8)
at the following relative distances to intersection,
{d(1), d(2), . . . , d(K)} (9)
where K is the total number of discrete emulated speed loops for each lane.
) running vehicle is formulated as
() ()
2In (12) and (13), when at the time of yellow onset tyon, the interesting vehicle i has not yet arrived at the first advanced detector, or t1(i) > tyon, we assume that the vehicle moved at constant speed from where it was at
yellow onset to the previousdetector. If the interesting vehicle i has already passed the previous detector at the time of yellow onset, then it must be between two of our detectors, say k1 and k2. The distance and speed are
calculated using the interpolation of the speeds and distances at detector k1 and k2. The parameters used in the
dilemma zone Eq. (6) and Eq. (7) are
δ = 1.0s, (14)
a = 0.3g, and (15)
time-to-intersection from 2s to 5s for option zone.
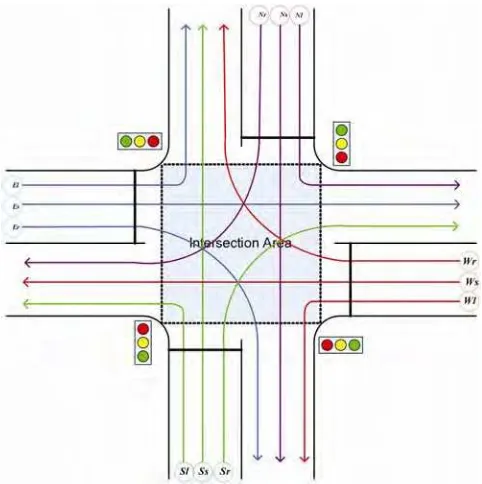
Fig. 4. RFID reader network reading range 5. Intersection Model and Simulation
RLR Prediction Algorithm:
Input xA1: A set of target ID <Vi,t0(i),xA0> , {Vi, 1 ≤ i≤ N} of size N
Input xA2: A set of target ID <Vi,t1(i),xA1> , {Vi, 1 ≤ i ≤ M} of size M
Calculate the average speed of Vi at xA1,
Get the histogram of entry time t1(i) using first-to-enter in yellow from tYYm for all Vi do
if t1(i) tY then Vico_RLR
end if end for
Input xA3: A set of target ID <Vi,t2(i),xA2> , {Vi, 1 ≤ i ≤ Q} of size Q from conflict path
Calculate the average speed of Viat xA2,
Get the histogram of entry time t2(i) using first-to-enter in red from tRRq for all Vi do
if ((t2(i)tR) and (v1
i v2
i )) thenViRLR
end if end for
Get a threshold time, , for each conflict course and choose the minimum one corresponding to each scenario for all Vi do
if Viis going through then
ViHg,For Hg,NF Calculate tI
^
using Vi at xA2 if tI
^
> and tI < then Vi {tI
^
> , tI < } end if
else
ViHs,For Hs,NF end if
end for
We have sets {Vi|Hg,F}, {Vi|Hg,NF}, {Vi|Hs,F} and {Vi|Hs,NF}
Estimate P(Hg) and P(Hs) using their frequency, respectively.
Estimate the mean and covariance matrices for hypothesis Hg and Hs
RLR Detection Algorithm:
Input xB: A set of target ID <Vi,t3(i),xB> , {Vi, 1 ≤ i ≤ K} of size K from conflict path on Red is turn on
for all Vi do
if t3(i) tR then ViRLR
end if end for
Calculate the average speed of RLR
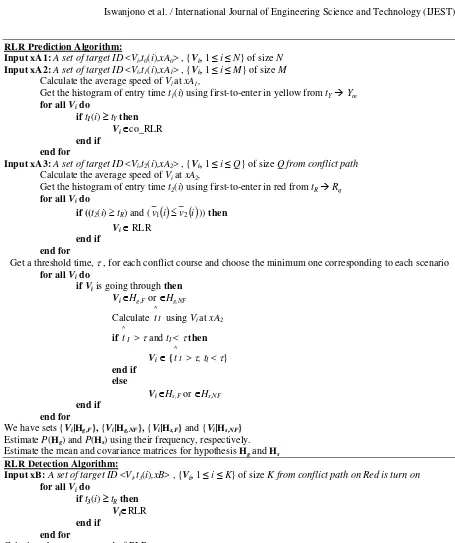
Fig. 5. RLR prediction and detection algorithm
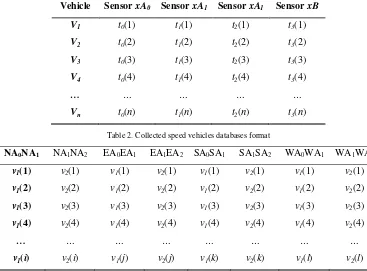
The tracking algorithm for RLR prediction and detection is implemented on Scilab software that is shown Figure 5. This algorithm can predict RLR at yellow onset and can detect it at red-phase. The simulation result data time-stamp (tj), a reader interrogated it (Rk) and vehicle tag ID (Vi). Table 1 show a time-stamp database format for vehicle tags. Tables 2 show a vehicle speed database format. In Table 1, t0(i) is the time-stamp of the vehicle i at reader xA0, t1(i) is the time-stamp of the vehicle i at reader xA1, t2(i) is the time-stamp of the vehicle i at reader xA2 and t3(i) is the time-stamp of the vehicle i at reader xB.
Model implementation: The model has been implemented successfully for the system shown schematically in Fig. 4. However, this algorithm can manage more complicated traffic problems in a large scale deployment of the RFID network. The main requirement for the deployment of ubiquitous RFID network is that every vehicle must carry a tag.
RLR determination: The speed, acceleration and distance measurement of vehicles using RFID devices was determined by a simulation technique. Those parameters are used to predict the RLR vehicles. The simulation was based on random data with Poisson distribution. The simulation was aimed at achieving the objectives listed below:
To study the RLR behavior of individual vehicles.
To study the RLR behavior of vehicles in clusters.
To evaluate the vehicle distance (dY(i)) from intersection at tyon.
To evaluate the speed vehicle at yellow fire (vY(i)).
To evaluate the acceleration ( ()
_
i a ).
Individual vehicle: The system has the capability to determine the average speed of any individual vehicle along the road. Referring to Table 1, each row lists out the time periods collected for a vehicle every time it passes by an RFID reader, so we can determine the average speed of any individual and collected them as Table 2. Based on the actual data of previous studies [20], [21] and [22] the vehicles move normally with a consistent average speed.
In the simulation, we limit the vehicle speed up to 180 km/h. The yellow time phase is set between 0.5s and 5.0s. If a vehicle entry to dilemma zone do not decrease its speed until to stop line, so this vehicle is predicted as RLR.
Table 1. Time-stamp database format for vehicle tags
Vehicle Sensor xA0 Sensor xA1 Sensor xA1 Sensor xB
V1 t0(1) t1(1) t2(1) t3(1)
V2 t0(2) t1(2) t2(2) t3(2)
V3 t0(3) t1(3) t2(3) t3(3)
V4 t0(4) t1(4) t2(4) t3(4)
… … … … …
Vn t0(n) t1(n) t2(n) t3(n)
Table 2. Collected speed vehicles databases format
NA0NA1 NA1NA2 EA0EA1 EA1EA2 SA0SA1 SA1SA2 WA0WA1 WA1WA2
v1(1) v2(1) v1(1) v2(1) v1(1) v2(1) v1(1) v2(1)
v1(2) v2(2) v1(2) v2(2) v1(2) v2(2) v1(2) v2(2)
v1(3) v2(3) v1(3) v2(3) v1(3) v2(3) v1(3) v2(3)
v1(4) v2(4) v1(4) v2(4) v1(4) v2(4) v1(4) v2(4)
… … … … … … … …
v1(i) v2(i) v1(j) v2(j) v1(k) v2(k) v1(l) v2(l)
Cluster vehicle: The simulation system is able to determine the average behavior of all vehicles on the road. It accumulates the data into a database. The speed of cluster vehicle is dependent to the speed of the leading vehicle. The simulation system is designed, if the leading vehicle is violator so the cluster vehicle is violator too. The maximum number of vehicles in the cluster is 3 vehicles.
Evaluate the vehicle distance (dY(i)) from intersection at tyon: The simulation system is design to build the
databases of vehicle tracking vector as shown at Table 1 and Table 2. To evaluate the vehicle distance so it can calculate from time-stamp database in Table 1. Modify from Eq. (12), if tyon> t1(i) and tyon<t2(i), so
)) ( .( ) ( )
( 1 1
2 2 1
i t t i t i t
xA xA
dY yon
(16)
In the simulation system, the yellow time phase is set between 2s and 5s. If we set the yellow time at 2s, so Eq. (17) become,
Evaluate the vehicle speed at yellow fire (vY(i)): From Eq. (14) we can calculate the average speed of each
vehicle at the yellow turn on. As is evaluated the vehicle distance from intersection, the databases of simulation system can use evaluated vY(i). From Table 2 is shown the average of vehicle speed. So, Eq. (13) become,
))
Evaluate the acceleration ( ()
_
i
a ): To evaluate the vehicle acceleration, we use Eq. (10). As is previous discussion, we can rewrite Eq. (10) become,
)
a is positive, so the vehicle will violate the traffic light. 6. Result and Discussion
The simulation show that the system can operate up to the upper limited speed 180kmph. The system can identification all vehicles ID-tags are passed the intersection. But the average speed on model implementation is approximately 85kmph.
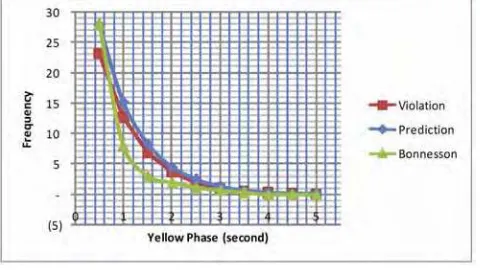
Figure 6 show the individual simulation result. The frequency of violation decrease by the yellow onset exponentially. We compare it with [3] by linear regression solution. The trends in Figure 6 indicate that the increase in yellow phase had the effect of decreasing the frequency of RLR. However, the simulation result is closer to the violation prediction than Bonnenson.
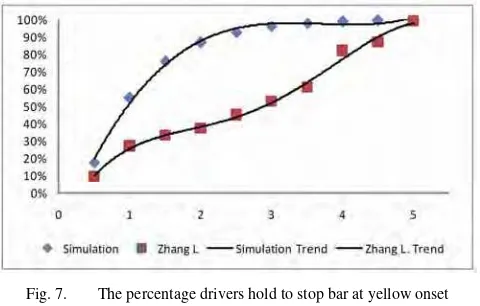
Fig. 7. The percentage drivers hold to stop bar at yellow onset
The simulation result that the average of violator is up to 82.68% from predicted RLR. If the yellow time is set at 2s, the rate of violator is 3.72% per cycle from flow traffic. The rates of violators are 1.06%, 0.31% and 0.09% per cycle at 3s, 4s and 5s of yellow on set, respectively.
Figure 7 show the percentage drivers hold to stop bar at yellow onset. We take the result. [6] to study evaluation. Zhang L. et. al. have two types of vehicle groups that are “nonfollowing” and “following” vehicles. We use “nonfollowing” vehicle group by Zhang L. data. In the figure 7 is shown that increasing the lighting of the green phase, the number of vehicles stopped before the stop line will also increase exponentially.The cluster violator is less than 20% from the predicted RLR at 2s of yellow phase. It is less than 1.9% from traffic flow. The cluster speed average is up to 38.33 kmph to reach stop line. By considering equation (18) so that vehicles do not violate traffic lights, then the distance from the vehicle stop line should not be more than 21.3 m.
Figure 8 show the vehicle distance, the average speed and the acceleration are at yellow onset. As figure 8, according equation (18) the vehicle distance to stop bar at yellow onset increase by the yellow onset increasing. This suggests that if the lighting of the yellow phase increases, the number of traffic violations decreases.
To evaluate the average of vehicle speed at yellow onset (vYon) is used equation (19). The result of the calculation of the average speed is shown in Fig. 8. Vehicle will be in violation of a traffic light when the average speed at the yellow light is less than specified as defined in Figure 8.
To get the acceleration of the vehicle shall be measured in average speed and time of detection in sensors A1 and A2. By using equations (20) and data measurements we can evaluate vehicle acceleration when the yellow light turns on. The results of calculations on each phase of the lighting of the yellow are shown in Figure 8. As in Figure 8, the acceleration needed for vehicles violate traffic lights getting smaller is proportional to the increase in yellow light phase.
Fig. 8. The distance, the speed and the acceleration are at yellow onset. 7. CONCLUSSION
The system saves valuable details in the records of the database, which can provides sample and valuable information to planners and investigators. The legal issues and privacy laws relating to the monitoring of drivers all the time may cause a major public concern. Such study would need to address subjects relating to civil rights and personal freedom issues as well as social acceptance.
In this study demonstrated the ability detects ID system, so the system can determine the detection time at each sensor is installed. The position of sensor and detection time is used to calculate the average speed, the distance from the intersection and accelerated the movement of vehicles.
The placement of the RFID reader with antenna beam coverage is limited, then this can be used to form a discrete tracking based on detection region is limited.
This research is supported by Sanata Dharma Foundation for doctoral student program. This support is gratefully acknowledged.
REFERENCES
[1] Anonimous (2010), DATA PELANGGARAN LALU LINTAS SEBELUM DAN SELAMA " OPERASI PATUH JAYA " – 4 Agustus 2010, http://www.komisikepolisianindonesia.com, on September 6th, 2012.
[2] Nason, N. R. (2005), TRAFFIC SAFETY FACTS 2005-A Compilation of Motor Vehicle Crash Data from the Fatality Analysis Reporting System and the General Estimates System, National Highway Traffic Safety Administration, National Center for Statistics and Analysis, U.S. Department of Transportation, Washington, DC 20590, http://www-nrd.nhtsa.dot.gov/Pubs/TSF2005.PDF, 2005, on September 6th, 2012.
[3] Bonnenson, J.A. ; Zimmerman, K.H. (2003), Effect of Yellow Interval Timing on Red-Light Violation Frequency at Urban Intersections, Texas Transportation Institute, The Texas A&M University System, 3135 TAMU, College Station, TX 77843-3135. [4] Maile, M.; Delgrossi, L. (2009), Cooperative Intersection Collision Avoidance System for Violations (CICAS-V) for Avoidance of
Violation-Based Intersection Crashes, Paper Number 09-0118, http://www.engin.umd.umich.edu/EPD/data/userfiles/ACVT/CICAS-V%2009-0118.pdf.
[5] Lee, S.E. et. al. (2007), Task 5 of the Intersection Collision Avoidance - Violation Project: Final, United State Department of Transportation, NHTSA, DOT HS 810 749, http://www.nhtsa.gov/DOT/NHTSA/.../Crash%20Avoidance/.../810749.pdf , April 2007 [6] Zhang, L.; Zhou, K.; Zhang W.; Misener, J.A. (2009), Prediction of Red Light Running Based on Statistics of Discrete Point Sensors,
Journal of the Transportation Research Board, Volume 2128 / 2009, pp. 132-142, DOI: 10.3141/2128-14, Published by Transportation Research Board of the National Academies.
[7] Liu, Y.; Chang, G.L.; Tao, R.; Hicks, T.; Tabacek, E. (2007), Empirical Observations of Dynamic Dilemma Zones at Signalized Intersections, Journal of the Transportation Research Board, Volume 2035 / 2007, pp. 122-133, DOI: 10.3141/2035-14, Published by Transportation Research Board of the National Academies.
[8] Zhang, L.; Wang, L.; Zhou, K.; Zhang, W. (2012), Dynamic All-Red Extension at a Signalized Intersection: A Framework of Probabilistic Modeling and Performance Evaluation, IEEE Transaction Intelligent Transportation System, Vol. 13, pp. 166 – 179. [9] Porter, B.E.; England, K.J., (2000), Predicting Red-Light Running Behavior: A Traffic Safety Study in Three Urban Settings, Journal
of Safety Research, Vol. 31, No. 1, pp. 1–8, 2000, PII S0022-4375(99)00024-9.
[10] Hill, S.E.; Lindly, J.K. (2003), Red light running prediction and analysis, UTCA Report No. 02112. University Transportation Center for Alabama, Tuscaloosa, AL.
[11] Ravikumar, P. (2010), Traffic Enforcement Through Red-light Violation Detection System, http://www.intranse.in/its1/sites/default/ files/13-RLVD-Ravikumar.pdf, on December 22nd, 2012.
[12] Zennaro, M.; Misener, J.A.A. (2003), State Map’ Architecture for Safe Intelligent Intersections, Proceedings of ITS America 13th Annual Meeting, ITS America.
[13] Bonneson, J.A.; Zimmeman, K.; Bewwer, M. (2002), Engineering Countermeasures to Reduce Red-Light Running, Federal Highway Administration, U.S. Department of Transporation, August 2002, http://d2dtl5nnlpfr0r.cloudfront.net/tti.tamu.edu/documents/4027-2.pdf, December 12, 2012.
[14] Hong-bo, Q.; Yu-pu, D. (2010), Engineering countermeasures to reducing red-light running, Proceeding of 2009 IITA International Conference on Control, Automation and Systems Engineering, pp. 342 – 344, DOI: 10.1109/CASE.2009.22.
[15] Chen, Y.; Yang, C. (2010), Vehicle red-light violation detection base on region, Proceeding of 2010 3rd IEEE International Conference on Computer Science and Information Technology (ICCSIT), Vol. 9, pp. 700 – 703, DOI: 10.1109/ICCSIT.2010.5565080. [16] Iswanjono; Budiarjo, B.; Ramli, K. (2010), Simulation for RFID-Based Red Light Violation Detection: Violation Detection and Flow Prediction, Proceeding of Int. Conf. 2nd Int. Conf Computer Research and Development, May 5-7, 2010, Kuala Lumpur – Malaysia, pp. 742-747.
[17] Jiang, W.; Yu, D.; Ma, Y. (2006), A Tracking Algorithm in RFID Reader Network, Proceedings of the Japan-China Joint Workshop on Frontier of Computer Science and Technology (FCST'06), 0-7695-2721-3/06, IEEE Computer Society.
[18] Liu, C.; Herman, K. (1996), A Review of The Yellow Interval Dilemma, Transportation Research Part A: Policy and Practice, Vol. 30, Issue 5, September 1996, Pages 333–348.
[19] Want, R. (2004), Enabling Ubiquitous Sensing with RFID, Journal Computer Volume 37 Issue 4, April 2004 Page 84-86, IEEE Computer Society Press Los Alamitos, CA, USA, DOI : 10.1109/MC.2004.1297315.
[20] Albagul, A.; Hrairi, H.; Wahyudi; Hidayathullah, M.F. (2009), Design and Development of Sensor Based Traffic Light System, America Journal Applied Science, Vol. 3: pp. 1745-1749, 2009.
[21] Tseng, S.T.; Song, K.T. (2002), Real-Time Image Tracking for Traffic Monitoring, Proceeding of the 5th International Conference on Intelligent Transportation Systems, Sep. 3-6, IEEE Explore Publishing, USA., pp: 1-6. DOI: 10.1109/ITSC.2002.104117. [22] Rabie, T.; Shalaby, A.; Adbulhai, B.; Rabbany, A.E. (2002), Mobile Vision-based Vehicle Tracking and Traffic control, Proceeding
of the 5th International Conference on Intelligent Transportation Systems, Sep. 3-6, IEEE Explore Publishing, USA, pp: 13-18. DOI: 10.1109/ITSC.2002.1041181.
Bibliographic:
Iswanjono -nicknamed iswan- received his Degree of undergraduate in Electrical
Bagio Budiardjo received his Degree of undergraduate in Electrical Engineering from the Faculty of Engineering, Indonesia University in 1972. He received his Master of Science from Ohio State University in 1980. He received his PhD Degree from the Faculty of Engineering, Indonesia University in 2002. Currently, he is Professor at Indonesia University. He teaches Computer Architecture, Operating Systems Broadband Networks, Corporate Networks, and Communication Techniques. He is members of research team on CICER (Center for Information Communication Engineering Research), Faculty of Engineering, Indonesia University. His e-mail address is [email protected]