Simulation for RFID-Based Red Light Violation Detection:
Violation Detection and Flow Prediction
Iswanjono
The Doctorate Student of the Department of Electrical
Engineering
Faculty of Engineering, University of Indonesia
Jakarta, Indonesia [email protected]; [email protected]
Bagio Budiardjo
Department of ElectricalEngineering
Faculty of Engineering, University of Indonesia
Jakarta, Indonesia [email protected]
Kalamullah Ramli
Department of ElectricalEngineering
Faculty of Engineering, University of Indonesia
Jakarta, Indonesia [email protected]
Abstract—The Scilab is freeware as launched by INRIA and ENPC. This paper explains the experience result of the simulation by Scilab to simulate RFID-based for red light violation detection. This simulation gives evidence of violation and prediction of vehicle flow. The violation can detect if the vehicle's IDs have moved form one RFID Reader to the others. The flow prediction is executed by channel forward as distance form the RFID Reader. A randomization generates vehicle IDs, vehicle numbers and vehicle branch destination that can show the function of RFID reader to detect tags.
Keywords: Scilab, RFID, Red light violation, Flow prediction.
I. INTRODUCTION
Radio Frequency Identification (RFID) technology shows a continuous growth in various application fields, like commerce, logistics, medical science, security, access control etc. The RFID system is three components: tag, reader and database. The access control, specifically, is detection IDs entry to or exit from the range area of the RFID reader antenna radiation [1], [2].
Developed at INRIA, Scilab has been developed for system control and signal processing applications. It is freely distributed in source code format. Scilab is made of three distinct parts: an interpreter, libraries of functions (Scilab procedures) and libraries of Fortran and C routines. These routines (which, strictly speaking, do not belong to Scilab but are interactively called by the interpreter) are of independent interest and most of them are available through Netlib. A few of them have been slightly modified for better compatibility with Scilab’s interpreter [3].
The general philosophy of Scilab is to provide the following sort of computing environment [3]:
x To have data types which are varied and flexible with syntax which is natural and easy to use.
x To provide a reasonable set of primitives which serve as a basis for a wide variety of calculations.
x To have an open programming environment where new primitives are easily added. A useful tool distributed with Scilab is intersci which is a tool for building
interface programs to add new primitives i.e. to add new modules of Fortran or C code into Scilab.
x To support library development through “toolboxes” of
functions devoted to specific applications (linear control, signal processing, network analysis, non-linear control, etc).
Using Scilab, we develop the tracking algorithm to make the simulation for RFID-based red light violation detection. In this simulation, we assume that the maximum vehicle entry into standing in line under the traffic light is four vehicles. The road has four branches that are North, East, South and West respectively.
The previous papers [5], [8] have explained the red light violation detection by using a video or a camera and combine a digital camera and a sensor of magnetic flux . By video or camera is resulted video detect up to 50% of the capturing rate on day time and up to 45% of the capturing rate on night time. By combine a digital camera and a magnetic flux is resulted coil detect fewer than 95% of the capturing rate on day time and fewer than 90% of the capturing rate on night day [8]. They detect red running with the license plate number. The license plate number recognition method is worked on single vehicle only and limit speed up to 10 km/h [6], [8]. We propose the red light detection violation using by the RFID technology. By the RFID technology, we can detect some vehicle identity simultaneously, and speed up to 60 km/h.
By the tracking algorithm, we can know tags movement from one RFID reader to the others. The reader detects and identifies the identity (ID) tags that is filled the information of vehicle like license number, then compares them with IDs record have read by the reader outside it. We use double passage access control method to detect vehicle entry to the range of RFID readers. Therefore, we use eight readers in our design model. The algorithm has been written on the
Second International Conference on Computer Research and Development
11th International Conference on QIR, 2009, Indonesia
[9].
II. TRACKING METHOD FOR OBJECT MOVEMENT
A. Principle of VRT Algorithm [10]
The theoretical basis of virtual route tracking (VRT) algorithm is that the interrogation range of RFID system is very short compared to the distance between readers. Instead of powering the RFID tag directly by battery, it gets power through magnetic, electric and electromagnetic coupling with RFID readers. RFID tags are grouped into two categories: Passive and Active. The range of RFID system is very small, varied from a few millimeters to several meters.
On the contrast, the range of wireless technology used to connect RFID readers is large. It can connect two readers within 10 meters, and Bluetooth or Wi-Fi is effective at the distance of 100 meters. Therefore, when a tag is sensed by a reader, i.e., the tag is located in the interrogation zone of this reader; the real distance between reader and tag is less than the range of the RFID system. So we use the position of the corresponding reader to stand for the current position of tag. When the scale of the RFID Reader Network is large enough and the distance of deployed readers is relatively long, VRT algorithm is very accurate.
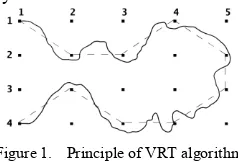
Figure 1. Principle of VRT algorithm
In Figure 1, the black point stands for a RFID reader and the matrix is a RFID Reader Network. As Figure 1 depicted, when a tag moves from reader (1, 1) to reader (2, 2), the straight line between them is regarded as the track of the tag by us. Therefore, when moving along the thick curve in the figure, which denotes the real path of a person or object in the RFID Network, the tag is interrogated by readers along the path. And the virtual line (coined Virtual Route) is defined as the track of the tag. So the track in Figure 1 is: Track = Virtual Route = (1,1)Æ(2,2)Æ(2,3)Æ(1,4)Æ(2,5)
Æ(3,5)Æ(4,4)Æ(4,3)Æ(3,2)Æ(4,1) It is noted that, when a reader interrogates one tag, the next reader interrogating it along the track MUST be adjacent to the previous reader. In Figure 1, it is obvious that the tag at (2, 3) cannot jump to (2, 5) directly without activating reader (1, 4), (2, 4) or (3, 4). Hence, the next reader of (2, 3) along the track MUST be one of following readers:
{(1,2), (1,3), (1,4), (2,2), (2,4), (3,2), (3,3), (3,4)}
Therefore, VRT algorithm MUST choose adjacent readers along the track. If two successive readers along the track are not adjacent to each other, special mechanism will be executed to guarantee that each reader along the track is contiguous to its last and next reader in real-word position. The virtual line connecting readers in Fig. 1 looks like a Route transferring data packets along the nodes. Due to this
route is not real we name it “Virtual Route”. In VRT algorithm, we use “Virtual Route” to stand for track of tag in the RFID Reader Network. And that is why this algorithm is coined Virtual Route Tracking (VRT).
Of course, real-world RFID Reader Network is impossible to place readers so regular (exactly like a Matrix), and Figure 1 here only depicts fundamental of this algorithm theoretically.
B. Definition of Tracking Vector
More important, the concept of Tracking Vector (TV) is proposed here. Tracking vector plays a key role in collecting tracking information and calculating the track. We define the combination of the tag identity, the interrogation time and the identifier of reader as Tracking Vector. The structure of TV is:
<Ti, tj, Rk> = < Tag i, timestamp j, Reader k >
Here, the tag identity is a global unique number stored in the electronic chip of each tag and interrogated by reader. VRT algorithm can simultaneously track tens, even hundreds of tags tagged on objects or persons within a single network by classifying different tags according to the unique identity in each Tracking Vector.
Timestamp is the interrogation time of RFID reader when the tag entering its interrogation zone. We assume that all RFID readers in RFID Reader Network are synchronous. And only one tracking vector is generated no matter how long a tag stays within the interrogation zone of one reader.
The third parameter in tracking vector is the identifier of the reader. VRT algorithm uses the position of readers to track tags. It is noted that successive selected readers are all adjacent to each other and therefore can form a Virtual Route, therefore, reader identifiers of two successive Tracking vectors MUST stand for two contiguous readers in real network.
C. Two Special Conditions
As Figure 2 shows, when one tag moves along path a, three tracking vectors containing the same reader identifier are generated by reader R1. At this time, VRT algorithm only
chooses the first vector and deletes others.
^
, ,`
,( ) ,,
, , ,
,
3 2 1 1 1 1
3
1 2 1
1
t t t R t T R
t T
R t T R t T
x x
x
x !
¿ ¾ ½ ¯
®
!
!
!
Figure 2. Two special paths
Suppose the tag alternates between two readers, e.g., R2
and R3in Figure 2, only the first two or three tracking vectors
should be remained. The method is specified as follows.
3
For example, according to the above method, the tracking vectors of path b in Figure 2 are processed as:
III. RESEARCH METHOD
A. Model Design
Figure 3 is shown diagram block of the research design. The system constrains traffic light controller (TLC), microcontroller for control management system, RFID readers, RFID tags, and personal computer (PC) for database system.
Figure 3. Block diagram of the research design.
The architecture of the research method of the RFID-based red light violation detection is shown at Figure 4. The crossroad is quarter section. The RFID readers make an adjacent network at the each left and right sides of the crossroad to monitor RFID tags movement. We assume that the range of antenna radiation of the RFID Reader up to 20 meters. The reader at left side is used to detect incoming vehicles to intersection and the reader at right side to detect out going vehicles from intersection. The total number of reader is eight. The vehicle can move to left, right or go straight. The maximum of vehicle detection per scanning is 12 vehicles; there are four vehicles, respectively.
EA
Figure 4. The architecture of the RFID-based red light violation detection
B. Algorithm Detail
The previous papers have been proposed in development of algorithm, for examples are Design of Traffic Light Control Systems Using Statecharts [12], Road Data Input System using Digital Map in Roadtraffic Simulation [12] and The Vehicle Junction Model and its Verification in Traffic Simulation [12].
The speed of vehicle pass on crossroad is low until medium speed. In this algorithm, we take the vehicle speed up to 60 km/h. If a range of antenna radiation of RFID readers are 20 meters and the minimum length of vehicle is 5 meters, so we result 4 cars per sampling per channel or the total vehicle is twelve cars. In this case, if the vehicle speed is up to 60 km/h, for pass on the reader range interrogation take time 1200ms. Therefore, we take the time sampling is 1s (Ts = 1s).
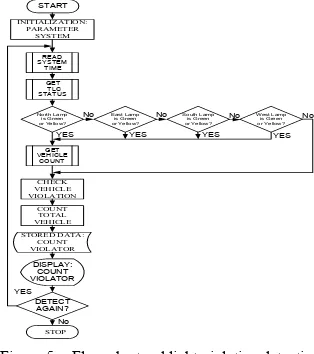
The algorithm for our simulation can you show on Figure 5. In this simulation, we focus on violation detection and flow prediction.
START
YES YES YES YES
Figure 5. Flow chart red light violation detection
By the model and the algorithm above, we build programming simulation using Scilab. Scilab is freeware developed by INRIA and ENPC for system control and signal processing applications.
The real-time method was made to present the time sampling one second. The date and clock is got from the PC time system. By executed the simulation program can show number of vehicle on each periodic time sampling and detect violation. At the end of the traffic light cycles are displayed the vehicle IDs ant its time of violator and the traffic flow prediction.
IV. RESULT
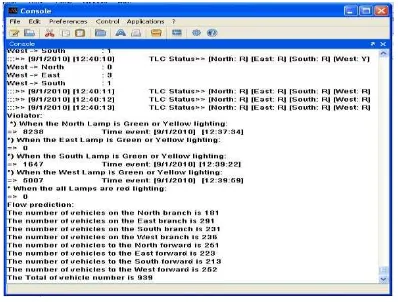
Figure 6. The displying of simulation program execution
The Traffic Light Controller (TLC) is operated with fix system, but it adjusts some periodic lamp lightings, these are for 00:00 – 03:59am, 04:00 – 05:59am, 06.00 – 10:59am, 11:00am – 01:59pm, 02:00 – 07:59pm, and 08:00pm –
00:00am. The average of vehicle counts in each periodic show on TABLE I.
TABLE I. THE AVERAGE OF VEHICLE COUNTS
Periodic Time Branch of Road
North East South West
00:00 – 04:00 123 117 123 132
04:00 – 06:00 91 117 129 108
06:00 – 11:00 283 322 319 296
11:00 – 14:00 237 229 212 224
14:00 – 19:00 302 315 331 295
19:00 – 00:00 251 239 221 222
We generate uniform random numbers for ID symbolizations are detected by RFID readers. The quantity of number generating dependents to the capacity of vehicle queuing. Because the maximum range of RFID reader is twenty meters, and the minimum length of car is five meters, so the maximum capacity of vehicle queuing is twelve cars or four cars per channels.
The simulation presents a quantity of cars passed crossroad to turn right, turn left or go to straight. We assume that vehicle velocity passes intersection road up to 60 km/h. A quantity car is random by first row of the vector permutation of twelve numbers that are 1 till 12. The instruction are:
Gen_Number_ID = [1:12]'; // Vector Gen Number ID
NumberID = grand(1,'prm',Gen_Number_ID); // generate permutation random as single column
Number_ID = NumberID(1); // Take first row
For example, we take the result program execution on January 8, 2010 as below:
:::>> [8/1/2010] [14:13:58] TLC Status>> [North: R] [East: R] [South: R] [West: G]
West -> North : 1 West -> East : 4 West -> South : 3
And the flow prediction is:
Flow prediction:
The number of vehicles on the North branch is 328 The number of vehicles on the East branch is 304 The number of vehicles on the South branch is 227 The number of vehicles on the West branch is 352 The number of vehicles to the North forward is 305 The number of vehicles to the East forward is 297 The number of vehicles to the South forward is 319 The number of vehicles to the West forward is 290 The Total of vehicle number is 1211
Figure 7 show graph of vehicles number on traffic flow is taken on January 10, 2010 beginning at 0:6:59.
Traffic Flow Pre diction
0 20 40 60 80 100 120 140 160 180
1 2 3 4 5 6 7 8 9 10 11 12 13 14 15 16 17 18 19 20
Sampling
V
e
hic
le
N
um
be
rs
North In North Out East In East Out South In South Out West In West Out
Figure 7. The result of simulation traffic flow
The simulation also presents violation detection. The vehicles is detected as violation if at the red lamp is turn on they move from incoming reader to outgoing reader. In this simulation, the vehicles IDs are produced by randomization generation. The vehicle is detected as violator if its ID is generated on reader A and next time, at other road branch it is generated on reader B. For system simplification, we use 10,000 ID number and we divide to four group; that are 0 to 2499 (for North branch), 2500 to 4999 (for East branch), 5000 – 7499 (for South branch) and 7500 – 9999 (for West branch). Next, the result of simulation execution shows as below:
Violator:
*) When the North Lamp is Green or Yellow lighting: => 0
*) When the East Lamp is Green or Yellow lighting: => 0
*) When the South Lamp is Green or Yellow lighting: => 1999 Time event: [8/1/2010] [5:24:26] *) When the West Lamp is Green or Yellow lighting:
=> 4953 Time event: [8/1/2010] [5:24:48]
*) When the all Lamps are red lighting:
=> 445 Time event: [8/1/2010] [5:23:55]
At January 8, 2010 on 5:24:26, the ID 1999 is North source is detected red running when the green or yellow South lamp is turn on. On 5:24:48, the ID East 4953 is violation when the West lamp is green or yellow light. And on 5:23:55, the North ID 445 is detected red light violation when the all red lamps are turn on.
V. CONCLUSION
The simulation can present violation detection and flow prediction. The randomize generating of the vehicles IDs is
used to change RFID tags functionally. On future work, the tracking algorithm on this simulation can be implemented to the RFID-based red light violation detection, and we can predict the vehicle speed to passing out the crossroad. Also, in future work, by the traffic flow prediction, we will develop the traffic control system network.
ACKNOWLEDGMENT
This paper was supported by Sanata Dharma University. And the research work in this paper was also sponsored by the post-graduate budget program of Sanata Dharma Foundation.
REFERENCES
[1] Http://www.intermec.com, "RFID Overview: Introduction to Radio Frequency Identification", access date November 18, 2008.
[2] Http://www.paxar.com/, “RFID Basics”, access date November 18, 2008.
[3] Scilab Group, "Introduction to Scilab",
http://www-rocq.inria.fr/scilab, access date June 15, 2009.
[4] E. George. G. E. Frangos., “Digital-Based Red Light Running
Detection A Building Block Technology for ITS”, http://www.roadtrafffic-technology.com/contrator/detection/noptel/ noptel.pdf, access date Dec. 11, 2008.
[5] Http://www.superrfid.net/english/index/, “Automatic vehicle
identification (AVI) and city traffic management system”, access date May 23, 2008.
[6] S. L. Chang, L. S. Chen, Y. C. Chung, and S. W. Chen, “Automatic License Plate Recognition”, IEEE Transaction on Intelligent Transportation Systems, Vol. 5, No. 1, March 2004, IEEE, 2004. [7] K. V. Suresh, G. M. Kumar, and A. N. Rajagopalan, “Superresolution
of License Plates in Real Traffic Videos”, IEEE Transaction on Intelligent Tranportation Systems, Vol. 8, No. 2, June 2007., IEEE, 2007.
[8] Iswanjono, B. Budiarjo, and K. Ramli, "Algorithm for RFID-Based Red Light Violation Detection", Proc. The 11th International Conference on QiR (Quality in Research), Faculty of Engineering,
University of Indonesia, August 3-6, 2009, pp. 22-27, ISSN: 114-1284/A1-S1-4.
[9] W. Jiang, D. Yu, and Y. Ma, ”A Tracking Algorithm in RFID Reader Network”, Proceeding of the Japan-China Joint Workshop on Frontier of Computer Science and Technology (FCST’06), IEEE, 2006.
[10] Y. S. Huang, “Design of Traffic Light Control Systems Using
Statecharts”, The Computer Journal, Vol. 49 No. 6, 2006, Published by Oxford University Press on behalf of The British Computer Society, 2006.
[11] M. Namekawa, N. Aoyagi, Y. Ueda, and A. Satoh, "Road Data Input System using Digital Map in Roadtraffic Simulation", http://mssanz.org.au/modsim07/papers/55_s53/RoadDatas53_Namek awa.pdf, access date May 20, 2009.
[12] M. Namekawa, F. Ueda, Y. Hioki, Y. Ueda, and A. Satoh, "The Vehicle Junction Model and its Verification in Traffic Simulation", Proc. The 2nd International Conference on Asian Simulation and Modeling 2007, (ASIMMOD2007), Chiang Mai, Thailand.
COPYRIGHT
All papers submitted must be original, unpublished work not under consideration for publication elsewhere. Authors are responsible to obtain all necessary permission for the reproduction of tables, figures and images and must be appropriately acknowledged. The paper is not defamatory; and the paper does not infringe any other rights of any third party.
The authors agree that the Technical Committee’s decision on whether to publish the paper in the Conference’s
proceedings shall be final. The authors should not treat any communication from the Technical Committee members who reviewed their work as an undertaking to publish the paper.