Abstract— The hydrocarbon source rock potential to determine of petroleum system in Majalengka sub-basin was evaluated using Rock-Eval pyrolysis. Most of samples were taken in the middle to late Miocene of sediment turbidite, which well exposed along this basin. Result of analysis indicated that the hydrocarbon occurrence tend to built as gas prone dominated by kerogen type III in imamature to mature values. Thermal maturity increased parallel to succession of lithologic units, from lower to upper, due to the increasing of magmatic activity in this basin. The overall hydrocarbon source potential of Majalengka sub-basin is moderately low; the good accumulation of hydrocarbon probably exists locally within adjancent area. The reservoir type in this basin is massive sandstone, which forms channel-like bodies. Stratigraphic and structural trappings are two types of trapping mechanism. Furthermore, those of elements (source-rocks potential, reservoir, seals) form the petroleum system in Majalengka sub-basin. The petroleum system in this area is interpreted related to subduction mechanism during the middle to late Miocene and occurred at intra-arc (back-intra-arc) basin.
Keywords—Petroleum system, Kerogen type III, Rock-Eval pyrolysis, sediment turbidite
I. INTRODUCTION
HE geology of the Majalengka sub-basin has been studied by many researchers since the last decades of the 19th century.The results of their studies were summarized and well documented by [1]. This basin is located at middle part of West Java and belongs to the Bogor trough. The comprehensive study related to the evolution of the West Java has conducted by [10] in 1984. He mentioned that the Bogor trough as the sedimentary basin was dominated by turbidite facies. Two main events affecting on this basin were magmatic and thrust-fault belt. Several researcher such as [5],[9],[4],[15],[2] have studied the turbidite facies of the basin especially on depositional process, provenance, tectonic and possibility for the hydrocarbon occurrence.
Budi Muljana is with the Department of Earth Resources Engineering, Faculty of Engineering, Kyushu University, Fukuoka, Japan. (Corresponding author to provide phone:+81-80-3904-0343; e-mail address: [email protected], [email protected].
Koichiro Watanabe is with the Department of Earth Resources Engineering, Faculty of Engineering, Kyushu University, Fukuoka, Japan (e-mail address: [email protected]).
Mega Fatimah Rosana is with the Department of Geology, Padjadjaran University, Indonesia (email address:[email protected]).
Hydrocarbon-exploration has been conducted in Java a few years ago. In 1871two Dutch i.e. Jan Reering and van Hoevel were carried out the first well-exploration in eastern part of Majalengka sub-basin. Oil-seepages discovery on fracture zone in this area was used as assumption that the hydrocarbon accumulation is occurred. Even though the well was considered unfavorable economically; nevertheless, it’s considered as first well-oil discovery in Indonesia. Therefore, the Maja-name was used as a well-name (Maja # 1) and regarded as the starting-point of oil-industry in Indonesia.
This paper will defined the petroleum system in Majalengka sub-basin, as an intra-arc (back-arc) basin in West Java. It focused on the characteristics of source rocks, reservoir facies type, and trapping mechanism or the petroleum system in this basin. Figure 1 show location of study in middle part of West Java.
II.GEOLOGY FRAMEWORK
In 1949 [1] divided the West Java into four physiography units (Figure 2): (a) the Coastal Plain of Jakarta; (b) the Bogor zone; (c) the Bandung zone; and (d) the Southern Mountain. This zonation reflects both the regional structures of the region and stratigraphy of West Java. The Coastal Plain of Jakarta extends west to east. The plain is represented of onshore part of the Northwest Java basin [13]. The Tertiary sedimentary rocks in this region is gently folded and covered by alluvial and lahar from Quarternary volcanic. This area is one of prolific zone for hydrocarbon accumulation in West Java.
Fig. 1 Study area located at West Java, Indonesia
PETROLEUM SYSTEM
IN BACK ARC BASIN
MAJALENGKA SUB-BASIN INDONESIA
Budi Muljana, Koichiro Watanabe and Mega Fatimah Rosana
The Bogor and Bandung zone are situated in the interior of West Java. Both of them, respectively, represent the shelf edge and the deepest part of the Bogor trough.
Fig.2 Physiographic map of West Java [1]
The Bogor trough is filled by Tertiary sediment turbidite which is tightly folded and thrusted northward onto the shelf sediments [10], [9].
In the Bandung zone, the Tertiary sediment strata are mostly covered by Quarternary volcaniclastic, alluvial, and lake deposits.
The Southern Mountain is composed of Jampang Formation, a succession of breccias and volcanogenic sandstones in andesitic composition and forms volcanic hills in the southern part of West Java extending west to east [10].
The study area (Majalengka sub-basin) is located at western part of the Bogor trough. This basin is arranged by five lithologic units, from bottom to top, i.e. Cisaar, Cinambo, Cantayan (two members: Halang and Bantarujeg Formatios) and Subang-Kaliwangu Formations. Cisaar and Cinambo Formations are objective for source rocks and reservoir, while Subang Formation is considered as a seal layers.
III. METHODOLOGY
This paper combines the field investigation with laboratory analysis of organic matter for determination hydrogen potential. Combination of two results was arranged to assessment of petroleum system in this basin.
Forty-five samples of sediment turbidite were collected for source analysis. This sediment was good exposure along the Majalengka sub-basin. The sample type was characterized by shale in dark color and high carbonaceous. The samples were analyzed by using Rock-Eval Analysis and Vitrinite Reflectance methods at Geochemical Laboratory, Institute Technology Bandung, Indonesia. The result of analyzed is summarized in Table 1.
The determinations of reservoirs and seals type were conducted field investigation in this basin. This investigation
determined that the reservoir candidate is massive sandstone, whereas the seals type is shale, which well-distributed.
IV. RESULT
A.Characteristic of Source Rocks
Organic matter in sedimentary rocks is a component of sedimentary material indicating the possibility of hydrocarbon occurrence even if it is present in very low content. Three parameters are used to determinate and evaluate of organic matter in this study i.e. source generative potential, organic matter type, and level organic maturation by using total organic carbon content (TOC), Rock-Eval Pyrolysis, and Vitrinite Reflectance (VR) analyses.
Source samples are taken from two intervals layer i.e. Cisaar-shale and lower Cinambo Formation (Figure 8b). The source samples belong to Facies E [12].
Table 1 is results of Rock-Eval Pyrolysis and Vitrinite Reflectance in study area.
B.Source rock generative potential
Results of analysis show that the TOC values varies from 0.18 wt. % to 1.6 wt % with the average of approximately 0.73 wt. %.
Fig.3 A crossplot showing only one population of source rocks.
A minimum acceptable TOC value for potential source rock is 0.5 wt. %, and less than this value is considered to be insignificant for hydrocarbon source potential. The marginal value of the hydrocarbon source potential is around 0.5 wt. % and 1.0 wt. %, whereas more than 1.0 wt. % reflects substantial of source potential. Meanwhile, a TOC value above 2.0 wt. % indicates excellent source potential.
Fig.4 (a) Percentage of distribution of Total Organic Carbon (TOC), and (b) Pyrolysis S2 yields all of samples are below 2.5 mg HC/gr rock) almost 77.78%, while 22.22% sample population is fair.
The increased of TOC value indicates that the highly reducing environment occurred. The average TOC value between 1 to 2 wt. % values demonstrates the depositional environment where oxidizing and reducing process is simultaneous.
The quantity variation of TOC value is 22.2% for poor quantity (0-0.5 wt. %), 55.6 % for fair quantity (0.5-1.0 wt. %), and 22.2 % for good quantity (1.0-2.0 wt. %). None of samples belongs to very good quantity. The poor value samples were taken from Ciheum and Cijurey river, which belongs to Cicantayan Formation (Halang and Bantarujeg Formation). Meanwhile, the good quantity samples were taken from the western-part Cimaningtin village, which is concentrated in an isolated depression zone. It belongs to shale facies of lower-part Cinambo Formation (Figure 4a).
In the source rocks evaluation, the total organic carbon (TOC) content does not merely focus on the amount of organic matter even though it is necessary. For example, one region with high total organic carbon (TOC) content occasionally had slight oil-source potential, because it depends on kerogen type. Woody-rich or highly oxidized organic matter can be a poor-source for oil-generation. Nevertheless, the TOC content can be used as a screening method for determining the interest area for next-steps exploration. The 22.2% for good value of TOC contents indicate that hydrogen potential in this area is quiet good.
Furthermore, the second parameter is S1 and S2 that each indicates the differences of peak temperature during pyrolysis analysis. The S1 as a first-peak at pyrolysis temperature up to about 300oC and the zone below this temperature is related to the amount of free hydrocarbon in rock (mg HC/gram rock) soluble organic matter in source rock. Meanwhile, the S2 is the second peak and showns the amount of hydrocarbon formed by breakdown of kerogen (mg HC/gram rock) or amount of hydrogen-rich in source rock. This value also presents information about Tmax parameter, a temperature
maximum reached in pyrolisis analysis (in the oven). This temperature value (Tmax) can be equated as an indicator for maturity level, which is higher than hydrocarbon generation in nature. The real temperature in the natural environment for hydrocarbon generation is 80-165oC for oil-generated and 145-220oC for gas-generated [3]. Increasing temperature in this basin probably is derived from magmatic activity, which the increase in stratigraphic intervals [21].
A crossplot between TOC versus S2 indicate that samples are distributed to form linear-line from poor to good value in TOC content, but most of samples fall in poor area for S2 parameter.
Results of analysis show the average value of S1 is very low, only 6.67%, close to fair quantity. The value is around 0 to 0.5 mg HC/gr rock, and the average is 0.09 mg HC/ gr rock. The other parameter S2 shows similar result where all of samples fall below 2.5 mg HC/gr rock, and almost 77.78% is below 1mg HC/gr rock. The average value is 0.47 mg HC/gr rock, whereas the range value is 0 to 1.71 mg HC/gr rock. Both of parameters belong to poor quantity. Detail distribution can be showed in figure 4b.
C.Type of organic matter
To determination of organic matter type are used two parameters i.e. the diagram of HI and S2/S3 ratio. HI(Hydrogen Index) value is obtained from the equation of (S2/TOC) 100 to represent the total amount of hydrocarbon independently, which is closely related to elemental composition in kerogen. Meanwhile, the S2/S3 ratio demonstrates the kerogen type related to the producing of hydrocarbon generation as gas.
the S2/S3 ratio whereas only 71.43 % samples can be generated as gas, 23.08 % mix and 7.14 % as oil-prone.
Fig.5. van Krevelen diagram Oxigen Index (OI) against Hydrogen Index (HI), showing the hydrogen generative type, and most samples
plot in the Type III (gas prone).
The other parameter is OI (Oxygen Index), a comparison value of (S3/TOC) 100. It show the amount of CO2 produced from kerogen during Rock-eval pyrolysis. The Oxygen Index is measured as mg CO2/g TOC and is supposed to be related to the oxygen content of the kerogen [19]. Meanwhile, the S3 is the third-peak in pyrolisis analysis which indicates mg CO2/gram rock [7]. Strong correlation between HI and OI ratio represented by the modification of van Krevelan is used to diagram to describe the correlation between maturation stages and kerogen type [7].
The van Krevelan diagram most samples plot on kerogen type III as an indication that the hydrogen content is sufficient amount to generate gas-prone but is not enough to be oil-prone (Fig.5).
The kerogen type III is dominated by vitrinite formed commonly from land plant wood, and produced on a coal-forming environment at the transition zone such as paralic swamps and abandoned river channels. This type is normally deposited in deltaic to shallow marine, the occurrence in deep marine deposits due to resedimentation of previous sediment through to channelized systems.
Furthermore, based on these diagrams they can be grouped into four sample population categories i.e. (1)very low OI and low HI around 64.44%, (2) low OI and low HI of around 15.56%, (3) high OI and very low HI around 8.89%, and high OI and low HI around 11.11%. Point 1 and 2 indicate that the organic matter source is obtained from land-derived and dominated by mature source rock, whereas point 3 and 4 are represent as gas-prone organic matter, which generally forms as an immature-source. Finally, the three parameters above have a good agreement that all of samples tend to generate as a gas-prone.
The type of kerogen is mainly vitrinite (51.85%), while 40.74% consist of Alginite, Amorphous, and Exinite. Around
7.41% samples belongs to Inertinite (Tissot and Welte, 1978). Furthermore, the higher concentrations of gas-prone vitrinite are around 70.37% from total samples, some of samples showed the good quality. This sample was taken from western-part of Cimaningtin village, and based on lithostratigraphic units belongs to Cinambo Formation. Approximately 18.52% the kerogen is generated to oil, which is dominated by Alginite, Amorphous and Exinite types. Meanwhile, 7.41% samples become wet-gas, and only one sample (3.70%), which took from Cisaar (crs 333), are barren (fig.6).
D.Level of thermal maturation
The organic maturation can generate to be oil and gas depending on kerogen type in the source rocks [6] and [18]. To determine the organic maturation in sample three parameters are used i.e. Tmax (oC), production index (PI) and vitrinite reflectance (VR). For example, Tmax (oC) is believed to be a good maturation index for kerogen type II and type III, but not recommended for kerogen type I [19]. It is caused by the range Tmax (oC) variation in kerogen Type I is narrower than kerogen type II and type III. The Tmax (oC) value of the oil threshold (for types II and III range in between 430 to 435oC) is lower than the gas threshold (type II approximately 430 to 455oC, whereas type III is 465 to 470oC). In the present study, the samples value of the Tmax (oC) range in between 421 to 486 oC indicating that mixing oil to gas generation has occurred.
Tmax value in figure 7b shows that there are three levels of maturation index. Postmature levels reflect samples from Cinambo and Cimaningtin, similar with mature levels. Immature level describes distribution samples from the upper part of sediment turbidite.
Fig.6. Samples distribution of visual kerogen analyses and most samples fall in dry-gas, almost up 70%.
Production index (PI) represented by S1/ (S1+S2) is a second parameter for estimating the level of maturation of organic matter. The threshold for oil production is around 0.1 and continuing to 0.4, which the gas threshold is produced. Most of samples result the ranges 0.03 to 0.29 indicating belongs to of top oil window. A good correlation is shown with relationships between production index (PI) and vitrinite reflectance (VR).
Fig. 7. (a) Distribution of Vitrinite Reflectance, and (b) Tmax, for overall samples in Majalengka sub-basin, and maturation scale from [25].
Figure 8. A. Massive sandstone overlain in interbed of shale with very fine sand to silty to form channelized body (Facies D) as a reservoir candidate, the outcrops is upper-part of Cinambo Formation, which good exposure around Cinambo and Cilutung rivers. B. Shale-dark as source rocks as part of Cisaar-shale and lower Cinambo Formation and well outcropping around Cisaar and western-part Cimaningtin village.
The mature index for vitrinite reflectance (VR) show varies, the increasing of this value linked to magmatic activity in which the organic matter was accumulated. Meanwhile, the immature value related to samples which is took from the upper part of sediment turbidite (Figure 7a).
To denote the temperature maturation in organic content is used vitrinite as maceral type in coal. Maceral is analogous with minerals in the rock. Vitrinite is a type of kerogen particle formed from humic gels thought to be derived from the lignin-cellulosa cell walls of higher plants [17]. Vitrinite is a common component of coals, and the reflectance of vitrinite particles was first observed to increase with increasing time
and temperature in a predictable manner in coals [16]. Related to deep marine environment (Majalengka sub-basin), the occurrence of vitrinite in most of organic matter is interpreted as a resedimentaion process, or sedimentation through the channel system. Paleobathymetry data which combine with isopach maps indicate that the Majalengka sub-basin is located at slope basin in deep marine environment systems, or transition zone between shallow marine and deep marine (bathyal zone) [2].
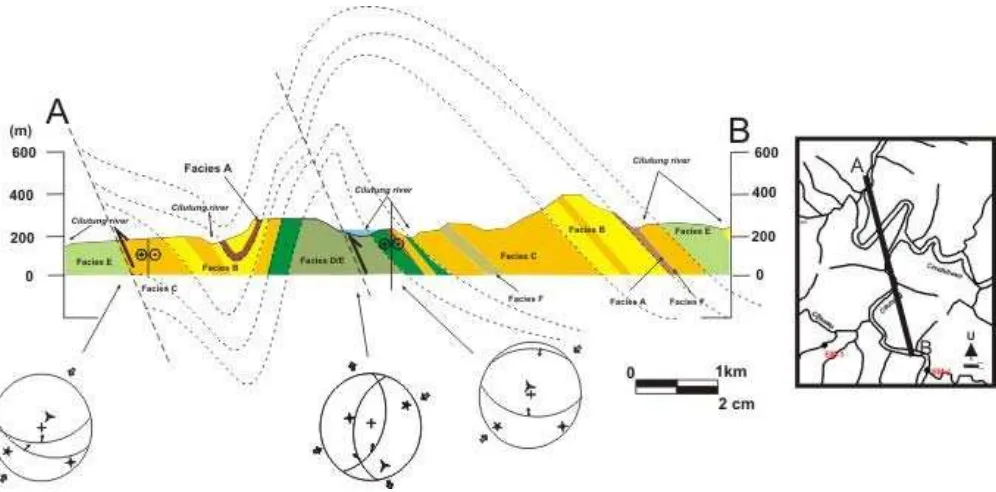
Fig. 9 Cross-section around Cilutung river near the Cimaningtin village describes two types trapping system in the Majalengka sub-basin i.e. stratigraphic trapping in Facies E and the anticlinal-structural traping pattern due to thrust-fault belts during the Tertiary.
Thus based on the assessment of organic matter adapted from [14], and [18] the whole samples lie in between top and bottom of oil window on catagenetic stages. Meanwhile, according to result of analysis [6] either oil or gas prone generation indicate the generate stage is immature.
E.Reservoir
A hydrocarbon reservoir is a place in which the hydrocarbon can be accumulated. In order to hydrocarbon accumulation two aspects are required, there are porosity and permeability. Basically, most of rocks can act as reservoir for hydrocarbon, which depend on the value of the both aspects and it assigns reservoir quality.
The reservoir quality is very dependent on the rock composition. Sandstone as the main reservoir in petroleum system is composed of three component (quarzt,feldspar, and lithic fragment) and matrix. Provenance analysis in Majalengka sub-basin indicates that lithic fragment from volcanic-origins are very dominant as a sediment source in stratigraphic [2]. Increasing of these fragments represents a trend of porosity destruction, which indicates the decrease reservoir quality [18].
Field investigation by [2] indicated that the reservoir candidate is massive sandstone with the thickness average is approximately 1 to 1.5 meters. This sandstone forms a channel-like elongated with trend deposition from north to south, which appropriate with paleocurrent measurement [2]. According to sediment turbidite in deep marine systems, it can be classified as facies D [12]. Good exposure of this sandstone type can be found along Cinambo and Cilutung rivers, near the Cimaningtin village, and it’s as the reservoir candidates
are commonly found in the upper-part of Cinambo Formation (Figure 8a).
F.Seals
Two types of seals in study area, part of shallow marine depositional are shale and silty. Lithostratigraphically,
, it belongs to Subang Formation, well distributed and covering in large area, shale dominated and deposited during quiet event at the end of Miocene. In deep marine system, this type belongs to facies E [12]. Both of sedimentary rosks types are considered as a good sealing mechanism in Majalengka sub-basin, which the good seals in the gas expulsion zone (Ro equivalen 0,6%) and belong to stratigraphic traps.
In addition of the stratigraphic sealing, the structure sealing is also developing in this basin i.e. anticlinal structure. This structure related to the fault system in West Java during Tertiary i.e. thrust-fault belts. Model for combination trapping system can show in figure 9.
Field studies of producing oil and gas basins [22] and laboratory research on the geochemistry and kinetics of the kerogen-hydrocarbon transformation [23] indicate that the rate of oil and gas-generation, accumulation, and degradation are functionally dependent the age of hydrocarbon-bearing strata and the temperature regime through time to which these strata have been exposed [24]. It means that the accumulation of hydrocarbon in the Majalengka sub-basin occurred during the middle Miocene in Cinambo intervals, furthermore, some of them migrated to reservoir pass through fractured-zone due to tectonism.
TABLE 1.
ORGANIC MATTER BY USING ROCK-EVAL PYROLYSIS AND DETERMINATION OF THERMAL MATURITY IN ALL SAMPLES OF SEDIMENT TURBIDITE IN MAJALENGKA SUB-BASIN. MOST OF SAMPLES WAS TAKEN FROM SHALE IN FACIES E [12].
No ID sample Lithology
Pyrolisis
(PY) S2/S3 PI HI OI
Thermal Matury Tmaks TOC
(%)
S1 S2 S3 VR
(Ro %) SCI
V.DISCUSSION
A.Petroleum system
The hydrocarbon potential of the sediment turbidities in Majalengka sub-basin, West Java, Indonesia was analyzed by using Rock-Eval Pyrolisis and Vitrinite Reflactence. Total organic carbon (TOC) content mostly varies from 0.18 to 1.6 wt%, a value indicated that the organic matter in this sedimentary rocks is poor to fair quality. Those samples represent the sediment turbidite which was taken from two lithotogic units i.e. Cisaar and Cinambo Formation.
However, some data shows the TOC value is in the range of good quality of hydrocarbon potential. This data is derived from the lower-part of Cinambo Formation, which the samples were taken around Cimaningtin village. Thus, suggested that this interval is good for model source rocks in this basin.
Source rock analyses throughout this basin indicate most of the organic matter is derived from terrestrial plant material, which deposited to deep marine environment through channel systems, and accumulated on a depression zone.
According to paleobathymetry maps interpretation [2], this region is an isolate depression zone extending relatively northwest to southeast direction. The zone forms an asymmetric basin, which more flat to northwest-side. That was probably formed due to the couple strike-slip fault northwest to southwest directions [2]. The accumulated of organic matter in this zone is considerable amounts to generate hydrocarbon, especially gas-prone [11].
The next steps after hydrocarbon-generation has been formed, the hydrocarbons migrate to reservoir-sandstone, which is formed as channelized system. Two types of trapping mechanism which developed in this area are stratigraphic and structural traps.
Thermal alteration for organic matter maturation, based on thermal data in Northwest Java onshore to south, indicates that tend to increase parallel with stratigraphic succession in this basin, and its affected by the increasing of magmatism event toward to late Miocene.
VI. CONCLUSION
Majalengka sub-basin is located in the intra-arc (back-arc) basin in Miocene, and currently is superimposed with the Quarter magmatic arc. The development of this basin is dominantly influenced by two events geology: magmatism and tectonism.
Limited source rocks, high volcanic-origins content, narrow of accommodation space of basin, and high magmatism and tectonic activity during the deposition of this basin are some parameters to determine petroleum systems.
It is as a consequence the basin location in the intra-arc (back-arc) basin, the manifestation of subduction product during the middle to late Miocene in West Java.
AKNOWLEDGMENT
I would like to thank The Ministry of National Education of the Republic Indonesia for my scholarships, and Global-Centre of Excellence (G-COE) in Novel Carbon Resource Science, Kyushu University, Japan for fieldworks fund supported. And also I would like to greatly thank Dr. Darjie Noeradi from The Bandung Institute of Technology (ITB) and Ir. Djadjang Djedi Setiadi,M.Sc. and Cipta Endyana, ST., MT, from Department of Geology, Padjadjaran University, Indonesia for discussion and suggestion to completely the manuscripts.
REFERENCES
[1] Bemmelen van., R.W, “ The Geology of Indonesia”, v. 1A., Martinus Nijhoff , The Heague, Netherland. 732 pp. 1949.
[2] Budi Muljana, “Geometry of sediment turbidite in
Majalengka area, West Java, Indonesia” Master Thesis
ITB, 128 pp. (unpublished). 2006.
[3] Conford C., “Integrated Geochemical Interpretation”
Petroleum Geology. p. 258-294. 2005.
[4] Djuhaeni., dan Martodjojo., S.,“Stratigraphy of Majalengka area, and relationships with nomenclature of lithostratigraphy units at Bogor Basin”.Geol. Indon., V.12., no. 1., pp. 227-252. 1989.
[5] Djuri.,“ Arjawinangun geology maps, 10/XIII-D sheets”, Directorat of Geology, Indonesia. 1995.
[6] Dow W.G., “Kerogen studies and geologic interpretation”, Journal Geochem. Explor. 7, 79-99. 1977.
[7] Espitalié J., Madec M., Tissot B., Menning J.J. and Leplat P.,“Source rock characterization method for petroleum exploration”, Proc. Ninth Annual Offshore
Technology Conf. 3, 439-448. 1977.
[8] Hall. R., “Southeast Asia’s changing paleogeography”,
Blumea 54. p. 148-151. 2009.
[9] Koesoemadinata., R.P., dan Martodjojo., S.,”Turbidity research in Java island”, Reseach report. no. 1295/74, Badan Penelitian., ITB., Bandung. 1974.
[10] Martodjojo., S.,” Evolution of Bogor Basin, West Java”, Ph.d dissertation, ITB (unpublished).1984. [11] Merril R.K., “Source and Migration Process and
Evaluation Techniques”, Treatise of Petroleum
Geology, The American Association of Petroleum Geologist. 213 pp. 1991.
[12] Mutti., E., and Ricci Lucci., F.,”Turbidities of the northern Apennines : Introduction to Facies Analysis”,
Internat., Geology Rev, v.20., no.2. 1972.
[13] Patmosukismo, S., and Yahya, I, “The basement configuration of North west Java area”, In: Procceding
Indonesian Petroleum Association. The 3rd Annual
Convention.. p. 129-153. 1974.
[14] Peters, K.E.,”Guidelines for evaluating petroleum source rock using programmed pyrolysis”, AAPG
Bulletin, v.70, p.318-329. 1986.
[15] Satyana., A.H., and Armandita., C, “Deepwater Plays of Java, Indonesia : Regional Evaluation on opportunities and risks”, In: Proceeding Indonesian
Petroleum Association. Deepwater and frontier Exploration In Asia & Australia Symposium. 2004.
[16] Teichmüller, M.,”Application of coal petrological methods in geology including oil and natural gas prospecting”, in E.Stach, M.-Th. Mackowsky, M. Teichmüller, G.H. Taylor, D. Chandra, and R. Teichmüller, eds., Stach’s textbook of coal petrology: Berlin, Gebrüder Borntraeger, p.381-413. 1982. [17] Teichmüller,”The genesis of coal from the viewpoint
of coal petrology”, International Journal of Coal
Geology, v.12, p. 1-87. 1989
[18] Tissot B.P. and Welte D.H. “Petroleum Formation and
Occurrence”, second edition. Springer, Berlin. 699 pp.
1984.
[19] Tissot B.P., Pelet R. and Ungerer, Ph., “Thermal history of sedimentary basins, maturation indices, and kinetics of oil and gas generation”. Am.Assoc.Pet.
Geol. Bull. 71, 1445-1446. 1987.
[20] Waples D.W., Geochemistry in Petroleum Exploration, International Human Resources Development Corp., Geological Sciences Series, Boston, 232 pp. 1985. [21] Fletcher, G.L. and K.W. Bay. “Geochemical
evaluation- NW. Java Basin” In: Proceeding
Indonesian Petroleum Association. The 4th Annual
Convention. p. 211-241. 1975.
[22] Phillippi, G.T., “On the depth, time and mechanism of petroleum generation”: Gechim. et Cosmochim. Acta,
v.29. p. 1021-1049. 1965.
[23] Welte, D.H.,”Petroleum exploration and organic geochemistry”: Journal Gechemical Exploration. v.1.p. 117-136. 1972.
[24] Schlanger., S.O., and J.Combs.”Hydrogen potential of marginal basins bounded by an island-arc”. Geology.p. 397-400.1975.
[25] Bordenenave, M.L.”Applied Petroleum Geochemistry.
![Fig. 7. (a) Distribution of Vitrinite Reflectance, and (b) Tmax, for overall samples in Majalengka sub-basin, and maturation scale from [25]](https://thumb-ap.123doks.com/thumbv2/123dok/547913.64247/5.595.51.549.332.515/distribution-vitrinite-reflectance-tmax-overall-samples-majalengka-maturation.webp)