WALKABILITY IN SUBURBIA BY LAUREN PATTERSON A REPORT
submitted in partial fulfillment of the requirements for the degree
MASTER OF LANDSCAPE ARCHITECTURE
Department of Landscape Architecture/Regional and Community Planning College of Architecture, Planning and Design
KANSAS STATE UNIVERSITY Manhattan, Kansas 2014 Approved by: Major Professor Dr. Hyung Jin Kim
ABSTRACT
Walkability is a challenge for most suburban metropolitan areas. Specifically, the Kansas City suburban cities of Overland Park, Olathe, Leawood, and South KCMO have sprawled and disconnected urban patterns and a low average walkability score of 37 out of 100 (Walk Score, 2013). The Indian Creek Trail, an existing recreational trail that extends throughout the southern Kansas City neighborhoods, has the potential to improve walkability. It connects major destinations, including residential communities, businesses, and commercial districts throughout the suburban neighborhoods. Many studies have analyzed suburban sprawl and walkability, but few studies have identified the possibility of enhancing existing trail systems to provide for greater mobility, connectivity, and activity. The study examines the feasibility of reusing an existing trail system to act as a catalyst to promote walkability in the Kansas City suburbs. The goal of the project to create a paradigm shift in the way people think about transport and development. The purpose is to identify how centering walkable strategies around an active
transportation network can promote walkability in sprawled suburban areas.
The question: How can focusing improvement around existing trail infrastructure enhance walkability in suburban areas? has guided the project and helped define strategies for improvement. This project identifies the Indian Creek Trail’s current and potential uses from an in depth community and spatial analysis. Surveys, interviews, and observations were conducted within 13 major destination areas along the Indian Creek Trail. The results were then analyzed to create an evidence‐based design framework that will address walkable concerns.
The project results showed there were three primary causes for walkable limitations along the trail network: current transportation trends, suburban development patterns, and social perceptions. Understanding these important aspects of walkability helped identify a framework for improvement. The findings from the analysis determined the site restrictions and prospects of creating a walkable environment along the Indian Creek Trail. The results identified primary locations of needed intervention and revealed major opportunities for connection. The design then applied walkable
components based on analysis findings to create nodes of complete communities. Design decisions were tailored to amend community needs and alter traditional transport perceptions. The objective of the designs was to address specific walkable limitations to create reasonable solutions in suburban areas. The project identifies 5 primary components of walkability that can be used to create a walkable plan. Future studies would revolve around implementing the designs and analyzing the effectiveness to create a model that can be applied to enhance walkability for other suburban areas. Ultimately, the results could establish how improved walkability can promote multi‐modal transportation opportunities where population, density, diversity, and funding do not allow for typical transportation or development enhancements.
WALKABILITY IN SUBURBIA
2
3
4
1
5
6
7
INTR
ODUC
TION
WALKABILITY IN SUBURBIA
SPRING 2014A report by Lauren Patterson
Submitted in partial fulfillment of the requirements for the degree: Master of Landscape Architecture
Department of - Landscape Architecture/Regional Community Planning College of - Architecture, Planning, and Design Kansas State University
Manhattan, Kansas Committee Members: Dr. Hyung Jin Kim, Assistant Professor, Department of LARCP Dr. Brent Chamberlain, Assistant Professor, Department of LARCP Dr. Katie Heinrich, Assistant Professor, Department of Kinesiology
Approved by:
2
3
4
1
5
6
7
INTR
ODUC
TION
ABSTRACT
limitations to create reasonable solutions in suburban areas. The project identifies 5 primary components of walkabiltiy that can be used to create a walkable plan. Future studies would revolve around implementing the designs and
analyzing the effectiveness to create a model that can be applied to enhance walkability for other suburban areas. Ultimately, the results could establish how improved walkability can
promote multi-modal transportation opportunities where population, density, diversity, and funding do not allow for typical transportation or development enhancements. environment along the Indian
Creek Trail. The results identified primary locations of needed intervention and revealed major opportunities for connection. The design then applied walkable components based on analysis findings to create nodes of complete communities.
CONCLUSION:
Design decisions were tailored to amend community needs and alter traditional transport perceptions. The objective of the designs was to address specific walkable Indian Creek Trail. The results were
then analyzed to create an evidence-based design framework that will address walkable concerns.
RESULTS:
The project results showed there were three primary causes for walkable limitations along the trail
network: current transportation
trends, suburban development patterns, and social perceptions. Understanding these important aspects of walkability helped identify a framework for improvement.
The findings from the analysis determined the site restrictions and prospects of creating a walkable around an active transportation
network can promote walkability in sprawled suburban areas.
The question:
How can focusing improvement
around existing trail
infrastructure enhance
walkability in suburban areas?
has guided the project and helped define strategies for improvement.
METHODOLOGY:
This project identifies the Indian Creek Trail’s current and potential uses from an in depth community and spatial analysis. Surveys, interviews, and observations were conducted within 13 major destination areas along the suburban neighborhoods. Many
studies have analyzed suburban sprawl and walkability, but few studies have identified the possibility of enhancing existing trail systems to provide for greater mobility, connectivity, and activity.
PURPOSE:
The study examines the feasibility of reusing an existing trail system to act as a catalyst to promote walkability in the Kansas City suburbs.
The goal of the project to create a paradigm shift in the way people think about transport and development. The purpose is to identify how centering walkable strategies
BACKGROUND AND SIGNIFICANCE:
Walkability is a challenge for most suburban metropolitan areas. Specifically, the Kansas City suburban cities of Overland Park, Olathe, Leawood, and South KCMO have sprawled and disconnected urban patterns and a low average walkability score of 37 out of
100 (Walk Score, 2013)
The Indian Creek Trail, an existing recreational trail that extends throughout the southern Kansas City neighborhoods, has the potential to improve walkability. It connects major destinations, including residential communities, businesses, and commercial districts throughout the
2
3
4
1
5
6
7
INTR
ODUC
TION
1
2
3
TABLE OF CONTENTS
4
5
6
7
INTRODUCTION
2
PROJECT UNDERSTANDING
16
METHODOLOGY
58
ANALYSIS
80
DESIGN
162
CONCLUSION
200
APPENDIX
222
2
3
4
1
5
6
7
INTR
ODUC
TION
List of Figures
CHAPTER 1FIGURE 1-1 | FOCUS AREA ORIENTATION STATE-WIDE MAP (Patterson, 2013) 7
FIGURE 1-2 | FOCUS AREA ORIENTATION COUNTY-WIDE MAP (Patterson, 2013) 7
FIGURE 1-3 | MAP OF INDIAN CREEK TRAIL FOCUS AREA (Patterson 2013) 8
FIGURE 1-4 | METHODOLOGY DIAGRAM (Patterson, 2014) 11
CHAPTER 2
FIGURE 2-1 | LITERATURE MAP ABOUT THE BENEFITS OF WALKABILITY (Patterson, 2013) 17
FIGURE 2-2 | POLICY STATISTICS FROM 2012 BENCHMARK REPORT (Alliance, 2012) 20
FIGURE 2-3 | COMPONENTS OF WALKABILITY (Patterson, 2014) 27
FIGURE 2-4 | LAND USE MAP ILLUSTRATING SPRAWLED, SEGREGATED LAND USE (Patterson, 2013) 32
FIGURE 2-5 | RESIDENTIAL DENSITY MAP (Patterson, 2013) 33
FIGURE 2-7 | IMAGE OF LOW DENSE LAND USE SEPARATED BY LARGE ROADS(Patterson, 2013) 34
FIGURE 2-6 | DISTRIBUTION OF DENSITY MAP (Patterson, 2013) 34
FIGURE 2-8 | IMAGE OF SPRAWLED LAND USE AND PARKING LOTS (Patterson, 2013) 35
FIGURE 2-9 | IMAGE OF PARKING LOT AND ROAD BARRIERS (Patterson, 2013) 35
FIGURE 2-10 | MAP OF LAND USE DENSITIES CENTERED AROUND INTERSECTIONS (Patterson, 2013) 36
FIGURE 2-11 | MAP OF BUS STOP AND ROUTE LOCATIONS (Patterson, 2013) 38
FIGURE 2-12 | IMAGE OF POOR BUS STOP CONDITIONS (Patterson, 2013) 38
FIGURE 2-13 | IMAGE OF LARGE EXPANSIVE ROADWAYS WITH LIMITED DESTINATION ACCESSIBILITY (Patterson 2014) 39
FIGURE 2-14 | IMAGE OF VEHICLE ORIENTED BIG BOX DEVELOPMENT (Patterson, 2013) 40
FIGURE 2-15 | IMAGE OF TYPICAL DEAD END SIDEWALK (Patterson, 2014) 41
FIGURE 2-16 | IMAGE OF COW PATH CONNECTING SIDEWALKS NEAR ROAD (Patterson, 2014) 41
FIGURE 2-17 | MAP OF LIMITED SIDEWALKS IN KCMO (Patterson, 2013) 42
FIGURE 2-18 | IMAGE OF PEDESTRIANS WAITING AT BUS STOPS (Patterson, 2014) 42
FIGURE 2-19 | FOCUS AREA STATISTICS COMBINED FROM THE U.S. CENSUS BUREAU CITY DATA 43
(U.S. Census Beurau, 2014) 43
FIGURE 2-20 | MAP OF NEARBY TRAIL NETWORKS (Patterson, 2013) 54
FIGURE 2-21 | MAP ACTIVITY NEAR THE INDIAN CREEK TRAIL (Patterson, 2013) 54
FIGURE 2-22 | SECTION OF THE INDIAN CREEK TRAIL CONDITIONS (Patterson, 2013) 55
CHAPTER 3
FIGURE 3-1 | LAND USE PATTERNS NEAR THE TRAIL (Patterson, 2013) 62
FIGURE 3-2 | DENSITY PATTERNS NEAR THE TRAIL (Patterson, 2013) 62
FIGURE 3-3 | MAPPING OVERLAY OF DIFFERENCES ALONG THE TRAIL (Patterson, 2013) 64
FIGURE 3-4 | DESTINATION ZONE MAP (Patterson, 2013) 66
FIGURE 3-5 | PEDESTRIAN COUNT OBSERVATION FORM EXAMPLE (Patterson, 2013) 72
FIGURE 3-6 | FOCUS AREA POPULATION STATISTICS (U.S. Census Bureau, 2014) 74
CHAPTER 4
FIGURE 4-1 | DESTINATION ZONE ANALYSIS GROUPS (Patterson, 2014) 97
FIGURE 4-2 | DESTINATION ZONE 13 DETAIL (Patterson, 2013) 97
FIGURE 4-3 | DESTINATION ZONE 6 CHARACTER IMAGE (Patterson, 2014) 98
FIGURE 4-4 | DESTINATION ZONE 13 CHARACTER IMAGE (Patterson, 2014) 98
FIGURE 4-5 | DESTINATION ZONE 7 CHARACTER IMAGE (Patterson, 2013) 98
2
3
4
1
5
6
7
INTR
ODUC
TION
FIGURE 4-7 | ANALYSIS OF DESTINATION ZONE 1.AI (Patterson, 2013) 101
FIGURE 4-8 | TYPICAL SECTION OF GROUP 1 (Patterson, 2014) 101
FIGURE 4-9 | MAP OF ANALYSIS GROUP 2 (Patterson, 2014) 103
FIGURE 4-10 | ANALYSIS OF DESTINATION ZONE 6.AI (Patterson, 2013) 105
FIGURE 4-11 | TYPICAL SECTION OF GROUP 2 (Patterson, 2014) 105
FIGURE 4-12 | MAP OF ANALYSIS GROUP 3 (Patterson, 2014) 107
FIGURE 4-13 | ANALYSIS OF DESTINATION ZONE 10.AI (Patterson, 2013) 109
FIGURE 4-14 | TYPICAL SECTION OF GROUP 3 (Patterson, 2013) 109
FIGURE 4-15 | MAP OF ANALYSIS GROUP 4 (Patterson, 2014) 111
FIGURE 4-16 | ANALYSIS OF DESTINATION ZONE 12.AI (Patterson, 2013) 113
FIGURE 4-17 | TYPICAL SECTION OF GROUP 3 (Patterson, 2013) 113
FIGURE 4-18 | TRAVEL IN KANSAS CITY (Patterson, 2014) 117
FIGURE 4-19 | LEAWOOD PARK ENTRANCE (Patterson, 2014) 121
FIGURE 4-20 | MULTIPLE CONFUSING PATHWAYS (Patterson, 2014) 121
FIGURE 4-21 | CONSTRAINT MAP OF DESTINATION ZONE 10 (Patterson, 2013) 123
FIGURE 4-22 | OPPORTUNITY MAP OF DESTINATION ZONE 10 (Patterson, 2013) 123
FIGURE 1 | 4-BIKERS-CONNECTIVITYROAD.PNG 124
FIGURE 4-23 | BIKERS ON THE TRAIL (Patterson, 2014) 124
FIGURE 4-24 | IMAGE OF FISHING ACTIVITIES (Patterson, 2014) 124
FIGURE 4-25 | IMAGE OF PARK REGULATIONS AND SIGNAGE (Patterson, 2014) 124
FIGURE 4-26 | LEAWOOD PARK PUBLIC POOL (Patterson, 2014) 125
FIGURE 4-27 | CHILD PLAYING IN OPEN FIELD (Patterson, 2014) 128
FIGURE 4-28 | SOCIAL CONSTRAINTS OF LEAWOOD PARK (Patterson, 2014) 129
FIGURE 4-29 | CONSTRAINT MAP OF DESTINATION ZONE 5 (Patterson, 2013) 133
FIGURE 4-30 | OPPORTUNITY MAP OF DESTINATION ZONE 5 (Patterson, 2013) 133
FIGURE 4-31 | CONNECTIVITY RESTRICTIONS OF STRIPMALL RETAIL (Patterson, 2014) 134
FIGURE 4-32 | COWS PATHS CREATED BECAUSE OF LIMITED ACCESS (Patterson, 2014) 135
FIGURE -33 | NARROW BUFFER (Patterson, 2014) 135
FIGURE 4-34 | PATCHWORK OF PAVEMENT (Patterson, 2014) 135
FIGURE 4-35 | SIDEWALK DISCONNECT (Patterson, 2014) 136
FIGURE 4-36 | SIDEWALKS BREAK (Patterson, 2014) 136
FIGURE 4-36 | SIDEWALK HAZARDS (Patterson, 2014) 136
FIGURE 4-37 | BUSINESS PROXIMITY TO TRAIL WITH NO ENTRANCES/INFRASTRUCTURE (Patterson, 2014) 136
FIGURE 4-38 | CONNECTIVITY RESTRAINTS NEAR QUIVERA (Patterson, 2014) 137
FIGURE 4-39 | LAND USE DESIGN AND DENSITY APPROPRIATE FOR THIS REGION (Patterson, 2014) 140
FIGURE 4-40 | FAR DENSITY DIAGRAM FROM THE DENSITY ATLAS (“FAR Coverage” 2011) 141
FIGURE 4-41 | LIMITED CONNECTIVITY FROM SIDEWALK TO BUILDING (Patterson, 2014) 143
FIGURE 4-42 | BUILDING DISTANCES CONDUCIVE TO VEHICLES (Patterson, 2014) 144
FIGURE 4-43 | INDIANCREEKTRAIL_DONOTBUILDMAP 11.PDF - (Patterson, 2013) 145
FIGURE 4-44 | ANALYSIS OF DESTINATION ZONE 11.AI - (Patterson, 2013) 145
FIGURE 4-45 | EXPANSIVE PARKING LOT CONNECTION CREATING GREAT DISTANCES BETWEEN BUILDINGS (Patterson, 2014) 146
FIGURE 4-46 | ACCESS TO NOWHERE WITH NO PEDESTRIAN INFRASTRUCTURE (Patterson, 2014) 146
FIGURE (PATTERSON, 2014)-47 | BUILDINGS ADJACENT TO TRAIL BLOCKING ACCESS AND VISIBILITY (Patterson, 2014) 147
FIGURE 4-48 | TEMPORARY INFILL DEVELOPMENT STRATEGY (Patterson, 2014) 148
FIGURE 4-49 | INFILL DEVELOPMENT ORIENTED TOWARDS THE ROAD (Patterson, 2014) 148
FIGURE 4-50 | SIGNAGE FOR DESTINATION DIRECTED TOWARDS TRAIL (Patterson, 2014) 149
FIGURE 4-51 | LIMITED BUS STOP INFRASTRUCTURE (Patterson, 2014) 150
FIGURE 4-52 | CONSTRAINTS OF THE SPRAWLED URBAN FORM (Patterson, 2014) 151
FIGURE 4-53 | NO SIDEWALK (Patterson, 2014) 155
FIGURE 4-54 | NARROW SIDEWALK (Patterson, 2014) 156
FIGURE 4-55 | DEADEND SIDEWALK (Patterson, 2014) 156
FIGURE 4-56 | NARROW CONFINING BRIDGE (Patterson, 2014) 156
FIGURE 4-57 | NO SIDEWALK (Patterson, 2014) 156
2
3
4
1
5
6
7
INTR
ODUC
TION
CHAPTER 6FIGURE 5-1 | DESIGN METRICS (PATTERSON, 2014) 165
FIGURE 5-2 | DIAGRAMMATIC DESIGN MAP (PATTERSON, 2014) 168
FIGURE 5-4 | DESIGN RENDERING TO ILLUSTRATED SOCIAL STRATEGIES (PATTERSON, 2014) 173
FIGURE 5-3 | EXISTING VIEW FROM TRAIL WITHIN LEAWOOD PARK (PATTERSON, 2014) 173
FIGURE 5-5 | DESTINATION ZONE 5 BEFORE IMAGE (PATTERSON, 2013) 178
FIGURE 5-6 | DESIGN RENDERING TO ILLUSTRATE CONNECTIVITY STRATEGIES IN DESTINATION NODE 5 (PATTERSON, 2014) 178
FIGURE 5-8 | DESIGN RENDERING TO ILLUSTRATE CONNECTIVITY ENHANCEMENTS FOR DESTINATION NODE 5 (PATTERSON, 2014) 179
FIGURE 5-7 | EXISTING IMAGE OF DESTINATION ZONE 5 (PATTERSON, 2014) 179
FIGURE 5-9 | DESIGN RENDERING TO CAPITALIZE ON EMPTY PARKING LOTS IN DESTINATION ZONE 11 (PATTERSON, 2014) 184
FIGURE 5-11 | DESIGN RENDERING TO ILLUSTRATE URBAN FORM STRATEGIES OF DESTINATION ZONE 11 (PATTERSON, 2014) 185
FIGURE 5-10 | EXISTING VIEW OF LAND USE IN DESTINATION ZONE 11 (PATTERSON, 2014) 185
FIGURE 5-13 | DESIGN RENDERING TO ILLUSTRATE SOLUTIONS FOR WALKABILITY IN DESTINATION ZONE 13 (PATTERSON, 2014) 191
FIGURE 5-12 | EXISTING PEDESTRIAN EXPERIENCE WITHIN DESTINATION NODE 13 (PATTERSON, 2014) 191
FIGURE 5-15 | DESIGN RENDERING TO ILLUSTRATE PEDESTRIAN ENHANCEMENTS IN DESTINATION ZONE 7 (PATTERSON, 2014) 197
FIGURE 5-14 | EXISTING EXPERIENCE OF DESTINATION ZONE 7 (PATTERSON, 2014) 197
FIGURE 4-59 | OPPORTUNITY MAP OF DESTINATION ZONE 13 (Patterson, 2014) 157
FIGURE 4-60 | COW PATH CREATED TO GET UP HILL DUE TO LACK OF INFRASTRUCTURE (Patterson, 2014) 158
FIGURE 4-61 | SIGNS OF USE DURING BAD WEATHER (Patterson, 2014) 158
FIGURE 4-62 | BUILDINGS ADJACENT TO TRAIL WITH LIMITED ACCESS 160
FIGURE 4-63 | CONSTRAINTS OF THE POOR INFRASTRUCTURE (Patterson, 2014) 161
FIGURE 4-64 | VEHICULAR SCALE OF ROAD (Patterson, 2014) 165
FIGURE 4-65 | CONSTRAINT MAP OF DESTINATION ZONE 7 (Patterson, 2013) 167
FIGURE 4-66 | OPPORTUNITY MAP OF DESTINATION ZONE 7 (Patterson, 2013) 167
FIGURE 4-67 | NO SAFE/DIRECT CROSSING (Patterson, 2014) 168
FIGURE 4-68 | DEADEND SIDEWALK 168
FIGURE 4-69 | DANGEROUS CROSSING DUE TO SCALE OF ROAD (Patterson, 2014) 168
FIGURE 4-70 | INEFFICIENT INFRASTRUCTURE (Patterson, 2014) 168
FIGURE 4-71 | LIMITED BUFFER CREATING UNSAFE ENVIRONMENT (Patterson, 2014) 169
FIGURE 4-72 | LONG/NARROW CROSSWALK (Patterson, 2014) 169
FIGURE 4-73 | BIG BOX RETAIL (Patterson, 2014) 169
FIGURE 4-74 | SIDEWALK TO NOWHERE (Patterson, 2014) 170
FIGURE 4-75 | SPACE ALLOTED TO VEHICLES (Patterson, 2014) 171
FIGURE 4-76 | SCALE OF ROAD = UNWELCOMING PEDESTRIAN ENVIRONMENT (Patterson, 2014) 172
2
3
4
1
5
6
7
INTR
ODUC
TION
Indian Creek Trail
1
3 | Background and Significance
7 | Study Area
9 | Project Focus
11 | Project Process
INTRODUCTION
2
3
4
1
5
6
7
INTR
ODUC
TION
BACKGROUND AND SIGNIFICANCE
retrofitting strategies are large, costly models that come with
community resistance (Tumlin 2012,
71).So, can a new approach be
formed to implement strategies in a more efficient manner?
Walkability in suburbia is a complex matter. The primary concern stems from vehicle oriented planning that has segregated the suburban landscape.
Walkability is defined by the proximity of amenities, and the pattern of suburban form is characterized by
remote, inaccessible places (Cox, 2010).
The sprawled, leap-frog development has created many barriers to
how suburban patterns are evaluated to create conditions welcoming to all forms of travel.
Through an analysis of current walkability resources and community concerns, restrictions have been identified that make many suburban retrofitting techniques implausible or inefficient. Various pedestrian travel, and made the
car the most efficient form of
transport in the majority of suburban
cities (Untermann, 1984).
The unsustainable practices and poor walkable conditions of suburban places have been well documented within the past decade. Books
such as Retrofitting Suburbia, and
organizations such as The Smart
Growth Network, have developed
countless approaches to mend
suburban harms. However, the typical types of strategies within many walkability resources leave out some important conditions of the suburban lifestyle that cannot
be easily measured. Peter Cox (2010),
in his book Moving People, states
that the failure of development has been historically articulated but the underlying assumptions on which actions are constructed are ignored
(19). Illustrating the need to examine
Can redirecting retrofitting plans and
strategies to fit the suburban lifestyle, change
how development tactics are perceived?
Can centering transport models back
on the human scale, enhance walkable conditions and change how suburban areas are
planned?
Can focusing strategies on an existing network, instead of trying to create a whole new system, change transport
2
3
4
1
5
6
7
INTR
ODUC
TION
There are many variables that influence a walkable environment. Trail networks are not constrained by many of the barriers that limit walkable conditions because they are already designed as pedestrian networks. This project looks expand the benefits of trail systems outside the physical trail boundary to enhance walkable conditions throughout the surrounding community.
however, promotes connectivity and provides an already connected network set up for success.
So, how can trail systems facilitate walkability throughout suburbia? Trail networks are separate systems already integrated into the suburban fabric. This study examines how to focus strategies around existing trail networks to provide the opportunity to create walkable environments without completely transforming the suburban form.
All elements of transport include the pedestrian. Current transport and development standards are focused on vehicles and create hazards to pedestrian travel. This project looks to identify alternative opportunities to mend the disconnect between pedestrians and the built environment today. In suburbia, pedestrian
transportation is constrained by a lack of connectivity so there is rarely a continuous network to allow for
multiple choices of movement (Galina
2010, 10). An existing trail system
The focus of research is centered on establishing the feasibility of utilizing trail systems for walkability. The project examines the complexities of suburban walkability and proposes a solution that will integrate people into the built environment. By identifying opportunities and constraints of walkability along a trail network, a design can be created to integrate trail networks into the suburban form through different walkability strategies.
2
3
4
1
5
6
7
INTR
ODUC
TION
Walkable environments will vary based on different site conditions; therefore the Kansas City region has been chosen to explore how trail systems can affect walkability in suburbia.
The Kansas City metropolitan region makes development difficult due to the need to cross many political, social, and physical barriers. It is characterized by sprawled, segregated land use patterns, with limited
pedestrian infrastructure. The region also contains a unified and connected system of trails (MetroGreen
Network) already built into the established environment. Due to the sprawled nature and car culture of
KC, as well as the interconnected trail network, this area was chosen for the study. The Kansas City suburbs help
STUDY AREA
CLAY JACKSON PLATTE JOHNSON LEAVENWORTH WYANDOTTE CLAY JACKSON PLATTE JOHNSON LEAVENWORTH WYANDOTTEFigure 1-2 | Focus Area Orientation County-Wide Map (Patterson, 2013)
Figure 1-1 | Focus Area Orientation State-wide Map (Patterson, 2013)
Stateline Road
Indian Creek Trail
Stateline Road
define what elements affect walkability in suburbia and the Indian Creek Trail will identify how a trail system can enhance walkable conditions. Figures 1-1, 1-2, and 1-3 illustrate the focus area location.
CLAY JACKSON PLATTE JOHNSON LEAVENWORTH WYANDOTTE
Indian Creek Trail
Located on the boarder of Kansas and Missouri, six counties form to create the Kansas City Metropolitan Region: Leavenworth, Platte, Clay, Wyandotte, Johnson, and Jackson. The northern portions of Jackson and Wyandotte form the denser downtown Kansas City district. The remaining counties are the sprawled boundaries of the metropolitan region. Johnson and Jackson County are highly visited counties with numerous amenities. The Indian Creek Trail located in the southern region crosses through many of the primary destinations of this region and connects the adjoining jurisdictions.
2
3
4
1
5
6
7
INTR
ODUC
TION
This project will look to expand the benefits of the Indian Creek Trail to promote walkable conditions throughout the larger community. This will be accomplished by adding elements that do not currently exist, connecting to elements that are just out of reach, and expanding current opportunities.
designed for recreation, connecting only residences to the trail.
Conditions of walkability such as: safety, comfort, attractiveness, and sociability are also not present in many suburban conditions but are seen along trail networks
(MARC 1998, 4). The Indian Creek
Trail is separated from main roads and designed to accommodate groups of pedestrians and cyclists; creating a safe, welcoming area for walking and biking.
In order to have a walkable community you need elements of: people, mixed income/use, parks/ public spaces, pedestrian design, schools/workplaces, and complete
streets which aren’t typically seen in
most suburban conditions (Walk Score
2014). Trail networks provide many of
the elements needed for walkable conditions such as: people, public space, and pedestrian design, but aren’t set up to promote walkability outside the trail boundaries. Specifically, the Indian Creek Trail is
PROJECT FOCUS
systems to enhance walkability. It sets the stage for future research to evaluate the walkability components and establish the effectiveness of design implementations along trail networks. analysis and a diagrammatic design
was formed from the findings. The designs are proposals that simplify current walkability strategies today and can amend suburban walkability constraints one step at a time. The proposal centers on facilitating a shift in retrofitting strategies to focus on the pedestrian to counteract current walkability harms in suburbia. The project timeline only allows for theoretical solutions, and only touches on the ideas of utilizing trail The products of the project include
a simplified walkability strategy that can be tailored to different types of urban conditions. Founded through literature, walkability components were constructed to allow for different strategies that can be introduced around trail networks in suburban environments.
The opportunities and constraints of introducing walkability components along the Indian Creek Trail were then identified from a walkability
PROJECT PROCESSES
2
3
4
1
5
6
7
INTR
ODUC
TION
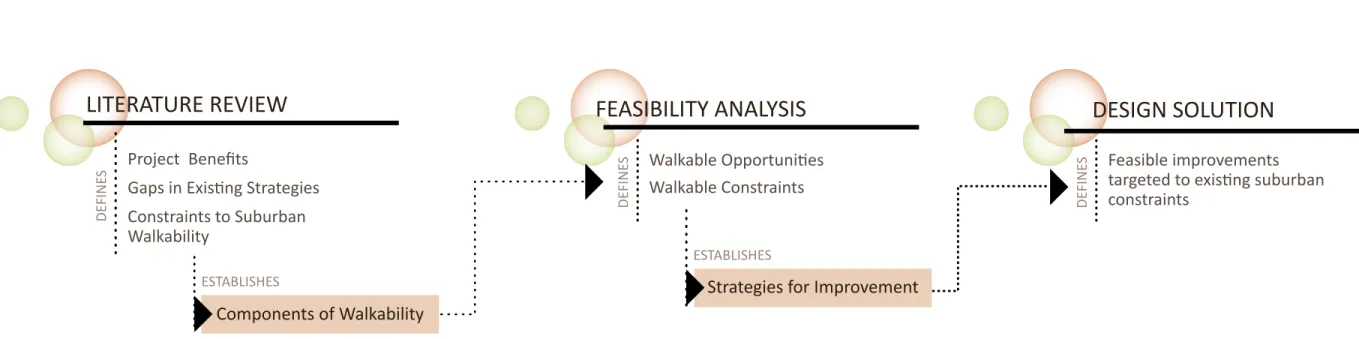
Figure 1-4 illustrates the project framework for understanding how the environment around the Indian Creek Trail can be transformed to enhance walkable conditions throughout the Kansas City Suburbs.
METHODOLOGY
Figure 1-4 | Methodology Diagram (Patterson, 2014)
LITERATURE REVIEW
Project Benefits
Gaps in Existing Strategies
Constraints to Suburban
Walkability
Components of Walkability
DEFINE SWalkable Opportunities
Walkable Constraints
Feasible improvements
targeted to existing suburban
constraints
DEFINE
S
ESTABLISHES
ESTABLISHES
Strategies for Improvement
DEFINE
S
2
3
4
1
5
6
7
INTR
ODUC
TION
to evaluate and focus walkability strategies. It directs the strategy for the project and creates a framework for the evaluation and design around the Indian Creek Trail.
Suburban Walkability
Suburban walkability illustrates the project concerns and reveals how the trail walkability strategy can enhance current conditions. in existing strategies to define a
simplified method for evaluating suburban walkability around trail networks. This evaluation helped define 5 components of walkability: connectivity, urban form, social aspects, pedestrian infrastructure, and pedestrian experiences, which have been identified as needed components for walkable conditions through the literature review. The components of walkability simplify current walkability checklists and strategies to create a cohesive tool The review of literature is separated
into three parts: Walkability Benefits,
Current Walkability Resources, and Suburban Walkability.
Benefits of Walkability
The benefits of walkability help illustrate the purpose for the project and the importance of establishing walkable communities.
Current Walkability Resources
Current walkability resources were examined to understand the gaps
A REvIEW OF LITERATURE
The design was formed through an evidence based design framework. It proposes walkability improvements based on the walkability analysis findings. The proposal is a basic example of how particular elements can be introduced to a site based on specific site conditions.
The evaluation of the Indian Creek Trail takes the components walkability and evaluates specific conditions of the site. The analysis identifies the primary walkability constraints and opportunities around the trail to influence strategies for improvement.
2
3
4
1
5
6
7
UN DER ST ANDIN GIndian Creek Trail
2
17 | Literature Review
51 | Project Strategy
55 | Project Goals
PROJECT UNDERSTANDING
2
3
4
1
5
6
7
UN DER ST ANDIN GLITERATURE REVIEW
The review of literature examines many current walkability studies and standards to define a strategy that can be tailored to trail networks in suburban areas.
BENEFITS OF WALKABILITY
Walkability is an important part of everyday
travel. “We are all
pedestrians…”(xi) and
all forms of transport rely on our ability to walk from one place
to another (Untermann,
1984). Walkability also defines much
of a community’s success or failure in terms of health, social capital, transportation options, vitality, and economic and environmental
sustainability (USEPA 2012).
Greater attention to enhanced walkability has come about due to recent research that reveals the benefits of walkable neighborhoods. Figure 2-1 illustrates the many resources and research that has been conducted about the benefits of walkability.
“Lack of pedestrian activity and amenities diminishes the quality of life in our communities”
(Untermann 1984, 1.)
E��������
The Economic Benefits of Walkable Communities (CCLC 1998) Economic Value of Walkability (Litman 2014)
The Walkability Premium in Commercial Real Estate Investments (Pivo, 2011, 185–219)
Planning for economic and environmental resilience (Winkelman et.al 2010, 575–586)
H�����
Many Pathways from Land use to Health (Frank et al. 2006)
In search of causality: a systematic review of the relationship between the built environment and physical activity among adults
Improving Health Through Transportation and Land-Use Policies (APHA 2009)
Impact of Community Design and Land Use Choices on Public Health: A Scientific Research Agenda (Dannenberg, 2003, 1500–1508)
Comparing the costs and health benefits of a proposed rail trail (VanBlarcom, 2013, 187–206)
The National Physical Activity Plan (CDC 2014)
U���� F���
T��������
Neighborhood walkability and its particular importance for adults with a preference for passive transport
Test-Retest Reliability of a survey to Measure Transport-Related Physical Activity in Adults (Bedland & Schofield, 2006)
Destinations that matter: Associations with walking for transport (Cerin et. al 2006) E����������
S����� C������
Healthy Neighborhoods: Walkability and Air Pollution (Marshall,
2009, 1752–1759)
Green Building and Development as a Public Good (Buzzelli, 2009)
Environmental and demographic correlates of bicycling (Sallis,
2013, 456-460)
Cities Afoot—Pedestrians, Walkability and Urban Design (Forsyth, 2008, 1-3)
Encouraging walkability in GCC cities: smart urban solutions (Kamelv2013,
288–310)
The 3Ds + R: Quantifying land use and urban form correlates of walking (Lee
&Moudon 2006, 204-215) Examining Walkability and Social Capital as Indicators of Quality of Life
at the Municipal and Neighborhood Scales (Rogers, 2010, 201–213) A Design and Planning Support System for Walkability and Pedestrian Accessibility (Blecic, 2013, 284–293)
Social Capital and the Built Environment: The Importance of Walkable Communities. (Leyden, Kevin 2003)
City structure, obesity, and environmental justice: An integrated analysis of physical and social barriers to walkable streets and park access (Cutts et. al, 2009)
2
3
4
1
5
6
7
UN DER ST ANDIN GAs shown in figure 2-1, walkability is affected by many different factors. However, walkability is about transport, and walking is the natural form of transit. Therefore any form of efficient, sustainable transportation starts with people. Today transportation is centered around cars, by redirecting focus to active or non-motorized forms of transit (NMT), the scale of vehicular dominance can be reduced and create a more welcoming environment for
pedestrians (Tumlin, 2012, 37.)
The Indian Creek Trail is the tool for redirecting transit focus towards pedestrians for this project. By utilizing the existing pedestrian pathway, other components of walkability can be addressed without having to focus on vehicles.
In the past, planning and funding for active transportation modes
have been very insignificant. The
Bicycling and Walking in the U.S.
2012 Benchmarking Report, by the
Alliance for Biking and Walking (BWA), summarizes active transportation patterns throughout the US. “Twelve percent of trips in the US are by bike or foot, yet cyclists and pedestrians make up fourteen percent of traffic fatalities and receive just 1.6 percent of federal transportation
dollars (Alliance, 2012, 9). Ironically,
transportation enhancements for active transportation
infrastructure are significantly less than enhancements for vehicular infrastructure. Yet funding is
Appendix A1 also summarizes the complete findings on the Kansas City area in more detail.
Understanding how trail systems can promote walkability is established through this project by connecting active transportation, with
components of walkability, through the Indian Creek Trail. Defining the components of walkability has been established by simplifying current walkability resources.
constantly directed toward vehicular means even though it segregates the
urban fabric (Alliance, 2012).
Kansas and Missouri have an average number of bikers and walkers and recently attention has been given to walkable strategies. Figure 2-2 shows the results found from the
2012 Benchmark Report, that
promote the need for enhanced bike and pedestrian conditions.
EXECUTIVE SUMMARY
High to Low Ranking of Bicycling and Walking Levels
1. Alaska 2. Vermont 3. New York 4. Montana 5. Oregon 6. Hawaii 7. Massachusetts 8. South Dakota 9. Wyoming 10. Maine 11. North Dakota 12. Pennsylvania 13. Idaho 14. Iowa 15. Washington 16. Colorado 17. Wisconsin 18. Minnesota 19. California 20. Illinois 21. Nebraska 22. Utah 23. New Jersey 24. New Hampshire 25. Rhode Island 26. Connecticut 27. Kansas 28. New Mexico 29. Arizona 30. West Virginia 31. Nevada 32. Maryland 33. Delaware 34. Michigan 35. Indiana 36. Virginia 37. Kentucky 38. Ohio 39. Louisiana 40. Missouri 41. Oklahoma 42. Florida 43. North Carolina 44. South Carolina 45. Texas 46. Mississippi 47. Arkansas 48. Georgia 49. Tennessee 50. Alabama STATES 11. Baltimore 12. Chicago 13. Oakland 14. Denver 15. Sacramento 16. Tucson 17. Milwaukee 18. Atlanta 19. Cleveland 20. Los Angeles 21. Miami 22. Long Beach 23. San Diego 24. Detroit 25. Columbus 26. Albuquerque 27. Austin 28. Raleigh 29. Colorado Springs 30. Mesa 31. Omaha 32. San Jose 33. Louisville 34. Fresno 35. Virginia Beach 36. Tulsa 37. Houston 38. Phoenix 39. Indianapolis 40. Las Vegas 41. Kansas City, MO 42. El Paso 43. Memphis 44. Charlotte 45. San Antonio 46. Arlington, TX 47. Nashville 48. Jacksonville 49. Dallas 50. Oklahoma City 51. Fort Worth CITIES
(2.86%). Residents of major U.S. cities are 1.7 times more likely to walk or bi-cycle to work than the national average. According to the 2009 National House-hold Travel Survey (NHTS) 1.0% of all trips are by bicycle and 10.5% of all trips are by foot nationwide. It is diffi-cult to determine bicycling and walking mode share for all trips at the state and city levels because of small sample sizes of NHTS.
Bicycle and pedestrian commuters are generally distributed proportion-ately among ethnic groups in the U.S., according to the 2009 ACS. Greater disparities are found among genders. According to the 2009 NHTS, 49% of walking trips are men and 51% are female, yet among bicycle trips, 76% are male and only 24% are female. A look at age reveals that while walking is gener-ally distributed proportionately among age groups, youth under age 16 make up 39% of bicycle trips. This age group accounts for just 21% of the population. Safety
In 2009, 4,092 pedestrians and 630 bicy-clists were killed in traffic. This is down significantly from 2005 when 4,892 pe-destrians and 786 bicyclists were traffic fatality victims. While overall numbers of bicycle and pedestrian fatalities are declining, pedestrians and bicyclists are still at a disproportionate risk for being a victim of a traffic fatality. Although just 10.5% of trips in the U.S. are by foot and 1.0% are by bicycle, 11.7% of traffic fatalities are pedestrians and 1.8% are bicyclists. In major U.S. cities, 12.7% of trips are by foot and 1.1% are by bicycle,
Source: 2007-2009 ACS Notes: This ranking is based on the combined bike and walk to work share from the 2007-2009 ACS. The number one position indicates the state and city with the highest share of commuters who commute by bicycle or foot. View graphs illustrating this
1. Boston 2. Washington, DC 3. San Francisco 4. Seattle 5. New York 6. Portland, OR 7. Minneapolis 8. Philadelphia 9. Honolulu 10. New Orleans
2
3
4
1
5
6
7
UN DER ST ANDIN GThe amount of definitions and resources about walkability make defining the term a difficult task. The
report, What Defines Walkability:
Walking Behavior Correlates, by
Steven Spoon discusses the confusion with the term walkability. It reviews much of the literature that makes walkability such an ambiguous term. As stated in the report, “A major research dilemma concerning the literature in this field is that it does not adequately provide a clear answer
to what is the true definition of
walkability” (Spoon, 2005, 7).
The main issue with defining walkability is the amount of definitions that exist. There are now so many resources that provide walkability definitions and guidelines, that finding a true definition is difficult.
Some of the resources today that provide descriptions of walkability are:
WalkScore
America Walks
Walk Steps
Alliance for Biking
and Walking (BWA)
Smart Growth Network (SGN)
Partnership for
Sustainable Communities
Project For Public Spaces (PPS)
International Making
Cities Livable (IMCL)
Walkable Communities, Inc.
walk to goods and services but also defines many components and strategies of walkable
neighborhoods (Sandt, 2008, v).
Walksteps: And another resource, walksteps, defines 6 walkability tactic categories for creating walkable communities which are: advocacy, policy, land use, design and engineering, encouragement and education, and enforcement. Walk Score: Walk Score, a primary
resource for understanding the current walkability of any city, establishes 7 components that make a neighborhood walkable: A center, people (residential density), mixed income/use, parks and public space, pedestrian design, schools and workplaces, and complete
streets (Walk Score, 2013).
FHWA: The FHWA defines a walkable community as one where it is easy and safe to
Pedestrian and Bicycle
Information Center (PBIC)
Walkable and Livable Communities
Institute (WALC)
Partnership for a
Walkable America (PWA)
Walkshed
Federal Highway
Administration (FHWA)
Active Living Research
International Federation of
Pedestrians (IFP)
Walk 21
2
3
4
1
5
6
7
UN DER ST ANDIN GAs shown through the definitions above, resources today define walkability with components, separating out elements that make a place walkable. One issue with this process is the discrepancy between different elements. While the numerous components have similar themes, research found that many checklists neglect the complexities of the social environment and
community behavior (Adams et al. 2013,
2). Various walkability definitions also
separate components of walkability
that are not applicable to every site. Several elements that are described as components of walkability, can be described as subcategories that relate to a larger characteristic. Examples of these current walkability gaps are described through
current walkability studies. Further information on these resources is described in Appendix 2-2.
Social Restrictions: A study from Columbia University focuses strictly on physical components
of walkability, utilizing a Principal Components Analysis to estimate the effects of walkability on neighborhoods. It identifies ten neighborhood walkability items: Population Density, Subway stops, Bus stops, Land-use mix, Retail floor area ratio, Intersection Density, Residential units / building area, Residential units / land area, and Percent commercial land use, to measure the walkability
of neighborhoods (Michael
D.M. Bader et al. 2009)
use characteristics (University of
British Columbia, 2013). This leaves
out all other factors that can affect walkability and is not tailored for suburban conditions.
local streets, especially in rural and suburban areas. Which means the street view applicability is limited to more urban and developed zones.
(Andrew et.al. 2011).
Narrow Scope: The Walkability Index from UBC lists four
walkability components: residential density, commercial density, land use mix, and street connectivity, which all deal with different land Urban Limitations: Another
interesting study from Columbia University evaluated the feasibility of using Google Street View to measure walkability. While the results showed that walkability audits could be performed from google street view, it also noted that google street view has limitations when dealing with temporal visibility and can be unstable. Google street view is also not available for many small collector or
2
3
4
1
5
6
7
UN DER ST ANDIN GEach of the strategies described leave out an element or two that are considered vital in measuring the overall walkability of an area within other resources.
Resources such as the WALC walkability workbook, Walksteps Steps to a walkable community online tool, the Walkability Checklist, and the CDC Walkability Audit Tool, each have different factors and measures to identify and measure walkability. Through an analysis of
these walkability standards and checklists, three gaps of current resources have been revealed:
Audits only pertaining to physical
characteristics of walkability.
Checklists and strategies that focus
on urban conditions.
Incomplete checklists leaving out
community/social concerns.
The report, A Proposed Walkability
Strategy for Edmonton, illustrates
a more complete understanding of walkability segregated into four primary parts: quality of journey, pedestrian infrastructure, urban form, and policies and programs
(Stantec Consulting Ltd. 2010). Those four
elements are then broken down into subcategories that can be measured. This model creates an overarching theme that can be applied for many definitions but still segregates approaches into 47 strategies
and model should be applied for consistency across larger jurisdictions. Understanding the need for a
comprehensive strategy that can be flexible for multiple locations this project has identified five common components of walkability: Connectivity Urban Form Social Aspects Pedestrian Infrastructure Pedestrian Experience
physical environments of different communities, walkability variables can be modified to fit each environment.
As stated in the Creating Walkable
Communities Handbook, “There are
various ways to define what we mean by ‘walkable’. Each local community should consider a definition that is
appropriate for itself” (BFA 1998, 2).
While tailoring walkable components, to specific communities is important for understanding specific site conditions, an overall definition as shown in the report which is
attached in Appendix A2.3. Learning from the previous models, the three gaps of current resources need to be filled in order fully comprehend walkability and identify strategies for improvement. The proposed walkability strategy for Edmonton, Alberta illustrates how walkability components can be objective yet tailor to a specific communities needs. Due to the different social and
2
3
4
1
5
6
7
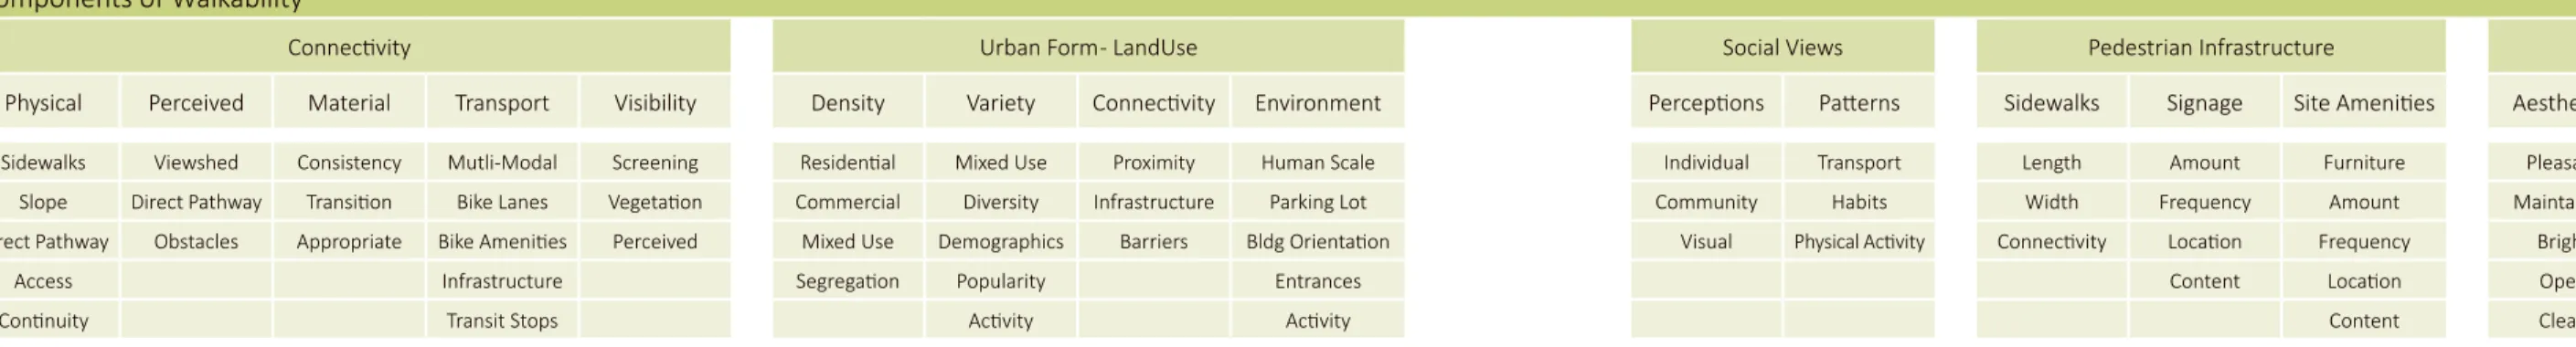
UN DER ST ANDIN GThese five common components are needed elements of walkability for every site. They are simplified variables from established checklists that fill the gaps in current strategies today. The main/
overlapping variables of established checklists were narrowed down important elements to these five components. Each variable relates to one another and can influence
the walkable environment for better or worse. This project analyzes how these components affect current walkable conditions along the Indian Creek Trail to identify
conditions. This project takes the five components along the Indian Creek Trail to analyze current conditions and identify opportunities and constraints for improvement. Walkability is simply a measure
of how welcoming an area is for walking and walkability is established by the five components of walkability that affect walkable opportunities for improvement.
Figure 2-3 illustrates the five components of walkability and the subcategories included in each element.
COMPONENTS OF WALKABILITY
Components of Walkability
Connectivity Urban Form - LandUse Social Views Pedestrian Infrastructure Pedestrian Environment
Physical Perceived Material Transport Visibility Density Variety Connectivity Environment Perceptions Patterns Sidewalks Signage Site Amenities Aesthetics Safety Comfort Scale Orientation
Sidewalks Viewshed Consistency Mutli-Modal Screening Residential Mixed Use Proximity Human Scale Individual Transport Length Amount Furniture Pleasant Security Scale Buildings To Sidewalks
Slope Direct Pathway Transition Bike Lanes Vegetation Commercial Diversity Infrastructure Parking Lot Community Habits Width Frequency Amount Maintained Lighting Amenities Sidewalks To Roads
Direct Pathway Obstacles Appropriate Bike Amenities Perceived Mixed Use Demographics Barriers Bldg Orientation Visual Physical Activity Connectivity Location Frequency Bright Separation Location Vegetation Parking Lots
Access Infrastructure Segregation Popularity Entrances Content Location Open Visibility Combination
2
3
4
1
5
6
7
UN DER ST ANDIN GThere are many elements that make creating a walkable environment in suburbia difficult to accomplish. In suburbia, alternative forms of transportation are made difficult due to leap frog development which has created an overabundance of personal vehicle use and hazardous
pedestrian environments (Untermann
1984, 173). Leap frog development is
characterized by segregated land use patterns that are located far from
neighborhood centers (Holcombe,
Randall 1999). These suburban patterns
affect all components of walkability and limit the opportunities of creating a walkable environment. The issue of
sprawled development, transportation patterns, and suburban car culture
hinder typical redevelopment/ walkability solutions. Each issue affects the other and makes many retrofitting techniques implausible.
Development Codes
Land Use Segregation
Office Parks, Residential
Subdivisions, Big Box centers
Open Space Management
Edge Cities
Vacant, Underutilized Lots
Absence of
Neighborhood Structure
Limited Pedestrian
Infrastructure
Limited Transportation Alternatives
Combined conditions from Sprawl Repair Manual, Suburban Gridlock, Retrofitting Suburbia, and Suburban Transformations.
Sprawled Land Use Patterns
The layout of each suburban community differs as does the magnitude of each unsustainable issue. Below is a list of many
constraints within sprawled suburban communities that prohibit walkability.
Isolated Development
Strip Retail Centers
Abundance of Highways
Vehicle Oriented Planning
Intricate/Expansive Road Network
Single-Use Zoning Laws
2
3
4
1
5
6
7
UN DER ST ANDIN G“Remaking our sprawled suburbs, with their enormous footprints, shoddy construction, hastily put up infrastructure, and dying malls is shaping up to be the biggest urban revitalization challenge of modern times”
(Dunham Jones, 2011, vi.)
Patterns of development due to zoning and development practices have created segregated office parks, big box centers, strip retail malls, and other places that characterize the suburban form. Measures need to be made to change these patterns and
allow for suburban change, otherwise a connected, walkable community
is implausible (Schiller,
Bruun, & Kenworthy, 2010, 237-253).
The Smart Growth Network recently studied 221 cities throughout the US and established sprawl index ratings that rank cities from the least sprawled area to the most sprawled area. The Kansas City metropolitan area ranked 178th out
of 221, leaving it the bottom fourth of all cities studied. Particularly low scores were found in the activity centering and density categories
(Smart Growth Network, 2014). Specifically,
the suburban cities of Overland Park, Olathe, Leawood, and South KCMO, illustrate those sprawled and disconnected urban patterns as shown through figures 2-4, 2-5 and 2-6. The land use map of figure 2-4 clearly depicts the low dense residential and segregated land uses that create unwalkable conditions.
Legend
Indian Creek Trail StateLine Highways MajorRoads Streets Railroads IndianCreek Commercial (High) Commercial (Low) Commercial (Urban) Commercial (Very High) Developed Indust./Bus. Park (High) Indust./Bus. Park (Low) Mixed Use (High) Mixed Use (Low) Mixed Use (Urban) Office (High) Office (Low) Office (Med) Office (Very High) Parks, Open Space Public/Semipublic (High) Public/Semipublic (Low) Public/Semipublic (Very High) ROW ROW RR Residential 120 Residential 40 Residential MF High Residential MF Low Residential MF Low-Med Residential MF Medium Residential MF Very High Residential SF Large Lot Residential SF Low Residential SF Medium Residential SF Very Low Rural Policy Area Rural Residential Urban Fringe Vacant/Ag
2
3
4
1
5
6
7
UN DER ST ANDIN GLegend
Indian Creek Trail StateLine IndianCreek Highways MajorRoads Streets Railroads PopulationDensity 0 - 1 1 - 2 2 - 6 6 - 12 12- 45
Low Rural Density Rural Density Low Density Med-Low Density Medium Density
The distribution of uses and the intensities of activities taking place, determine how mobile a place really is, showing that all types of transport are reliant on patterns of development
(Cox 2010, 19.) (Cuervo, 1986, 49.)
Current trends discourage dense, mixed use communities within suburbia, which creates an unsafe pedestrian environment. Along the Indian Creek Trail densities are low which do not allow for a variety of activities to take place. Figures 2-5 and 2-6 illustrates the low dense conditions.
Figure 2-5 | Residential Density Map (Patterson, 2013) Figure 2-6 | Distribution of Density Map (Patterson, 2013)
Figure 2-7 | Image of Low Dense Land Use Separated by Large Roads (Patterson, 2013)
I I InnnnnddddiiiiaaannnnnCCCCCCCCCCCCCCCCCCCCCCCCCCCCCCCCCCCCCCCCCCCCCCCCCCCCCCCCCCCCCCCCCCCCCCCCCCCCrrrrreeeeeeekkkkTTTTTTrrrrrrrraaaaaaaaaaaaaaaaaaaaaaaaaaaaaaaaaaaaaaaaaaaaaaaaaaaaaaaaaaaaaaaaaaaaaaaaaaaaaaaaaaaaaaaaaiiiiiiiiiiiiiiiiiiilllll S S S S SttttaaatteeeeeeeeeeeeeeeeeeeeeeeeeeeeeeeeeeeeeeeeeeeeeeeLLiLLLLLnneeee S S S S S S S S S S S S S S S S S S S S S S S S S S S S S S S S S S S S S S S StttataaaaaattttttttttttttttttteeeeeeeeeeeeeeeeeeeeeeeeeeeeeeeeeeeeeeeeeeeeeeeeeeeeeeeeeeLLLLLinnnneeeee I I I InnnnnnnnnnnnnnnnnnnnnnnnnnnnndddddddddddddddddddiddddddddddddddddddddddddddddddddddddddddddddddddddiiiiiiiiiiiiiiiiiiiiiiiiiiiiiiiiiiiiiiiiiiiiiiiiiiiiaaaannnCrCCCCCrrreeeeeeeeeeekkkkk
a a a a a a a a a a a a a a a a a a a a ayyyyyysyssssssssssssssssssssssssssssssssssssssssss M M M M M M M M M M M M M M M M M M M M M M M M M M M M M M M M M M M M M M M M M M M M M M M M M M M M MaaaaaaaaaaaaaaaaajjojooorrrRRRRoooaaaaadddddddddddddddsdddddddddddddddddddsssssssssssssssss S S S S S S S S S S S S S S S S S S S S S S S S S S S S S S S S S S S S S S S S S S S S S S S S S S S S S S S S S S S S S S S S S S S S S S Stttttrrrreeeeeettsss R R R R R R R R R R R R R R R R R R R R R R R R R Rill dd R R R R R R R R R R R R R R R R R R R R R R R R R R R R R R R R Raaaaaaiillrrrooooaaaaddsssssssssssssssssssssssssssssssss 0 0 0 0 0--11111 1 1 1---2222222 2 2 2 2 2--666666 6 6 6 6 6 6 6 6 6 6 6 6 6 6 6 6 6 6 6 6 6 6 6 6 6 6 6 6 6 6 6 6---1-11111111111111111111111111166666666666666666666666666666666666666 1 1 1 1 16666---444445555 ay a ay a I 35 US 69 I 435 US 7 1 135th K 10 M et ca lf M 150 Santa Fe K 7 Pa rk er Outer US 16 9 147th US 56 Ha rri so n I 435 K 10 M 1 50 US 71 I 35 I 435 US 169 I 435 I 35 M 150 US 7 1 US 71 I 35 US 6 9 1 69
Ü
LegendIndian Creek Trail Buffer Indian Creek Trail StateLine Highways MajorRoads Railroads ! Major Buisnesses
5 Miles
Crossing 7 Major Roads and 2 Highways
2
3
4
1
5
6
7
UN DER ST ANDIN G“The marginalization of transport studies to a subset if planners and engineers is invisible to the field
of development studies...” (Cox
2010, 19.) Especially in suburbia,
vehicle oriented development is prevalent and ignores the pedestrian environment as shown in figures 2-8 and 2-9. Better connections need to be made with transport planning and development to allow for greater connectivity. The suburban cities surrounding the Indian Creek Trail are car oriented. The primary reason for the segregated land use
network is due to current travel and development patterns. The massive expanse of road networks, create large distances between destinations that make it very difficult for walking. The vehicle oriented development also creates environments without pedestrian infrastructure. Large expansive parking lots separate sidewalks from buildings and create an unfriendly environment for pedestrians. Figure 2-10 illustrates how development is centered around major intersections and neglects the pedestrian environment.
While transport is dependent on development, current transport habits have influenced development
patterns. As stated in Skinny Streets
and Green Neighborhoods, “Traffic
oriented street designs coupled with widely dispersed land uses have reduced pedestrian travel capabilities and increased car
traffic mileage” (Girling, 2005, 74-75),
illustrating how current transport trends have decreased walkability and magnified the sprawl issue. IIInndnnndddiiiiaaannCnnnCCCCCCCCCCCCCCCCCCCCCrCCCCCCCCCCCCCCCCCCCCCCCCCCCCCCCCCCCCCCCCCCCCCCCCCCCCCCrrerreeeeeekkkkTrTTTTTrrrarrrraaaaaaaaaaaaaaaaaaaaaaaaiiiaaaaaaaaaaaaaaaaaaaaaaaaaaaaaaaaaaaaaaaaaaaaaaaaaaaaaaaaaaaaaaaaiiiiiiiiiiiiiiiilllll
S S S S SttttaaatteeeeeeeeeeeeeeeeeeeeeeLeeeeeeeeeeeeeeeeeeeeeeeeeLLinLLLLneeee S S S S S S S S S S S S S S S S S S S S S S S S S S S S S S S S S S S S S S S SttttaaaaaaattttttttttttttttttteeeeeeeeeeeeeeeeeeeeeeeeeeeeeeeeeeeeeeeeeeeeeeeeeeeeeeeeeeLLLLLinnnneeeee IIIInnnnnnnnnnnnnnnnnnnnnnnnnnnnndddddddddddddddddddddddddddddddddddddddddddddddddddddddddddddddddddddiiiiiiiiiiiiiiiiiiiiiiiiiiiiiiiiiiiiiiiiiiiiiiiiiiiiiaaaannnCCrrCCCCrreeeeeeeeeeekkkkk
a a a a a a a a a a a a a a a a a a a a ayyyyyysyssssssssssssssssssssssssssssssssssssssssss M M M M M M M M M M M M M M M M M M M M M M M M M M M M M M M M M M M M M M M M M M M M M M M M M M M M MaajaaaaaaaaaaaaaaajjoooorrrRRRRoooaaaaaddddddddddddddddddddddddddddddddddssssssssssssssssss S S S S S S S S S S S S S S S S S S S S S S S S S S S S S S S S S S S S S S S S S S S S S S S S S S S S S S S S S S S S S S S S S S S S S S Stttttrrrreeeeeettsss R R R R R R R R R R R R R R R R R R R R R R R R R Rill dd R R R R R R R R R R R R R R R R R R R R R R R R R R R R R R R R Raaaaaiilalrorroooaaaaddsssssssssssssssssssssssssssssssss 0 0 0 0 0--11111 1 1 1---2222222 2 2 2 2 2--666666 6 6 6 6 6 6 6 6 6 6 6 6 6 6 6 6 6 6 6 6 6 6 6 6 6 6 6 6 6 6 6 6---1-11111111111111111111111111166666666666666666666666666666666666666 1 1 1 1 16666---444445555 ay a ay a I 35 US 69 I 435 US 71 135th K 10 M et ca lf M 150 Santa Fe K 7 Pa rk er Outer US 16 9 147th US 56 Ha rri so n I 435 K 10 M 1 50 US 71 I 35 I 435 US 16 9 I 435 I 35 M 150 US 7 1 US 71 I 35 US 6 9 US 1 69
Ü
LegendIndian Creek Trail Buffer Indian Creek Trail StateLine Highways MajorRoads Railroads ! Major Buisnesses
2
3
4
1
5
6
7
UN DER ST ANDIN GAmerican traffic planning is catered almost exclusively to the automobile, and has neglected the pedestrian
environment (Untermann 1984, 4.) Today,
‘more efficient transit’ is defined by standards that carry people at higher speeds and across greater distances, instead of focusing on the degree of which transport aids in access for
basic needs (Cox 2010, 10).
Vehicles extend our range of movement and separate people
from their destinations (Cox 2010, 13.)
Transport planning is advancing the issue and creating greater disconnect within the suburban form. Cox states, “Typical transportation enhancements can create greater comfort or safety, but do not alter the fundamental problem of urban commuting traffic. They instead isolate the individual user from the reality of
space in which we move”
(Cox 2010, 25).
Change in how
transportation is planned and perceived is needed.
Current transportation standards cause the underlying issues of suburban walkability and continue to allow the personal vehicle to dominate the landscape and make all other forms of transit obsolete.
Multi-modal transport is a major factor of walkability
that increases connectivity and opportunity for
“Studies of transit are oriented largely around the static destination
and starting points... Rather than being structured around
the processes and experiences of motion...”
Transport Patterns
Figure 2-12 | Image of Poor Bus Stop Conditions (Patterson, 2013)
Legend
IndianCreek
Ü
Legend
Indian Creek Trail Buffer Indian Creek Trail StateLine Highways MajorRoads Railroads Transit Routes # Transit Stops Bus Stops Bus Routes
2
3
4
1
5
6
7
UN DER ST ANDIN GThe personal vehicle has restructured the economic, geographic, and social
relations of the urban fabric (Cox 2010,
24.) Creating a network of people
that only transpire from one place to the next without experiencing
the places in-between. (Cox 2010,
24.) The urban form has since been
planned around this auto transport society and created a great walkability disconnect. The vehicular scale of elements, as shown in figure 2-13 and 2-14 creates a great barrier to pedestrian travel that infrastructure transportation amenities and roadway
conditions that make other forms of transit unwelcoming. Current planning methods for multi-modal transport do not relate to suburban areas, which is the reason why typical alternative transit methods are inefficient in suburbia.
The transportation industry has failed to adapt to the changing suburban needs and continues to utilize existing urban practices, expecting to see
a different outcome (Cervero, 1986,
104) (Lukez 2007, 93.)
communities. Figure 2-11 shows the limited about of alternative transportation options that exist in the Kansas City area. Figure 2-12 and also illustrates the poor conditions of
2
3
4
1
5
6
7
UN DER ST ANDIN Galone cannot fix. Many sidewalks throughout the study area are also in poor condition, disconnected, or non-existent. If sidewalks are present they are generally alongside major roads, end at the edge of parking lots, and do not connect to other pathways. This limitation creates a dangerous environment for pedestrian connectivity as shown in figures 2-15 and 2-16. In some cases sidewalks are only even present along 30% of roadways. Figure 2-17 shows
the limited amount of sidewalks that exist in the KCMO region.
Other forms of infrastructure such as benches, bus stops, trash cans, and more do not exist in this area. Where some infrastructure does exist, there are no design standards or cohesiveness to attract pedestrian activity. There are no areas for pedestrians to rest, take shelter, or connect to other forms of transit. With the segregated land use pattern and expansive road network, these
issues even further hinder walkability. These conditions are shown by pedestrians in figure 2-18.
The auto oriented landscape has since created the reliance on personal vehicles which is coupled with habitual patterns
of use and expectations (Cox 2010, 25).
People are conditioned to drive for almost every trip and have forgotten that some trips are easier by foot or bike
(Untermann 1984, 23).
I 3
5
US
69
I 435
US
7
1
135th
K 10
M
et
ca
lf
M 150
Santa Fe
M 58
K 7
Pa
rk
er
Outer
US
16
9
147th
US 56
Ha
rri
so
n
I 435
K 10
M
1
50
US
71
I 3
5
I 4
35
US
16
9
I 4
35
I 3
5
M 150
US
7
1
US
71
I 35
US
6
9
US
1
69
12,000
6,000
0
12,000
Feet
Ü
Legend
Indian Creek Trail Buffer
Indian Creek Trail
StateLine
Highways
MajorRoads
Railroads
Olathe_sidewalks
KCMO_sidewalks
Figure 2-15 | Image of Typical Dead End Sidewalk (Patterson, 2014)
Figure 2-16 | Image of Cow Path Connecting Sidewalks near Road (Patterson, 2014)
Figure 2-17 | Map of Limited Sidewalks in KCMO (Patterson, 2013)
Figure 2-18 | Image of Pedestrians Waiting at Bus Stops (Patterson, 2014)
2
3
4
1
5
6
7
UN DER ST ANDIN GComfort, price, perception of time, and safety are primary reasons people choose to drive. Many don’t even
consider that other forms of transit are feasible
(Springer 2005, 225.) People
get in their car and drive everywhere, even just across the street. This is due to development patterns,
zoning regulations, car dependency, and sprawl. In suburbia people are dependent on cars because they
rarely have any other option (Schiller,
Brunn, & Kenworthy, 2010, 26). Because
of the suburban layout, automobile dependency cannot change under current conditions, so measures need to be made to alter these habits and allow for change.
The habit of suburban transport has turned into a mindset that can be very difficult to modify. People like their
cars. Cars provide the freedom other transit methods do not, and if it is affordable people will choose to drive
(Lukez, 2007, 14.) Figure 2-19 illustrates
the current travel preferences surrounding the Indian Creek Trail.
perceptions of walkability may remain the same. Over 90% of the Kansas City population drives to work everyday
(Alliance 2012.) That is 10% greater
than the overall population in the US. Showing that there are potentially more issues with the social and physical environment of this area than many throughout the country.
environmental attributes do not consistently reflect objectively assessed attributes, and both appear to have differential effects on physical activity behavior”
(McCormack , 2008, 401).
There are many different reasons why people will not walk and different patterns can have different affects on different people. Additionally, even if the physical environment promotes walkable habits, social habits and The complexities of the social
environment and community behavior alter the perception of a walkable place. The report, Objective Versus Perceived Walking
Distances to Destinations, concludes
a study on how different attributes influence walking behavior. As stated in the report,
“Perceived and objective distances to certain types of destinations are differentially associated with walking behavior. Perceived
Car Culture
“The typical standards of fast movement and ability to travel far distances creates
a perceived notion of flexibility and efficiency”
(Cox 2010, 17).
Transport Statistics of Focus Area Population
20 min Average Travel Time To Work 90.8% Primary Mode Of Transport = Car 84.3% Drove Alone
0.2% Biked
1% Walked
Figure 2-19 | Focus Area Statistics Combined from the U.S. Census Bureau City Data