Introduction
The microstructure of financial market is the discipline that studies the modalities of the operational functioning of financial market and the mechanisms that lead to the determination of prices at which stocks are exchanged. Thus, it discusses the impact of trading mechanisms on the pattern of financial market. In this paper, we will focus on the impact of trading mecha
-nisms, which differ from a market to other, on return’s volatility and market efficiency.
Some stock markets apply the call market, in which trading and orders’ executions oc
-cur at regular time intervals. All transactions are conducted at a single price determined to balance the sales and purchase orders. It is the only mechanism of exchange in some markets (The Arizona Stock Exchange, Bursa Malaysia, and Taiwan Stock Exchange).The call market can be organized according to three modali
-ties. The first one is the auction market (used in the New York Stock Exchange to determine opening prices), in which sellers and buyers
are physically together in one place. For each stock, negotiators announce their offers or re
-quests. This process continues until the discov
-ery of the equilibrium price. The second modal
-ity allows participants to submit their bids and asks, without revealing their offers, until reach
-ing the equilibrium price. In the third modality (used for the determination of the opening price in the Euronext Paris and in the Tokyo Stock Exchange), the buyers and sellers offers are re
-vealed continuously to the market during their accumulation. The equilibrium price is calcu
-lated each time a new order arrives and until the auction time. The call mechanism is the main mechanism used by governments to sell their bonds and bills. It is also used to trade the least active securities in stock markets, among oth
-ers, the Deutsche Börse, Euronext Paris, Bolsa Mexicana de Valores, and Casablanca Stock Exchange (Hillion et al., 1997).
Other stock markets apply the continuous mechanism, in which trading and transactions are executed continuously. When this mecha
-nism is used, an agent can send its order at
Casablanca Stock Exchange
El Mehdi Ferrouhi* and Elhadj Ezzahid**
Mohammed V University, Rabat, Morocco
This paper studies the impact of the stock market continuity on the returns volatility and on the market efficiency in the Casablanca Stock Exchange. For the most active stocks, the trading mecha
-nism used is the continuous market which is preceded by a call market pre opening session. Results obtained concerning return volatility and efficiency under the two trading mechanisms show that the continuous market returns are more volatile than the call market returns and 50% of stocks studied show independence between variations.
Keywords: Trading mechanism, microstructure, call market, continuous market, efficiency, volatility
any time. This order is executed whenever it finds a counterpart. Transactions in continuous mechanism are bilateral, unlike the call mar
-kets where transactions are multilateral. In a continuous market, traders can observe bid and ask quotations, transaction prices, trading vol
-ume during the trading day. This enables them to assess the market conditions before placing their orders. Furthermore, the posting of quotes in a continuous market gives traders the option of placing market orders and ensuring execu
-tion of their trades (Chandrasekhar, 2009). The well known continuous stock markets are: the Euronext Paris, the Tokyo Stock Exchange, the Toronto Stock Exchange, the New York Stock Exchange, NASDAQ, and the London Stock Exchange. Generally, the continuous market is reserved to the most active shares. Nowadays, most major markets are continuous with an auc
-tion pre opening session. Other stock markets such as the Hong Kong Stock Exchange, the Singapore Exchange, and the Indonesia Stock Exchange use the continuous modality for the entire trading day.
The Casablanca Stock Exchange (CSE) is considered as one of the most dynamic stock markets in Middle East and North Africa region (MENA) and is part of the MSCI Emerging Markets indices. The acceptance of the Moroc
-can Stock Market to these indices was the result of a multitude of reforms and renovations that have affected the financial system.
The Casablanca Stock Exchange was es
-tablished in 1929 and it was known as Office de Compensation des Valeurs Mobilières (The
Office for Clearing of Transferable Securities). With the reforms of September 1993, the CSE was privatized and is ruled as an association of brokerage firms. The CSE trading hours are from 10:00 a.m until 3:30 p.m between Monday and Friday and transactions take either place on the trading floor - called Marché Officiel - or the
upstairs OTC market - called Cession Directe (Ghysels and Cherkaoui, 1999).
The CSE, also known as the Moroccan Stock Exchange, is managed by la Bourse de Casablanca, whose purpose is to meet different actor’s requirements and to make the Moroc
-can stock market the best in Africa. The mo
-nopoly of brokerage is held by 17 brokerage firms (CDVM, 2009), whose main objective is to manage security’s portfolios, to animate the stock market, to execute transactions, and to advise companies wanting to go Initial Public Offering. These brokerage firms are represent
-ed among public authorities through the Asso
-ciation of Professional Brokerage Firms (Dahir No. 1-93-211, Chapter II, Article 82).
The national central securities deposi
-tory is MAROCLEAR and the policeman of Casablanca Stock Exchange is the Securities Board (Conseil Déontologique des Valeurs CDVM) whose main objective is to ensure the protection of public savings in
-vested in securities and the dissemination of legal information and regulatory requirements. Considered as a department of the Ministry of Economy and Finance which is involved in the enactment of laws relating to the stock market, the CDVM also ensures transparency and secu
-rity of the Moroccan Stock Market as well as compliance with laws and regulations govern
-ing the market (Official Bulletin, K-ingdom Of Morocco, 5th June 2008).
Despite the low number of listed companies (75 companies listed in Casablanca Stock Ex
-change compared to 3,200 in NASDAQ, 2,764 in NYSE, 472 in the Johannesburg Stock Ex
-change, 378 in Cairo and Alexandria Stock Exchange, and 233 in the Nigerian Stock Ex
-change) that reduces the number of assets on the market and cannot meet the high demand due to the diversity of market players, the Casa
-blanca Stock Exchange is considered as one of the most important and the most dynamic stock markets in Africa. The operations on securities in Casablanca Stock Exchange are undertaken under on the NSC (Nouveau Système de Co
-tation or New Listing System) platform V900 used by several other stock markets such as Eu
-ronext, Dubai, and Tunis. This system allows the automatic routing of trade orders and con
-clusion of transactions according to the market rules.
Transaction in the Casablanca Stock Ex
-change can take place according to two trading mechanisms: the call market and the continu
depends on the liquidity of the share. Thus, the most active shares are traded under the continu
-ous market with a pre opening auction session, and the least active ones are traded under the call market.
The first session in the Casablanca Stock Ex
-change begins at 10:00 a.m. In the call market, orders are batched together for simultaneous execution at a single price. The price is deter
-mined through an algorithm that maximizes the number of trades that can be executed, with a time priority rule or a prorate system to de
-termine which orders are executed first. The number of auctions on the day depends on the liquidity of the stock. It can be done three times on the day (10:00 a.m, 1:00 pm, and 3:00 p.m). The auction is done electronically (using the Trading System NSC). Orders are accumulated in an order book run by a computer that calcu
-lates the equilibrium price and the session close at 3:35 p.m.
In the continuous market (reserved to the most active stocks), orders are processed con
-tinuously and thus produce changing prices. The continuous market is preceded by an auc
-tion pre opening session. After the beginning of the session at 11:00 a.m and until the pre-closure of the market, the confrontation of the orders is done continuously and electronically. If this confrontation is possible, we obtain con
-tinuously a new price for each stock and the transactions accomplishment at this price is possible.
The pre closing session begins at 3:25 p.m. During this period, brokers transmit their orders to the electronic trading system. The theoretical value of the stock is continu
-ously calculated each time a new order is en
-tered, modified or canceled. The session is closed at 3:30 p.m. At this time, for each stock, the system confronts orders previously record
-ed which allow the determination of a closing
price
In this paper, we will compare the price behavior under the two mechanisms (the con
-tinuous market and the call market) of heav
-ily traded stocks in the Casablanca Stock Ex
-change. This paper is structured as follow. After explaining the Casablanca Stock Exchange
and its trading mechanisms, literature review is presented in the second section. In the third section, we will present the methodology and dataset used in this study. Section 4 is dedicated to the presentation of results. The last section serves to conclude.
Literature Review
Since 1980, researchers were interested to analyze the impact of trading mechanisms on volatility. Analyzing the price behavior of the components stocks of the Dow Jones Industrial Average, Amihud and Mendelson (1987) find that call market return variance (subject to the call method) was greater than continuous mar
-ket return variance (subject to the continuous method). In their analysis of Borsa Valori Di Milano (Milan Stock Exchange), Amihud et al. (1990) compare return volatilities for stocks over the same period but under different trad
-ing mechanisms (under the call market and the continuous market) and at different time of the trading day. They conclude that the call mar
-ket provides a more effective price discovery mechanism at the opening of the trading day than the continuous auction method.
The available studies that compare the ad
-vantages and disad-vantages of the call market and the continuous market conclude that the price is more stable in the call mechanism than in the continuous mechanism. This stability may be explained by the reduction of volatil
-ity in the call market in which, orders could not arrive randomly and continuously. In addition, as trading orders accumulate over a fixed time interval, the impact of a single large order be
-comes less severe (Chang et al., 1999). On the other side, the immediacy of orders’ execution and high liquidity are the main advantages of the continuous market.
Chang et al. (1990) obtain the standard de
-viation of 10 minutes return under two auction markets in the Taiwan Stock Exchange. They find that significant differences in volatility ex
-ist between the two trading methods, the con
-rificing liquidity and price discovery is more ef
-ficient in the call market than those in the con
-tinuous market.
Amihud and Mendelson (1987) and George and Hawing (1994) compare the volatility and efficiency of the call market and the continu
-ous market in NYSE and Tokyo market using respectively the variance and the first autocor
-relation of the call market returns and the con
-tinuous market returns. The results obtained show that the variance of the call market is higher than that of the continuous market, and the first-order autocorrelation of the call market returns are strongly negative than the continu
-ous market returns.
Derrabi and Agnaou (2009) use data about the Casablanca Stock Exchange to study the impact of continuous trading system versus fix
-ing system on liquidity, volatility, pric-ing er
-ror, and order flows. They remark that the call market is characterized by low market liquidity, low trading volume, low market capitalization, and high volatility. Their results show that the continuous system show better price determina
-tion than the fixing system.
Research Method
As indicated above, the main objective of this paper is to study the impact of the Casa
-blanca Stock Market trading continuity on re
-turn volatility and on the market efficiency, and
to examine the behavior of stock prices under the two trading mechanisms described above, the continuous trading mechanism and the call market. Thus, we calculate return volatil
-ity under both the continuous market and the call market and analyze the impact of different trading mechanism on return volatility. For the study of market efficiency, we apply Fama’s test which is designed to detect the first-order autocorrelation in order to verify the presence or the absence of the weak form of efficiency on our market.
In this study, we use the daily continuous price, P
C,t, recorded at the end of the continuous trading session and the daily call price, P
F,t, re-corded at the beginning of every session (under the call market). Consequently, the continuous market return and the call market return are re
-spectively defined by: RC,t = log (P
C,t) – log (PC,t-1) 1)
RF,t = log (P
F,t) – log (PF,t-1) 2) Accordingly, for each day, we measure two returns for each stock, one under the continuous market and one under the call market.
Volatility is a measure for the variation of the price of a financial instrument over time. The standard deviation of stock returns is often used to measure volatility. The equation used is:
, 3)
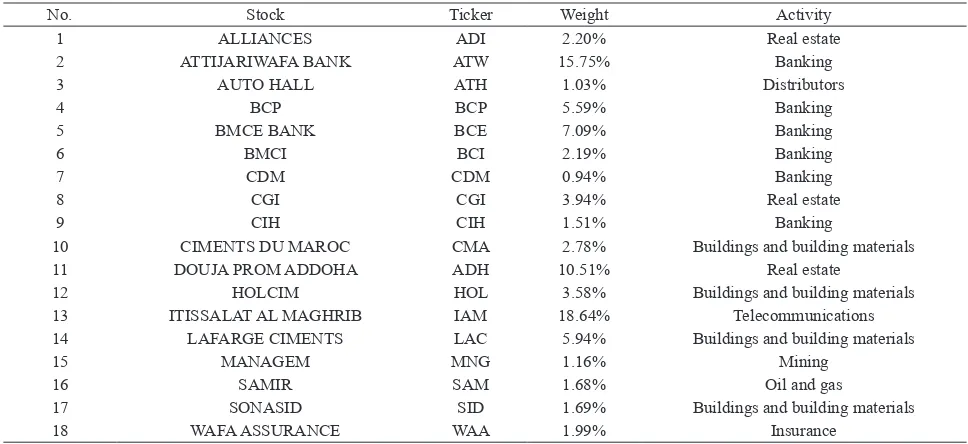
Table 1. Presentation of data: Stocks, weight, and activity of each stock
No. Stock Ticker Weight Activity
1 ALLIANCES ADI 2.20% Real estate
2 ATTIJARIWAFA BANK ATW 15.75% Banking
3 AUTO HALL ATH 1.03% Distributors
4 BCP BCP 5.59% Banking
5 BMCE BANK BCE 7.09% Banking
6 BMCI BCI 2.19% Banking
7 CDM CDM 0.94% Banking
8 CGI CGI 3.94% Real estate
9 CIH CIH 1.51% Banking
10 CIMENTS DU MAROC CMA 2.78% Buildings and building materials
11 DOUJA PROM ADDOHA ADH 10.51% Real estate
12 HOLCIM HOL 3.58% Buildings and building materials
13 ITISSALAT AL MAGHRIB IAM 18.64% Telecommunications
14 LAFARGE CIMENTS LAC 5.94% Buildings and building materials
15 MANAGEM MNG 1.16% Mining
16 SAMIR SAM 1.68% Oil and gas
17 SONASID SID 1.69% Buildings and building materials
The hypothesis of market efficiency is de
-veloped by Eugene Fama, who defines the ef
-ficient market as a market where there are large numbers of rational, profit-maximizers actively competing, with each trying to predict future market values of individual securities, and where the important current information is al
-most freely available to all participants (Fama, 1965). According to Fama (1970), an efficient market is also “a market in which prices always fully reflect available information”. The impli
-cation of the market efficiency is that “there is no way to use the information available at t-1 as the basis of a correct assessment of the ex
-pected return on security j which is other than its equilibrium expected value” (Fama, 1976), and thus means that there will be no serial cor
-relation.
The serial correlation is used to test the in
-dependence of the successive realizations and then, the weak form of efficiency. “The partial autocorrelation between two variables is the correlation that remains if the possible impact of all other random variables has been elimi
-nated” (Kirchgässner, 2007). The partial auto
-correlation coefficient is defined by: xt=ρk1x xt-k have been eliminated” (Kirchgässner, 2007). The first-order autocorrelation coefficient is the simple correlation of the first N-1 observa
-tions, x,t = 1,2,3…,N-1 and the next N-1 ob
-servations x,t = 2,3,4…,N-1. When the serial
correlation is absent, this means that there is in
-dependence between successive variations, and then it is a weak form efficient market. A serial correlation different from zero means that there is no independence between successive varia
-tions and the market is therefore not efficient. In his work, Kendall (Kendall and Hill, 1953) concludes that successive changes in a number of United Kingdom economic indexes (between 1928 and 1938), including shares and commodities, appeared to be random. The re
-sults of Fama for New York Stock Exchange price changes were similar to Kendall’s results
(the average of correlations coefficients was 0.026) (Broyles, 2003).
The data used in this study are drawn from the Casablanca Stock Exchange’s database. For the period 4th January 2010 - 31st December
2010, we selected individual stocks that were continuously traded under both the continuous and the call market for at least 120 days. This time period is chosen to avoid missing data in the stock return files and to exclude the period of the stock market crash of 2007. These criteria resulted in a sample of 18 stocks that are among the most important Moroccan “blue chips” from the total of 75 listed stocks in the Casa
-blanca Stock Exchange. During this period, these stocks accounted for more than 87.27% of the total trading volume in the Casablanca Stock Exchange. Table 1 presents explicitly the individual stocks used in this study, the weight, and the activity of each stock. The main activi
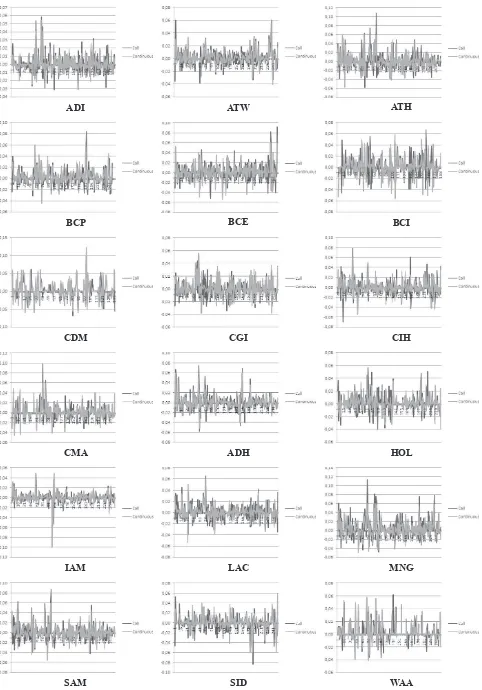
-ties of these companies are banking, buildings and building materials, real estate, oil and gas, holdings, and telecommunications. Figure 1 represents stock returns evolutions on the con
-tinuous market and the call market.
Result and Discussion
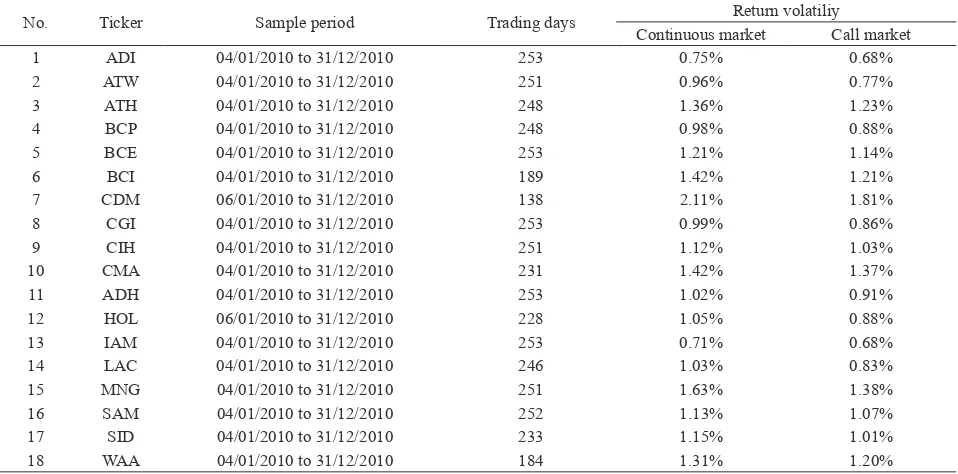
After measuring returns volatility of the Casablanca Stock Exchange stocks under the two trading mechanisms (the continuous mar
-ket and the call mar-ket), we remark that for the 18 values, the return’s volatility for continuous mechanism is higher than return’s volatility in call mechanism. The historical volatility in the continuous market varies between 0.71% and 2.11% versus a variation between 0.68% and 1.38% in the call market. We conclude that con
-tinuous market returns are more volatile than call market returns. This result confirms prec
-edent findings obtained on the New York Stock Exchange (Amihud and Mendelson, 1987), the Japanese Stock Market (Amihud and Mendel
-son, 1991) and a number of Asian stock mar
-kets: Hong Kong, Korea, Malaysia, Singapore, Taiwan and Thailand (Rhee and Chang, 1992). Table 2 shows return volatilities in the continu
ADI ATW ATH
BCP BCE BCI
CDM CGI CIH
CMA ADH HOL
IAM LAC MNG
SAM SID WAA
We then apply Fama’s test of first-order au
-tocorrelation to detect the presence or not of the weak form of efficiency. Applying this test using both continuous market and call mar
-ket returns for 30 New York Stock Exchange stock returns, Amihud and Mendelson find that most autocorrelation coefficients are positive (24 out of 30) with an average of 0.0464 for closing return series. The autocorrelation coef
-ficients of call market returns are negative (23 out of 30) averaging -0.0635. For the Shang Hai Stock Exchange (SHSE) stock returns (Lai et al., 1996), the results are different: the first-or
-der autocorrelation of both call market and con
-tinuous market are both negative not only for the most actively traded stocks but also for that of the least actively traded. This result is ex
-plained by considering the SHSE as an emerg
-ing stock market where the investors are much more speculative than those who invest in the developed financial markets.
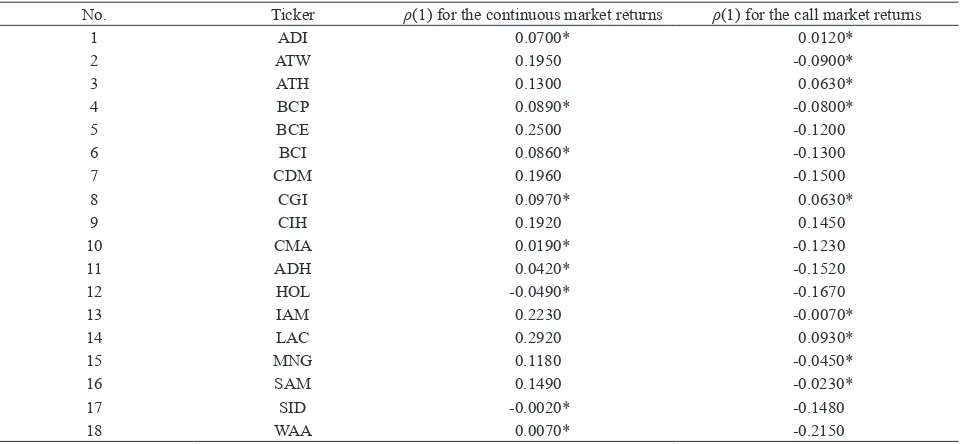
After the application of the first-order auto
-correlation to the Moroccan most active shares using both the continuous market returns and call market returns we find that, concerning the continuous market stock returns, almost all the autocorrelation coefficients (16 out of 18) are positive, with an average of 0.19 and that 9 stocks from 18 have an autocorrelation coef
-ficients significantly equal to zero at 5%. Con
-cerning the call market, 13 stock returns (out of 18) are characterized by a negative autocorrela
-tion coefficient, in opposite to the continuous market, with an average of -0.11 and 13 stocks from 18 have an autocorrelation coefficients significantly equal to zero at 5%.
The variation of more than 50% of stock re
-turns under the two trading mechanisms (9 on the continuous market and 13 on the call mar
-ket) is then not random and there is dependence between these variations. The second part of stock returns is characterized by an independ
-ence of variations, and, variations are then ran
-dom. Our hypothesis is that these results can be explained by the behavior of the investors in the Casablanca Stock Exchange. The immaturity of the Moroccan stock exchange may explain this divergence of results and the random behavior of some investors, in the opposite of other in
-vestors with a deterministic behavior.
Conclusion
This article studies the impact of trading mechanisms on return’s volatility and on the market efficiency in the Casablanca Stock Ex
-change. Normally, for the most active shares, trading in this market is done in the continuous
Table 2. Stocks, sample periods, and return volatility calculated for the continuous market and the call market
No. Ticker Sample period Trading days Continuous marketReturn volatiliyCall market
1 ADI 04/01/2010 to 31/12/2010 253 0.75% 0.68%
2 ATW 04/01/2010 to 31/12/2010 251 0.96% 0.77%
3 ATH 04/01/2010 to 31/12/2010 248 1.36% 1.23%
4 BCP 04/01/2010 to 31/12/2010 248 0.98% 0.88%
5 BCE 04/01/2010 to 31/12/2010 253 1.21% 1.14%
6 BCI 04/01/2010 to 31/12/2010 189 1.42% 1.21%
7 CDM 06/01/2010 to 31/12/2010 138 2.11% 1.81%
8 CGI 04/01/2010 to 31/12/2010 253 0.99% 0.86%
9 CIH 04/01/2010 to 31/12/2010 251 1.12% 1.03%
10 CMA 04/01/2010 to 31/12/2010 231 1.42% 1.37%
11 ADH 04/01/2010 to 31/12/2010 253 1.02% 0.91%
12 HOL 06/01/2010 to 31/12/2010 228 1.05% 0.88%
13 IAM 04/01/2010 to 31/12/2010 253 0.71% 0.68%
14 LAC 04/01/2010 to 31/12/2010 246 1.03% 0.83%
15 MNG 04/01/2010 to 31/12/2010 251 1.63% 1.38%
16 SAM 04/01/2010 to 31/12/2010 252 1.13% 1.07%
17 SID 04/01/2010 to 31/12/2010 233 1.15% 1.01%
market, preceded by an auction pre-opening session. After this period, trading proceeds con
-tinuously until the closing.
Results obtained after measuring the return volatilities for a stock over the same time but under different trading mechanisms show that return volatilities under the continuous mech
-anism are higher than those under the call mechanism. The continuous market returns are more volatile than the call market returns in the Casablanca Stock Exchange. The difference between return volatilities is attributed directly
to the effects of the trading mechanisms. This result confirms precedent results obtained on American, Asian, and European markets.
After the application of the weak efficiency test – the Fama’s test of first-order autocorre
-lation – to our data, using both the continuous market and the call market returns, we observe that 50% of stock returns studied show inde
-pendence between variations. Consequently, we cannot conclude which trading mechanism provides more efficiency in the Casablanca Stock Exchange.
Table 3. First-order autocorrelation coefficients for the continuous market and the call market returns
No. Ticker ρ(1) for the continuous market returns ρ(1) for the call market returns
1 ADI 0.0700* 0.0120*
2 ATW 0.1950 -0.0900*
3 ATH 0.1300 0.0630*
4 BCP 0.0890* -0.0800*
5 BCE 0.2500 -0.1200
6 BCI 0.0860* -0.1300
7 CDM 0.1960 -0.1500
8 CGI 0.0970* 0.0630*
9 CIH 0.1920 0.1450
10 CMA 0.0190* -0.1230
11 ADH 0.0420* -0.1520
12 HOL -0.0490* -0.1670
13 IAM 0.2230 -0.0070*
14 LAC 0.2920 0.0930*
15 MNG 0.1180 -0.0450*
16 SAM 0.1490 -0.0230*
17 SID -0.0020* -0.1480
18 WAA 0.0070* -0.2150
* Autocorrelation coefficient significantly equal to zero at 5%
References
Amihud, Y. and Mendelson, H. (1987), Trading Mechanisms and Stock Returns: An Empiri
-cal Investigation, Journal of Finance, 42(3): 533-553.
Amihud, Y. and Mendelson, H. (1991), Volatil
-ity, Efficiency and Trading Evidence from the Japanese Stock Market, Journal of Fi
-nance, 46: 1765-1789.
Amihud, Y., Mendelson, H., and Murgia, M. (1991), Stock Market Microstructure and Return Volatility: Evidence from Italy, Jour
-nal of Banking and Finance, 14: 423-440.
Broyles, J.E. (2003), Financial Management and Real Options, John Wiley and Sons. Chandrasekhar, K. (2009), Introduction to Mar
-ket Microstructure, in Vishwanath, S.R. and Chandrasekhar, K., Investment Manage
-ment: A Modern Guide to Security Analysis and Stock Selection, Springer, 13-29.
Chang, R.P., Hsu, S.T., and Huang, N.K. (1999), The Effects of Trading Methods on Volatil
-ity and Liquid-ity: Evidence from the Taiwan Stock Exchange, Journal of Business Fi
CDVM (2009), Annual Rapport.
Dahir No. 1-93-211 of 21 September 1993 on the Stock Exchange, amended and supple
-mented by Act n ° 34-96, 29-00, 52-01, 45-06, Chapter II, Article 82.
Derrabi, M. and Agnaou, S. (2009), Price Dis
-covery, Trading Costs and Insider Trading: Evidence from a Thin Emerging Market, Journal of Economics and International Fi
-nance, 1(1): 01-13.
El M’kaddem, A. and El Bouhadi, A. (2004), Micro-structure et Organization du Marché Boursier Marocain, Critique économique:
89-105.
Fama, E.F. (1965), Random Walks in Stock Market Prices, No. 16 Selected papers, Uni
-versity of Chicago Graduate School of Busi
-ness, 55-59.
Fama, E.F. (1970), Efficient Capital Markets: A Review of Theory and Empirical Work, Journal of Finance, 25(2): 383-417.
Fama, E.F. (1976), Efficient Capital Markets: Reply, Journal of Finance, 31(1): 143-145. George, T.J. and Hwang, Y.T. (1995), Transito
-ry Price Change and Price-Limit Rules: Evi
-dence for the Tokyo Stock Exchange, Jour
-nal of Financial and Quantitative A-nalysis, 30(2): 313-327.
Ghysels, E. and Cherkaoui, M. (1999), Emerg
-ing Markets and Trad-ing Costs, Scientific Series, CIRANO.
Hillion, B., Foucault, T., and Biais, B. (1997), Microstructure des Marchés Financiers: Institutions, Modèles et Tests Empiriques, Presses Universitaires de France, Paris. Kendall, M.G. and Hill, A.B. (1953), The Anal
-ysis of Economic Time Series, Part I: Pric
-es, Journal of the Royal Statistical Society, 116(1): 11-34.
Kingdom Of Morocco (2008), Official Bulletin,
5th June.
Kirchgässner, G. and Wolters, J. (2007), In
-troduction to Modern Time Series Analysis, Springer.
Lai, Z.H., Cheung, Y.M., and Xu, L. (1996), Trading Mechanisms and Return Volatility: Empirical Investigation on Shanghai Stock Exchange based on a Neural Network Mod
-el, Proceedings of the 1996 World Congress on Neural Networks, 881-883.
Rhee, S.G. and Chang, R.P. (1992), The Micro