ANALYSIS ON FINANCIAL EFFICIENCY SYNERGY ON PUBLIC
COMPANIES IN THE PRIMARY SECTOR AND INDUSTRY
POST MONETARY CRISIS LISTED IN JSX
Christnatalia
Student of Graduate Program, Master of Management, D Building, VII Floor Jl. Kyai Tapa No. 1 Grogol, West Jakarta 11440
email:[email protected], Phone: (021) 5664166, Fax.: (021) 5668640
ABSTRACT
The background of this research was merger and acquisition wave frequently in higher research and development needed and new technology implemented companies related in chemical create lower financial performance after merger and acquisition. The objective of this research was to test the significance of the difference between the efficiency financial performance before and after merger and acquisition. The design of this research applied purposive random sampling, quantitative method two means difference model, and statistic software SPSS for problem solving. Data analysis applied measuring return on capital employed. The result of research indicated that merger and acquisition activities can not improved efficiency of emittens or ROCE ratio in all emittens were getting worse after merger and acquisition.
Keywords: Acquisition, capital merger, emittens, financial performance, return on capital
INTRODUCTION
Weston, Johnson, and Siu (1999) noted several reasons for the chemical industry merger and
acquisition: (1) Strengthen existing product lines by increasing the capabilities and geographic
areas of larger market, (2) Add new product lines, (3) Overseas acquisitions are made to gain new
capabilities or needs in the local market, (4) Get the key science for the development of research and
development programs, (5) Reduce costs by reducing duplication of activity and the remaining capacity
is used to enhance sales and any related activities therein, (6) Reduce activities that demonstrate the
performance was not good, (7) Increasing operating results in the competition program to expand
capacity and yield, (8) Develop product line, (9) Strengthen the distribution system, (10) Develop
the company into a new company that grows continually, (11) Large expansion/investment, (12)
Creating a strong technology, (13) Achieve vertical integration.
The purpose of the acquisition for a company is different from one another, but the core purpose
is to extend or expand the company’s business. The failure of mergers and acquisitions are often experienced by the company because many companies are oriented towards short-term benefits such as getting cash targets rather than long-term benefit. Other cause is the burden that a well-performed company must take from a non-performed company being merged.
The impact of mergers and acquisitions could result in an increase or decrease on the company’s
performance. If mergers and acquisitions are made by companies that have the same good performance
it will tend to have improved performance compared if one of the company’s performance of mergers
and acquisitions has a poor performance.
The question in this study is whether the result of mergers and acquisitions of companies in Indonesia, especially those related to the chemical industry, also produces the same financial performance, especially at the level of efficiency? Have merged and acquisitioned companies managed to achieve the expected goal, in this research, producing optimum results for the use of existing capital (capital employed)?
Formulated research problem: Is there a significant average difference significantly to efficiency indicators of financial performance indicators (return on capital employed) on companies before and after mergers and acquisitions?
The purpose of this study is to assess the success of the financial performance of mergers and acquisitions in making efficient use of capital employed while the benefits of this research for researchers is to deepen knowledge about mergers and acquisitions, especially mergers and
acquisitions in Indonesia, while on the other hand to develop knowledge especially in terms of
mergers and acquisitions.
For companies and decision makers, this research can be a reference for consideration in the
company’s business expansion decision whether to conduct mergers and acquisitions or other
investment decisions. As for the authority and Bapepam, this research can provide input for decision
making whether mergers and acquisitions is the best way to improve the performance of a company,
which eventually indirectly improve the economy of Indonesia.
acquisitions of at least more than 3 (three) years or being listed on the JSX 3 (three) years prior to
merger and acquisitions and not doing delisting, during the period of observation. This obstacle
makes the study only focused on short-term observation for 3 (three) years before and after mergers
and acquisitions.
This study will be limited to the use of financial performance measurement at the level of efficiency. Measurement used is to do a comparison of the ratio of ROCE (return on capital employed) before and after mergers and acquisitions. In measuring the efficiency of measuring the utilization of existing resources either in use or not.
THEORETICAL FRAMEWORK AND HYPOTHESIS DEVELOPMENT
Definition of Merger and Acquisition. According to Gaughan (2001) merger is “a combination of two corporations in which only one corporation survives and the merged corporation goes out of
existence”.
Another definition of the merger is a combination of two or more companies that then there is only one company that survives as a legal entity, while others stop their activities or disbanded
(Moin, 2003).
Merger is different to consolidation. According to Gaughan (2001) consolidation is “business combination whereby two or more companies join to form an entirely new company”.
While acquisitions by Explanation to the Law of the Republic of Indonesia No. 7 of 1992 concerning article 28 paragraph 1, is the takeover of ownership of a company. This is further explained by the moin (2003) that the acquisition is “Take ownership or control of shares or assets of a company by another company, and in this event either company takeover or be taken over still exist
as separate legal entities.
The purpose of Mergers and Acquisitions. Some of the objectives of mergers and acquisitions that
can be achieved is (Kiryanto, 2004): (1) To strengthen capital structure, (2) Improving competitiveness so that its positioning in the industry both inside and outside the country getting better, (3) Expanding the customer base/customer base, with the consumer profile record companies who have joined a different segmentation, (4) Expansion of the type and variety of products and services company based on excellence of each company’s business, (5) The merger between the national companies can
indirectly inhibit the expansion of ownership of national companies by foreign investors, (6) Mergers and acquisitions between companies with the status of public enterprises is very beneficial in terms of stakeholders.
Develop management. The merger also aims to obtain a good resource management from the
company that acquired/merged. For large public companies, this is a cost reduction to improve
management.
Performance Measurement Mergers and Acquisitions. Performance measurement is done on
,Ltd. (1994) and Healy ,Palepu ,and Ruback (1992) as was done in a Japanese study conducted by Kruse, Park and Suzuki (2002) against 46 companies listed in Tokyo Stock Exchange (TSE), which merged in the period 1969-1992.
Operating Return. Operating return measure the performance of companies in operation producing output which is reflected in profit and sales. Operating return indicators used in this study is the net margin and asset turnover (Van Horne, 2002).
Net Margin can be formulated as follows:
Net operating margin is a measurement of the return. Any increase in net margin means the
company is able to generate more operating income than any value of sales/sales or income/
revenue.
Asset Turnover can be formulated as follows (Van Horne, 2002):
Asset revenue generated (efficiency) of each asset value.
Growth Indicator. Growth indicator or indicators of growth used in this research is that measures
the change in sales growth in sales/revenue. If the sales/revenue increase from the previous period, means there is growth in them. The formula change in sales (Van Horne, 2002) can be formulated as below.
Profitiability Indicators. Measuring the level of profitability to measure the level of benefits to be gained of the factors lever. Return on assets and return on investment used in this measurement. Levers for ROA and ROE are the assets are capital / investments made by investors. If the ROA and ROE increases highly, the company will be better for being able to generate sales or profits better (Van Horne, 2002)
Return on Assets. measure the profitability of the company’s total assets, which can also measure the efficiency of using assets to generate net income and is expressed in percentage.
companies that are in the same industry
Efficiency Indicator. Efficiency indicators used to measure the ability to increase revenue or reduce costs and to measure the productivity of their employees. If companies can not maximize the revenue it can be done by minimizing the cost. This study used the ratio of return on capital employed (ROCE). Here is the formula of the ratio ROCE:
Employed
Capital
Income Net
ROCE=
Capital employed. obtained from the total assets minus short-term liabilities. This ratio indicates the level of efficiency and profitability over the use of invested capital. This ratio shows the company’s ability to generate net income from the use of capital.
Safety Indicators. Indicators commonly used security level is the debt to equity ratio (DER), and the implied interest or the interest coverage ratio (ICR). DER measure the ability of capital in paying off debt, while the ICR measure the ability of the company’s net income in paying interest on the loan. DER (Debt to Equity Ratio) can be formulated as follow: (Ross, Westerfield & Jafe, 2005):
Equity
Debt
DER=
A high ratio indicates the company is very high in the conduct of debt financing. This could have an impact on the decrease in net income due to additional interest costs.
Implied Interest or Interest Coverage Ratio (Ross, Westerfield & Jafe 2005):
Expenses
ICR with a smaller ratio describes the company will bear the burden of higher debt costs. The
company hopes ICR greater after the merger and acquisition
Investment Policy. Investment decisions are short-term decisions and long term that is expected
to boost company performance. Further measurements on the investment decisions made by owners of capital are the EVA or economic value added.
The higher the value of EVA means better company performance in utilizing existing resources. These weaknesses are EVA (Young and O’Byrne, 2001): (1) Management has little choice in doing surgery financing, (2) EVA focuses on historical events, (3) EVA is too complex because of many adjustments that must be understood (difficult), (4) EVA is easily manipulated to make it look good (subjective), (5) EVA is a short term measure because only view of the statement of income which is a one-year performance results, (6) EVA focuses on the balance sheet because it focuses on the cost of capital, (7) EVA is a single performance measurement that does not measure the quality and time, (8) EVA terminology can be misleading, (9). EVA can not be used for the measurement of capital budgeting.
EVA = NOPAT - Capital Cost Where:
NOPAT = Net Operating Profit afterTax
Cost of Capital = WACC (Weighted Average Cost of Capital ) x Invested capital.
NOPAT Components: (1) Income available to common stock is the net profit distributed as dividends of ordinary shares, (2) After-tax interest expense is interest expense on interest bearing debt (including interest costs charged on leasing that are not capitalized, reserve management to make leasing a relatively permanent assets) net of tax expense, (3) Preferred dividends are dividend
paid on preferred stock, (4) Minority interest provision is income distributed to minority shareholders
of subsidiaries in the consolidated statements of income
The formula of Weighted Average Cost of Capital (Young & O’Byrene, 2001) :
Where :
y = refund / return demanded by equity investors and the level of the position of leverage / debt to equity ratio of the company. This research uses 3 months SBI rate.
t = the marginal corporate tax rate. The tax in this research is 25%. b = interst on short term debt or equal.
Equity = the number of common equity, preferred stock, and minority interest that can be equalized with equity in capital component.
Debt = all debts charged with interest.
Market Valuation. Performance measurement using stock market value such as price earnings ratio describes the company’s value in the eyes of the public. The higher the PER indicates that high stock market value. PER indicate future earnings than current earnings.
In brief, this ratio can be described as follows (Ross, Westerfield & Jafe, 2005).
Share
per
Earning
Price
Share
Ratio
P/E
=
P/E ratio is high is also called growth stock or a company is growing faster on average. P / E is high because investors believe that corporate profits in the future will be greater.
Another measurement of the company through a stock market price is the market value added (MVA). MVA can be formulated as follows (Young & O’Byrene, 2001):
MVA = Market Value Stock - Invested Capital
Stock market value is market value of capital or stock market price multiplied by the number of shares outstanding. This research uses book value of debt. MVA bigger is better. Large MVA reflects the company has created results for shareholders. A negative MVA reflects the value of investment management is less than the value of contributed capital to the firm by capital markets.
MVA limitations are: (1) MVA did not see the opportunity cost of capital/capital invested, (2)
level (SBU). This research will use the ratio of MVA per share to align with the use of other ratios
scale as a measurement tool study.
Previous research on Merger and Acquisition. According to tests conducted by the Kardono (2005) there are differences in short-term operating performance of companies listed on the SSE of the acquisition in the year 1997 to 2000, said that there were no significant differences in ROA, RAT, PMS, EPS, cash flow return on average ordinary equity share holding before and after the acquisition, and there are significant differences on cash flows after the acquisition of companies that have low debt to equity.
Based on nonparametric methods (DEA) to the data banks that are not grouped, mergers improve efficiency of 50.8%, while the data are grouped by category, the average increase in efficiency after the merger of banks amounted to 34.96%, while the average decline in bank efficiency after merger is 28.96%.
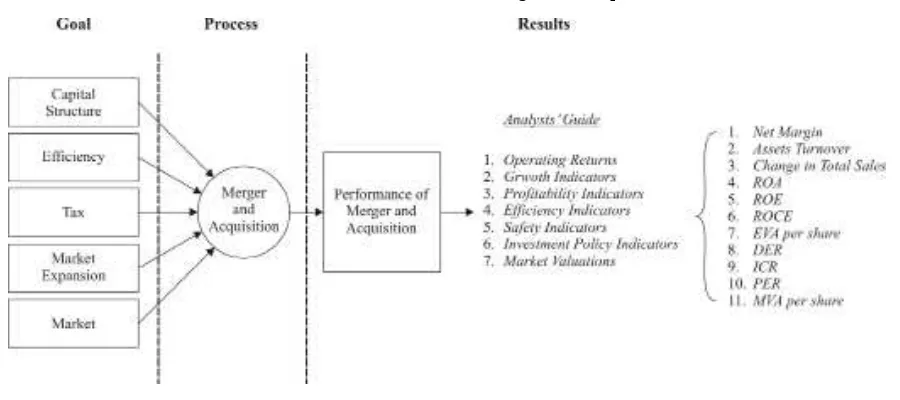
According to the study conducted in Japan by Timothy A. Kruse, Hun Y. Park, Kwangwoo Park and Kazunori Suzuki (2002) manufacturing companies listed in Tokyo Stock Exchange (TSE) during the period 1969 to 1992 through Daiwa Institute in of Research, Ltd. (1994) and Healy, Palepu, and Ruback (1992) measurement by using the ratio of Analysts’ Guide can be used to measure the
success of the company’s mergers and acquisitions.
The research framework is as follow:
Figure 1 : Research Framework of The Difference in Company Financial Performance Before and After Merger and Acquisition
Hipothesis Formulation
Ha.: There is significant average difference between financial performance efficiency indicator before and after merger and acquisition.
METHODS
Definition of Operational Variable.
Net Margin. Net margin is an indicator of the effectiveness of the company to control costs. Net margin is obtained by calculating the ratio of gross profit with the value of sales/net revenue (gross profit divided by sales/net revenue).
Asset Turnover. Asset turnover is an indicator of the company’s ability to use existing assets to generate sales / revenue. Asset turnover is obtained by calculating the ratio between sales / revenue
to total assets (sales / revenue divided by total assets).
Change in Total Sales / Revenue. Change in total sales / revenue are indicators used to measure the growth in sales / revenue obtained by calculating the ratio of sales / revenue the current period to
prior periods (total sales minus the current period total sales the previous period divided by the total
sales the previous period).
Return on Assets. ROA (return on assets) is an indicator of the company’s ability to earn net profit over a number of assets owned by the company. ROA can be obtained by calculating the ratio of net income to total assets (net income divided by total assets).
Return on Equity. ROE (return on equity) is indicator of the company’s ability to manage the
available capital to get net income. ROE can be obtained by calculating net income to total equity (net income divided by total equity).
Return on Capital Employed. ROCE (return on capital employed) is an indicator that measures
the rate of return or profitability and efficiency in using capital firms that have invested in the company. ROCE is obtained by calculating the ratio between net income by the capital used (earnings before interest and tax expenses divided by capital employed).
Deb to Equity Ratio. DER (debt to equity ratio) is an indicator that measures the financial
leverage the company, namely how the position of debt used to finance the assets of a company. This indicator can be obtained by calculating the ratio of debt to equity (debt/equity).
Interest Coverage Ratio. ICR (interest coverage ratio) is the indicator that measures how a company can pay interest on the loan in the same period. This indicator is obtained by calculating
the ratio of income before expenses interest and income tax and interest expense (net income before
interest and taxes divided by interest expenses).
Economic Value Added. EVA (economic value added) per share is an indicator that measures
the outcome or the value of a company. EVA is obtained by calculating the value of operating profit after tax cost of capital (net operating profit after tax less the weighted average cost of capital). While the ratio of EVA per share is calculated from the EVA value divided by the number of shares outstanding.
Price Earnings Ratio. PER (price earnings) ratio is an indicator that shows the price of a stock implies that the value of a company. These measurements can be obtained by calculating the ratio
between stock market prices with earnings per share (shares price divided by earning per share).
Market Value Added. MVA (market value added) per share is an indicator that measures the
of shares in the invested capital (market value less the invested capital). While MVA per share is
obtained by dividing the value of MVA by the number of shares outstanding.
In the table below will describe the variables to be studied, measurement indicators and
measurement scales for each variable.
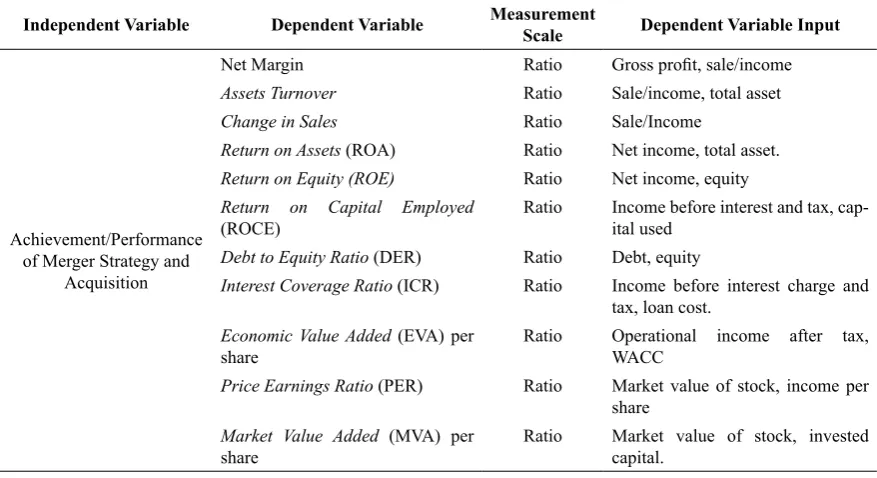
Table 1 : Variables Used in Research
Independent Variable Dependent Variable Measurement
Scale Dependent Variable Input
Achievement/Performance of Merger Strategy and
Acquisition
Net Margin Ratio Gross profit, sale/income
Assets Turnover Ratio Sale/income, total asset
Change in Sales Ratio Sale/Income
Return on Assets (ROA) Ratio Net income, total asset. Return on Equity (ROE) Ratio Net income, equity Return on Capital Employed
(ROCE) Ratio Income before interest and tax, cap-ital used Debt to Equity Ratio (DER) Ratio Debt, equity
Interest Coverage Ratio (ICR) Ratio Income before interest charge and tax, loan cost.
Economic Value Added (EVA) per share
Ratio Operational income after tax, WACC
The method used to analyze the success of the company’s financial performance of mergers and acquisitions is to compare the financial performance before the merger and after merger.
Testing with Kolmogorov-Smirnov method used to test the normality of data and methods of Wilcoxon Signed Ranks Test conducted to determine whether there are significant differences between the financial performance before and after mergers and acquisitions
Population and Sample. The population observed is the public companies listed on the Jakarta
Stock Exchange that merger and acquisition activity in 2001-2002, which consists of 21 issuers. Sampling method is purposive sampling random sampling that is based on considerations that are based on certain criteria. The samples taken were all public companies listed on the JSE that merger and acquisition activity in 2001-2002 in various industry sectors, Basic Industry and Mining
and Industrial Chemicals that are not delisted during the period of observation, three years before and
after mergers and acquisitions.
Instrumentation and Data Collecting. The data used are secondary data using an annual report
issued by the respective issuers who reported on the Jakarta Stock Exchange. Observations were done on samples which have the following characteristics: (1) Company mergers and acquisitions are recorded as listed in the Jakarta Stock Exchange, which merged in 2001-2002, (2) Company mergers and acquisitions are not in the industrial sector, Miscellaneous Industry, Basic Industry and Mining
Data Normality Testing using Kolmogorov-Smirnov Method. Kolmogorov-Smirnov method is a test of two samples to test whether two independent samples come from the same population (or
populations with the same distribution). Kolmogorov-Smirnov two-sample test associated with the match between the two cumulative distributions (Ghozali, 2006).
Hypothesis formulation for normality testing is as follow: H0 : data is from normal population.
Ha : data is from non-normal population. Decision making :
If sig. < 0,05, then H0 is rejected. If sig. > 0,05, then H0 accepted.
Non-Parametric Wilcoxon Signed Ranks Test. Wilcoxon Signed Ranks Test methods used to
test whether the two groups independent derived from the same population (Ghozali, 2006)
This test is used because the data is not normally distributed (Siegel, 1997). Testing is performed by stating the significance level of 5% .
The possible conclusions are:
If Z-statistic > Z-table then H0 is rejected.
If Z-statistic < Z-table then H0 can not be rejected or
If significance value < 0,05 then H0 is rejected
If significance value > 0,05 then H0 can not be rejected
Formula Z (Imam Gozali, 2006) is:
1)/24 1)(2N
N(N
1)/4 N(N
-T Z
+ +
+
= +
where:
T+ = total rank with positive sign di’s di’ = average difference
RESULT AND DISCUSSION
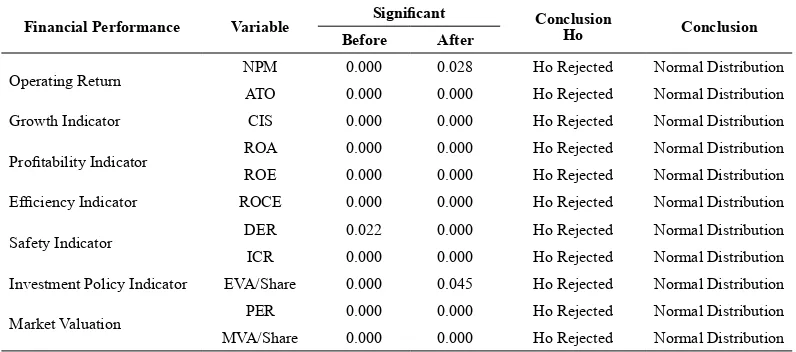
Normality Test. The result of normality test can be seen in table 2.
Table 2 : Result of Normality Test
Financial Performance Variable Significant Conclusion Ho Conclusion
Before After
Operating Return NPM 0.000 0.028 Ho Rejected Normal Distribution ATO 0.000 0.000 Ho Rejected Normal Distribution Growth Indicator CIS 0.000 0.000 Ho Rejected Normal Distribution
Profitability Indicator ROA 0.000 0.000 Ho Rejected Normal Distribution ROE 0.000 0.000 Ho Rejected Normal Distribution Efficiency Indicator ROCE 0.000 0.000 Ho Rejected Normal Distribution
Safety Indicator DER 0.022 0.000 Ho Rejected Normal Distribution ICR 0.000 0.000 Ho Rejected Normal Distribution Investment Policy Indicator EVA/Share 0.000 0.045 Ho Rejected Normal Distribution
Market Valuation PER 0.000 0.000 Ho Rejected Normal Distribution MVA/Share 0.000 0.000 Ho Rejected Normal Distribution
Based on the results of testing for normality with Kolmogorov-Smirnov method, it is known
that all the variables used in the study to the period before and after mergers and acquisitions, has a significance value less than 0.05. Then H0 is rejected, which means the data derived from the population is not normal. Further testing of different test average of each financial performance done by the method of Non-Parametric Wilcoxon Signed Ranks Test because data is not normal
distribution (Siegel, 1997).
Result Analysis and Intrepretation. Phase I: Financial Performance Testing Based on Type of Company. This hypothesis tested the difference on average efficiency levels of firms before and after mergers and acquisitions. Null hypothesis (H0) and alternative hypothesis (Ha) is prepared as follows:
H1 : There is an average difference between the efficiency indicators of significant companies before and after mergers and acquisitions.
This hypothesis will be represented by the ratio of return on capital employed (ROCE) with the formulation of hypotheses as the following.
H1 : There is an average difference of significance between ROCE companies before and after
mergers and acquisitions
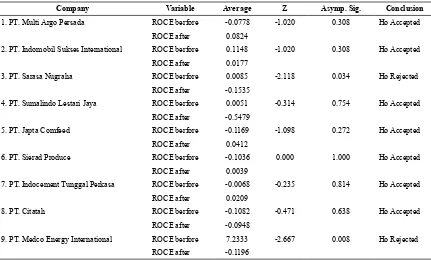
Table 3: Testing the Financial Performance of Company Efficiency Indicator
Company Variable Average Z Asymp. Sig. Conclusion
1. PT. Multi Argo Persada ROCE berfore -0.0778 -1.020 0.308 Ho Accepted ROCE after 0.0824
2. PT. Indomobil Sukses International ROCE berfore 0.1148 -1.020 0.308 Ho Accepted ROCE after 0.0177
3. PT. Sarasa Nugraha ROCE berfore 0.0085 -2.118 0.034 Ho Rejected ROCE after -0.1535
4. PT. Sumalindo Lestari Jaya ROCE berfore 0.0051 -0.314 0.754 Ho Accepted ROCE after -0.5479
5. PT. Japta Comfeed ROCE berfore -0.1169 -1.098 0.272 Ho Accepted ROCE after 0.0412
6. PT. Sierad Produce ROCE berfore -0.1036 0.000 1.000 Ho Accepted ROCE after 0.0039
7. PT. Indocement Tunggal Perkasa ROCE berfore -0.0068 -0.235 0.814 Ho Accepted ROCE after 0.0209
8. PT. Citatah ROCE berfore -0.1082 -0.471 0.638 Ho Accepted ROCE after -0.0948
9. PT. Medco Energy International ROCE berfore 7.2333 -2.667 0.008 Ho Rejected ROCE after -0.1196
The test results Wilcoxon Signed Ranks Test method is shown in table 3 states that the value of significance ROCE financial performance under the specified alpha value of 0.05 was PT Sarasa Nugraha Tbk (0,034) and PT Medco Energy International Tbk (0.008). So for PT Sarasa Nugraha H01 Tbk and PT Medco Energy International Tbk is rejected, meaning that there are significant differences in financial ratios ROCE before and after mergers and acquisitions. These results can be tested by looking at the value of Z statistic at PT Sarasa Nugraha at -2118 <Z tables -1.64, mean PT Sarasa Nugraha Z statistics are in an area or a very significant rejection of H0. So it is with PT Medco Energy International Tbk has Z statistic -2667 which also is in the region H0 rejection. Z region statistics on the two companies are in the negative. This shows that the average efficiency of financial performance ROCE after mergers and acquisitions has decreased, which means mergers and acquisitions at both companies produce financial performance efficiency decreased significantly ROCE .
H01 contrast to other sample firms consisting of PT Argo Multi Persada, PT Indomobil Sukses International, PT Sumalindo Lestari Jaya, PT Japfa Comfeed, PT Sierad Produce, PT Indocement Tunggal Perkasa and PT Citatah accepted, meaning there were no significant differences in ROCE financial ratios before and after mergers and acquisitions. This can be seen from the significance of such companies, where the level of significance more than 0.05. Results Z statistics of each company are located in negative territory> -1.64, which shows the location of the reception area H0.
ROCE increased after the merger and acquisition shows improvement of efficiency in the use of capital employed (long-term liabilities and equity).
(H0gab) and joint alternative hypothesis (Hagab) arranged as follow:
H3: There is significant average difference between industry efficiency indicator prior and post merger and acquisition.
This fourth hypothesis will be represented by the ratio of return on capital employed (ROCE) with the formulation of hypotheses as follows..
H4: There is an average difference between ROCE significant industries before and after mergers and acquisitions.
Table 4 below is the results of the test efficiency of financial performance indicators used in this study.
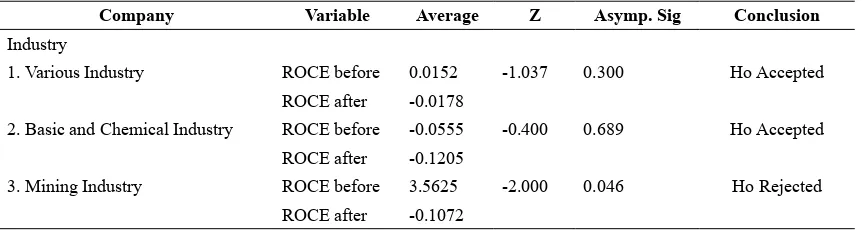
Table 4: Financial Performance Test on Industry Efficiency Indicator
Company Variable Average Z Asymp. Sig Conclusion Industry
1. Various Industry ROCE before 0.0152 -1.037 0.300 Ho Accepted
ROCE after -0.0178
2. Basic and Chemical Industry ROCE before -0.0555 -0.400 0.689 Ho Accepted ROCE after -0.1205
3. Mining Industry ROCE before 3.5625 -2.000 0.046 Ho Rejected
ROCE after -0.1072
The test results on the value of significance was conducted using Wilcoxon Signed Ranks Test showed that the significance of the various sectors of Industry and Chemical Industry Association and are above the specified alpha value of 0.05, namely 0.300 and 0.689. While the mining industry sector amounted to 0.046 under the specified alpha value of 0.05. So H0.1gab for various sectors of Industry and Chemical Industry Association and received, meaning there were no significant differences in financial ratios ROCE before and after mergers and acquisitions in these industries. When viewed from the Z statistic Miscellaneous Industry sector amounted to -1037 and Basic Industry of -0400, which both of these statistics Z < Z -1.64 table, meaning the average ROCE efficiency of financial performance of both companies are located in the reception area of H0. If H0 is accepted means of financial performance
ROCE efficiency of the firms did not differ significantly after mergers and acquisitions.
While H0.1gab for Mining Industry sector was rejected, meaning that there are significant differences in industry ROCE ratio before and after mergers and acquisitions. When viewed from the value of Z statistics for -2000 <-1.64, which means the rejection of H0 is in the region in negative
territory. H0 rejection region in negative territory gives the sense that the efficiency of financial ratios ROCE Mining sector are significantly different, but to decrease performance.
CONCLUSION
Based on the analysis and discussion it is concluded that mergers and acquisitions do not deliver improved financial performance is significantly better ROCE efficiency of each company and each industry sector.
This study only tested the success of mergers and acquisitions on companies that make mergers
and acquisitions in 2001 and 2002 are included in the various sectors of Industry, Basic Industry and Mining. This test only to see the efficiency of capital employed alone.
The next tests can then be conducted on companies that merged in different industries and in
mergers and acquisitions are different and do research on unused utilities. Besides, this study only
tested the success of mergers and acquisitions in the short term, ie 3 (three) years. Future studies can
test the success of the performance of mergers and acquisitions in the medium term or long term.
REFERENCES
Gaugan, Patrick A. 2001. Merger and Acquisitions. HarperCollins Publishers Inc.
Ghozali, Imam. Akt. 2006. “Statistik Non-Parametrik, Teori & Aplikasi dengan Program SPSS”. Semarang: Badan Penerbit – Undip.
Healy, Paul M., Krishna G. Palepu and Richard S. Rubak. May 1990. Does Corporate Performance Improve After Mergers?.
Kardono, Hariadi. 2005. Analisa Perbedaan Kinerja Operasional pada Saat Sebelum dan Sesudah Merger dan Akuisisi pada Perusahaan yang Terdaftar di BEJ.
Kruse, Timothy A., Hun Y. Park, Kwangwoo Park, and Kazunori Suzuki. 2002. The Valuation of Corporate Diversification: Evidence from Post-Merger Performance in Japan.
Moin, Abdul. 2003. Merger, Akuisisi, dan Divestasi. Yogyakarta: Penerbit Ekonesia FEUI
Peraturan Pemerintah Republik Indonesia No. 27 tahun 1998, tentang Penggabungan, Peleburan dan
Pengambilalihan Perseroan Terbatas.
Ross, Westerfield and Jafe. 2005. Corporate Finance. 7th Ed. MacGrown Hill.
Siegel, Sidney. 1997. Statistik Nonparametrik untuk Ilmu-Ilmu Sosial. Cetakan Ketujuh. Jakarta: PT
Gramedia Pustaka Utama.
Van Horne, James C. 2001. Financial Management and Policy. Prentice Hall International, Inc. Weston, J. Fred., Brian A. Jhonson and Juan A. Siu. 1999. Merger and Acquisition in The Global
Chemical Industry. Business Economics.