DISTRIBUTION, DENSITY, AND BIOLOGICAL ASPECT OF Trichiurus lepturus
IN THE SOUTHERN OF JAVA, INDIAN OCEAN EEZ OF INDONESIA
Fayakun Satria1), Wudianto1), and Awwaluddin2) 1) Research Center For Capture Fisheries, Ancol-Jakarta 2) Research Institute for Marine Fisheries, Muara Baru-Jakarta
Received April 24-2006; Received in revised from May 17-2006; Accepted June 23-2006
ABSTRACT
Distribution, density, and biological aspect of Trichiurus lepturus in deeper parts of southern Jawa are described based on data obtained from research cruise in May 2005. The cruise has successfully made 52 stations of trawl across southern of Java. Trichiurus lepturus was found unevenly in the area but was particularly abundant on the flat sea bed in the depth ranges of 200 to 500 m. Sex ratio was dominated by male (60%) compared to female (40%) with low breeding proportion index (0.18). Length and weight ranged from 69 to 112 cm and 130 to 755 g with 70% found in the stage of maturing. The main diet was mainly shrimps and myctophids.
KEYWORDS: Trichiurus lepturus, distribution, abundance, biological aspect
INTRODUCTION
Trichiurus lepturus hasa wide distribution throughout Indonesia water as reported by Badrudin & Wudianto (2004). This found in the estuarine waters until off marine waters. Trichiurus lepturus was reported to be fished by the local fishermen from the Java island from a relatively shallow to oceanic marine waters along the southern of Jawa waters (Badrudin & Wudianto, 2004). The fishing season of this species was known all year around with a peak in the end of year to the early of the following year. Variety of fishing gears have been utilized by the fishermen to catch this silver shiny fish such as purse seine, gill net, set net, traps, and trawl. It was reported that not only the trend of stock abundance indeces but also the size of the fish was tend to decrease (Badrudin & Wudianto, 2004).
In the field of systematic ichthyology Trichiurus lepturus was classified in the family of Trichiuridae. There were 10 genera in the family that is Diplospinus, Aphanopus, Benthodesmus, Lepidus, Epoxymetopon, Assurger, Tentoreiceps, Eupluerogrammus, Trichirurs, and Lepturacanthus (Badrudin & Wudianto, 2004). To date there were three genera that commonly caught by fishermen in the Indonesian waters that is
Eupluerogrammus, Trichiurus, and Lepturacanthus while
their common species were Euplurogrammus muticus, Trichiurus lepturus, and Lepturacanthus savala.
Regarding the economic value Trichiurus lepturus
has also well known as a marketable fish in the local market. The price were fluctuated ranging from Rp.2,000 to 10,000 per kg. Today the catches were supplied to the local market as well as to other country.
During July to September 2005 for 107 days the cruise has successfully made 102 trawl stations. 52 trawl stations in southern of Jawa waters and 50 trawls stations in the western off Sumatera waters. There were no single Trichiurus lepturus has been found in the waters off Sumatera but quite densely distributed in Jawa waters. In this paper the distribution, density, and biological aspect of Trichiurus lepturus in the deep seas of southern of Jawa waters, Indian Ocean from the depth of 200 to 1,000 m will be described.
MATERIALS AND METHODS
Figure 1. The cruise track during the survey.
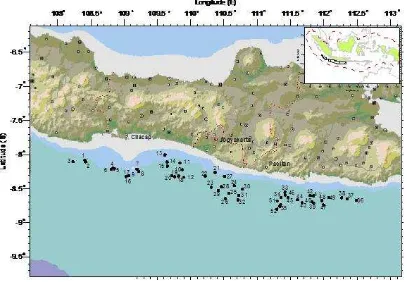
Figure 2. Positions of trawl operations in the southern of Jawa waters. Sampling
The data were obtained from research vessel Baruna Jaya IV cruises conducted during 2nd of May 2005 to 3rd of June 2005. The cruise was for demersal fish resources surveys while Trichiurus lepturus was taken into account as an observed species.Random stratified were applied in the cruise with samples (n=102 stations) that taken from 3 depth strata from 200 to 1,100 m with increments between 200 to 500 m, 500 to 750 m, and 750 to 1,100 m. Deep sea trawl used as a sample gear
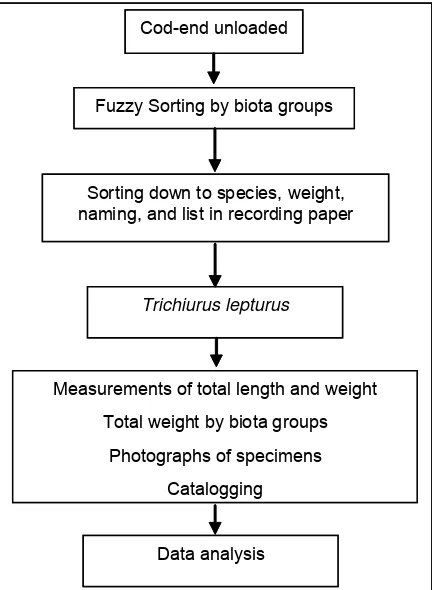
Cod-end unloaded
Fuzzy Sorting by biota groups
Trichiurus lepturus
Sorting down to species, weight, naming, and list in recording paper
Data analysis
Measurements of total length and weight
Total weight by biota groups
Photographs of specimens
Catalogging Cod-end unloaded
Fuzzy Sorting by biota groups
Trichiurus lepturus
Sorting down to species, weight, naming, and list in recording paper
Data analysis
Measurements of total length and weight
Total weight by biota groups
Photographs of specimens
Catalogging
Figure 3. General procedure of data collection activity and their analysis. Biological Measurement
From the catch of 22 stations there were 545 individuals of Trichiurus lepturus taken randomly and measured in length. 61 individuals were selected randomly in order to obtain detailed biological information i.e. length and weight, sex ratio, gonad weight, and stomach content. Photographs were taken for necessary information concerning for biological aspect of the species. Detailed data on individual specimens were collected, i.e. total length, sex, and stage of maturity, based on visual examination of gonads. The stages of maturity were classified into four stages with visual method i.e. mature (with globules and transparent of eggs on the gonad with bright in color), maturing (very
few globules and white in color), immature (no globules, small in size, and weight), and spent (the gonad of membrane appear distract). Estimates of the coefficients a and b of the relationship W(g)=a TL(cm)b were obtained by power regression.
Analyses of Distribution and Abundance
Input to analyses of distribution and abundance was the weights and numbers of the individual catches in May 2005. The catches were adjusted to a standard 30 minutes tow. The catches were downed to the species and listed, tabulated, and recorded in the spread sheet for each station.
Catch per unit effort and relative densities were obtained from swept area method. The models were based on the trawled area, speed, towing time, net opening, and the catches (Sparre & Venema, 1992) i.e:
a.n=t.v.h.e.1,852.0.001
where:
D = (1/a.n).(c/f)
a.n = the length of net track line (km)
c = catches (kg per hours) D = stock density
e = Constanta of net opening (with e=0.66) f = escapment factor (=0,5)
h = the length of head rope (=28,5 m) t = towing period (hours)
1,852 = mil conversion to km
106 107 108 109 110 111 112 113 114 -10
-9 -8 -7 -6
0.145 to 25 25 to 50 50 to 100 100 to 200 200 to 250
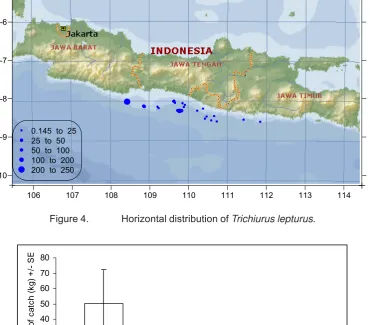
Figure 4. Horizontal distribution of Trichiurus lepturus.
0 10 20 30 40 50 60 70 80
200-500m 500-750m 750-1000m
Depth strata (m)
T
he av
egarage of
c
a
tc
h (k
g)
+
/-
S
E
Figure 5. The average of catch on the basis of depth strata.
RESULTS AND DISCUSSION
Distribution and Density
Catches of Trichiurus lepturus occurred unevenly in the area sampled of southern Jawa Sea. Trichiurus lepturus was caught in 22 of a total of 52 trawls in the study area (42.3%). There was a concentration of relatively big catches in the station no 001 and 020 for about 150 to 250 kg located between 108° E and 110° E. In Figure 4, the catches from individual stations are plotted with symbol size proportional to the numbers in the catch. The populations are rarely found as shift to the West starting from 108°E.
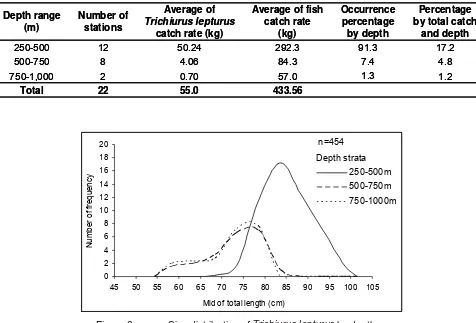
In term of vertical distribution the catches were higher in the depth from 200 to 500 m but very rare on the
deeper than 500 m (Figure 5 and Table 1). The frequency of zero catches was higher in deeper depth strata >500 m. The biggest catch (at 245 m) contained 682 individuals. This suggested that Trichiurus lepturus has a limitation to inhabiting a deeper depth more than 500 m. The limitation might be due to either physiology or habitat and food resources reason.
The distribution of Trichiurus lepturus seems limited to the area that attributes specific habitat. The habitat likely to inhabit was flat with soft substrate.
The estimation of stock density of Trichiurus lepturus
was 350 kg km-2 with biomass occurred in the entire
Table 1. Stock size of Trichiurus lepturus on the basis of depth strata in the surveyed area
1,930.20 5.00
8.46 1,925.20
Fishing potency(tonnes per year)
3,860.39 9.99
16.92 3,850.40
Biomass (tonnes)
11,019
Total catch rate(kg)
Total
Fishing potency(tonnes per year)
3,860.39 9.99
16.92 3,850.40
Biomass (tonnes)
11,019
Total catch rate(kg)
Total 750-1,000 m
500-750 m 200-500 m
Parameter
Table 2. Comparison of the total catches of fish and Trichiurus lepturus with respect to the depth strata
433.56 by total catch
and depth Occurrence
percentage by depth Average of fish
catch rate (kg) Average of
Trichiurus lepturus catch rate (kg) Number of
stations Depth range
(m) by total catch
and depth Occurrence
percentage by depth Average of fish
catch rate (kg) Average of
Trichiurus lepturus catch rate (kg) Number of
stations Depth range
(m)
Mid of total length (cm)
N
Figure 6. Size distribution of Trichiurus lepturus by depths. Compared to the total catch (4,295.5 kg)Trichiurus
lepturus was about 636.7 kg. This revealed the species contributes a small quantity in the entire catches for 14.8% (Table 2).
Biological aspects of Trichiurus lepturus
The size (TL) of Trichiurus lepturus ranged from 54 to 101 cm (Figure 6). The distribution of Trichiurus lepturus with respect to the depth and size revealed that
Female Total Length (mm)
W
e
ight
(gr)
Male
y = 0.0003x3.1153
R2 = 0.8673
Total Length (cm)
W Total Length (mm)
W
e
ight
(gr)
Male
y = 0.0003x3.1153
R2 = 0.8673
Total Length (cm)
W
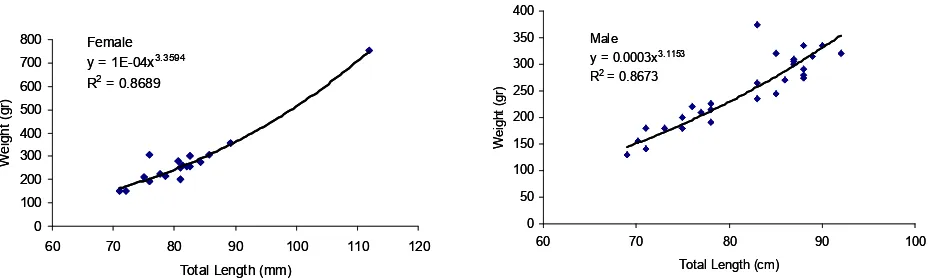
Figure 7. Length and weight relationships of Trichiurus lepturus.
0
Figure 8. Sex ratio of Trichiurus lepturus.
The length weight relationships W(g)=1E-04 TL (cm)3.36 and W(g)=0.0003 TL (cm)3.12 for female and male. The calculations were based on the measurements of n=43 females (R2=0.87) and n=18 males (R2=0.87) Trichiurus lepturus. The growth of
Trichiurus lepturus was bigger than 3, indicating to positive allometric growth type (Figure 7). The growth type confirmed that oceanic Trichiurus lepturus has a faster body weight growth compare to its length (Ingles & Pauly, 1984) while coastal Trichiurus lepturus has been reported to have negative allometric growth type.
Sex Ratio and Maturity
Data on sex composition and sex ratio were recorded from 61 fish samples. There were 18 females (29.5%) and 43 males (70.5%) (Figure 8). Small proportion of females in a population indicates a high risk of harvesting the stock without an effective and carefully management.
0 10 20 30 40 50 60 70 80 90
Immature Maturing Mature Spent
Gonad maturity stages
P
er
c
ent
age
s
0 10 20 30 40 50 60 70 80 90
Immature Maturing Mature Spent
Gonad maturity stages
P
er
c
ent
age
s
Figure 9. Sexual maturation of Trichiurus lepturus.
fish 29% Fish and
shrimp 11%
shrimps 60%
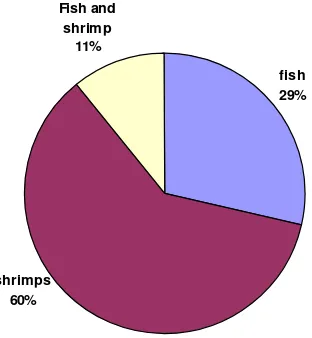
Figure 10. The main diet composition of Trichiurus lepturus.
Average weight of maturing gonads was 9.4 g while mature 12.42 g. There were 5 samples of gonad mature out of 28 samples giving a low breeding proportion index i.e. 0.18 (BP=TG/MG). Average of gonado somatic indecs for female was 3.77% (1.2–7.1%) and male was 1.82% (0.5-3.7%).
Diet
A total of 40 stomachs were examined for food items. There were 55% (22) found filled and 45% (18) empty
CONCLUSION
Trichiurus lepturus was unevenly distributed in the area and mostly concentrated on the flat sea bed area up to 500 m deep. Stock density of the population in average occurred for 350 kg km-2. The distribution of Trichiurus
lepturus seems limited to the area that attributes specific habitat. The likely habitat to inhabit was flat with soft substrate. Trichiurus lepturus were more abundant in the area less than 500 m. The population was dominated by male and giving low breeding proportion index 0.18 suggesting a vulnerable stock on fishing pressure. The growth was allometric positive informed a faster growth rate of body weight compare to the length. Trichiurus lepturus was a carnivore with the main prey of shrimps and mycthopids.
__________
Acknowledgements:
This paper is part of ‘Indonesian-Japan joint program on deep sea fisheries resources’ in 2005.
REFERENCES
Anonymous. 2005. The Japan-Indonesia deep sea fishery resources joint exploration project (report of 2004 field survey). Overseas Fishery Foundation. Research Institute for Marine Fisheries.
Anonymous. 2006. The Japan-Indonesia deep sea fishery resources joint exploration project (report of 2005 field survey). Overseas Fishery Foundation. Research Institute for Marine Fisheries. 154 p+58 app.
Badrudin & Wudianto. 2004 Biologi, habitat, dan sebaran ikan layur serta beberapa aspek perikanannya. Co Fish Project. 13 p.
Ingles, J. & Pauly. 1984. An atlas of the growth, mortality, and recruitment of Philippine fishes. ICLARM Tech. Report No.13. ICLARM. Manila. 127 p.