IDENTIFYING STUDENTS’ ACADEMIC ACHIEVEMENT AND
PERSONALITY TYPES WITH NAIVE BAYES CLASSIFICATION
Sri Mulyati1) danNovi Setiani2)
1,2
Department Informatics Engineering, Faculty of Industrial Technology, Islamic University of Indonesia
1,2
Jl.Kaliurang Km 14.5 Yogyakarta 55584 E-mail: [email protected]), [email protected])
ABSTRAK
MBTI Psychometry is the science of psychological measurement comprised of 4 opposite dimensions, namely energy orientation with Extrovert vs. Introvert, the way to manage information by sensing and Intuition, Dimensions of drawing conclusions & decisions: Thinking (T) vs. Feeling (F), and Dimensions of lifestyle: Judging (J) vs. Perceiving (P) . Students’ length of study is mainly influenced by both external and internal factors of the students’ individual. It is possible to measure the internal aspect of students by psychometric measurements. In addition, it is also viable to determine students’ study pattern with Machine learning technology to reveal the two factors influencing the students’ length of study. This study uses some of students’ attributes including GPA, and the results of the 4-dimensional measurement with based on passed courses and active courses. Samples were collected from students of the academic year of 2014 comprised of 63 students from Psychological Department and 28 students from Informatics Engineering Department. The training data taken were 63 samples and the testing data were 28. In this study, the training data were used to establish the study pattern of students based on personality types. This study uses the Naïve Bayes Classifier algorithm to classify 63 training data with the value of Correctly Classified Instances of 82,53%. The 28 testing data with Correct Classified Instances amounted to 96.4286%. The test method is equipped with cross validation of 8 folds resulting in the percentage of 80.95%.
Keywords: MBTI, Naïve Bayes Classifier, Machine learning
1. INTRODUCTION
Psycometric the science of psychological measurement to provide data to help a person in self-understanding, self-assessment and self-acceptance. The results of such psychological measurements can be used by someone to improve his/her self-perception and to explore the possibility to develop in some certain fields. On this account, personality recognition tests are essential for everyone to enable self-development. The difficulty for self-development is likely triggered by inability to recognize the potentials. To know the self and to manage the self, someone can use a psychological test measuring instrument using the MBTI method (Myers-Birggs Type Indicator). MBTI is a psychological test designed to measure a person's psychological preferences in perceiving the world and making decisions (Myers, 1999). This psychological test is designed to measure an individual's intelligence, talent, and personality type. In the MBTI test there are 4 dimensions with the opposite prevalence, namely Energy orientation with Extrovert vs. Introvert, the way to manage information by sensing and Intuition, Dimensionof drawing conclusions & decisions: Thinking (T) vs. Feeling (F), and Dimensions of lifestyle: Judging (J) vs. Perceiving (P). (Wandrial, 2014) there are more subjects with focus preference of extrovertion and sensing in perceiving information. (Wandrial, 2015) identified the personality type of students by using MBTI models, The result shows that the majority of students have approximately 51,04% introvert type and 58,04 %
of students have the sensing type. The students with GPA more than 3,5 are ISFJ type.
Cybercounseling system has been created which can facilitate students and counselors to communicate, recognize student personality through MyersBrigs-based measurements Type Indicator (MBTI), and recommendation for the field of work according to personality college student(Mulyati, Setiani, & Gusniarti, 2018). Based on the test measuring instruments used in the UII psychology laboratory with MBTI, each dimension has 20 opposing questions for the measurement of each prevalence. Each question must be answered and each answer is valued by the Likert scale to determine the answer level 0, 1 and 2. On the basis of the score of answers, the most dominant value of each dimension is taken as the personality type value.
In this study classifying the answers from the measurement of the user's MBTI prevalence and show the degree of value of the possibilities arising from the measurement of academic data and personality type data 2. THE SCOPE OF RESEARCH
In this study classifying the answers from the measurement of the user's MBTI prevalence and show the degree- of value of the possibilities arising from the measurement of academic data and personality type data
3. LITERATURE AND METHODOLOGY
This literature discusses the Factors Affecting Successful Academic Achievement, Machine Learning Technology,and Classification Method: Bayes Theorem, confusion of the Matrix And AUC Interpretation
3.1 Factors to Affect Successful Academic Achievement
Student achievement, especially in the academic field, is an indicator of the success of education. For students, this achievement is a form of evidence of their potential. Academic achievement is the easiest indicator to assess, for example by way of Achievement Index and length of study. Students of higher achiever indexes who are able to study in the specified timeframe are categorized as students who excel academically. There are two factors that can affect one's academic performance, namely internal and external factors (Gage, Berliner, 1992; Winkel, 1997). Internal factors are intelligence, motivation, and personality, while external factors are the surrounding environment both at home and at campus.
3.2 Machine Learning Technology
Machine learning is an artificial intelligence approach that is widely used to replace or imitate human behavior to solve problems or do automation. As the name implies, ML tries to imitate how human processes or intelligent beings learn and generalize. There are at least two main applications in ML, namely, classification and prediction. A distinctive feature of ML is the process of training or learning. Therefore, ML requires data to be studied which is known as training data. Classification is a method in ML that is used by machines to sort or classify objects based on certain characteristics as humans try to distinguish objects from one another, while prediction or regression is used by machines to guess the output of an input data based on the data that has been studied in the training.
3.3 Classification Method: Bayes Theorem
Naive Bayes is a simple probabilistic classification that calculates a set of probabilities by summing frequencies and combinations of values from a given dataset. The algorithm uses the Bayes theorem and assumes all independent or non-interdependent attributes given by values on class variables. Another definition delineates Naive Bayes as a classification with
probability and statistical methods presented by British scientist Thomas Bayes, namely predicting future opportunities based on previous experience. The Bayes theorem equation is as stated in the followings (Jiawei Han, 2006).
3.4 Performance Testing Classification
System performance testing can be done with confusion matrix (Hossin & Sulaiman, 2015) and interpreted with the Under Curve Area.
3.5 Confusion Matrix
Confusion matrix is one of the tools that can be used in learning machine evacuations that contain 2 or more categories.
Table 1. Confusion matrix of 2 class table
Predicted class
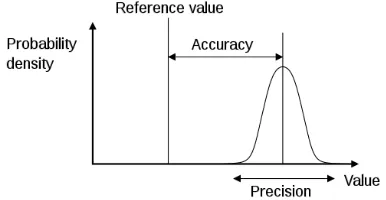
The following , accuracy indicates the exactness of the measurement results to the real value. The precision shows how close the difference in value when the measurements are repeated
Figure 1. Precision and accuracy
3.6 AUC Interpretation
AUC (Area Under Curve), as the term suggest, is the area under the curve. The area of AUC is always between the values 0 to 1 (Learning & Zheng, 2015). AUC is calculated based on the broad combination of trapezoidal points (sensitivity and specificity). The level of measurement of classification based on the AUC value can be seen in Table 2. Category classification of quality values based on AUC Value below:
3.7 Software Data Mining
WEKA (Waikato Environment for Knowledge Analysis) is data mining software developed by the University of Waikato, New Zealand. It was first implemented in 1997 and began to be used as the open source in 1999. Until now, it has developed into version 3.9.2. Written in the Java programming language, WEKA is also supported by a very good and user friendly GUI. It can process various data files such as * .csv and. * Arff and has key features such as data pre-processing tools, learning algorithms and various evaluation methods. In addition, this software can also provide results in visual forms, such as tables and curves. Use of this software (Bouckaert et al., 2013)
1. Use Training Set: evaluates how well the algorithm can predict the class of an instance after training. Training data will be used for test data.
2. Supplied Test: evaluates how well the algorithm can predict the class of set instances taken from a file. Training data and test data are different files. 3. Cross-validation: evaluates the algorithm through
cross-validation, using the value of the folds entered. 4. Percentage split: evaluates how well the algorithm
can predict a certain percentage of data. The data set will be divided into 2, training data and test data. This study discussed the clustering process with the Naive Bayes Classification method to determine the accuracy of students study pattern based on personality type using Use training sets, supplied tests and Cross study are orientation of learning achievement, energy orientation, information management orientation, conclusions orientation, preferred work orientation and accuracy of the study. The study pattern accuracy is presented in class with pass and active column.
Table 3. Data Transformation
1. Problem Analysis and Literature Review
This stage is the first step to determine the problem statement from the research. It aims to observe the normalization problem in test measurements. This normalization problem is then analyzed to find out its solution.
2. Data Collection
4.1 Result of the Classification
The results of the classification to determine the pattern of student graduation using WEKA processing tools can be seen in result with 63 training data as confusion matrix against the Naive Bayes algorithm with 5 attributes and 63 records which produce an accuracy rate of 82, 57%, precision of 0.854 and Recall of 0.825. Of the 63 records, classification a results in the value of 21 passed and b with a value of 31 still active.
4.2 ROC Curve
In each test in WEKA, basically the Receiver Operating Characteristic value will be immediately generated. The results of the ROC will be visualized in the form of a plot. The following is visualization for X = False Positive Rate and Y = True Positive Rate.
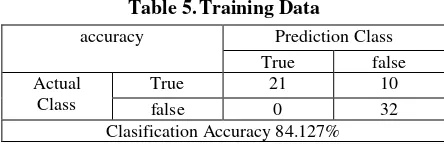
Figure 2. ROC Curve performance in making predictions with an accuracy level of 84.127%.
The classification of the 28 testing data reveals that 27 data can be classified and 1 data cannot be classified. Based on the kappa value, the statistical value is 0.78.
Relative absolute error : 47, 68% Root relative squared error : 56,08% Total Number : 28
The classification results of training data are then tested with testing data that has been made and classified using the Naive Bayes method. Based on the analysis, it is conclusive that the classification is said to be accurate because some classification results are directly proportional to the real situation, based on the data of students conducting Psychology tests with the MBTI which are used as training data, it is indicated that the Naive Bayes method successfully classifies the data with an accuracy percentage of 96.42%.
5. CONCLUSION
The training data taken were 63 samples and the testing data were 28. In this study, the training data were used to establish the study pattern of students based on personality types. This study uses the Naïve Bayes Classifier algorithm to classify 63 training data with the value of Correctly Classified Instances of 82,53%. The 28 testing data with Correct Classified Instances amounted to 96.4286%. The test method is equipped with cross validation of 8 folds resulting in the percentage of 80.95%.
6. SUGGESTION
Psychometry innovation with a decision support system to identify personality types with normalization, adding a knowledge base for counseling techniques and
Wandrial, S. (2015). THE RELATIONSHIP OF MBTI AND STUDENT GPA SCORE IN BINUS MANAGEMENT CLASS 2015, (9), 103–112. Mulyati, S., Setiani, N., & Gusniarti, U. (2018). Jurnal
Rabit, 116–124.