Chapter Three Methodology
In this chapter, the researcher explained the way to conduct the research and the methodology that researcher used to conduct it. The researcher showed the research design that was used in this study. The researcher also clarified the population, sample, and
sampling. The researcher explained the population and sample of this study, also the way to take the sample. The researcher mentioned the instrument that was used in this study. The researcher also showed the data analysis which used to analyze the data of this study.
Research Design
This study was a quantitative research. The quantitative research is a study which uses a numerical data and statistical analysis. According to Creswell (1994), the quantitative research is a type of research which investigates the phenomena by gathering numerical data and analyzes it using statistical analysis method. The researcher used the quantitative
research because this study aimed to measure the association between two variables, so the quantitative was an appropriate research method. In this study, the researcher used
There are two variables in this research. The two variables were independent variable (X) and dependent variable (Y). An independent variable is an input variable which causes or influence another variable. On the other hand, a dependent variable is the outcome variable which is caused by another variable. The independent variable in this research was the students’ interests in their teacher’s personality, while the dependent variable was the student’s academic achievement. In order to know the association between these two variables, the researcher used the technique correlation product moment. It is for measuring the correlation between students’ interests in their teacher’s personality (X) and student’s academic achievement (Y). The researcher used correlation product moment technique because the researcher focused only to find the correlation between students’ interest in teachers’ personality and academic achievement without need to find the impact of it.
Research Setting
The researcher conducted this study at English Education Department of Universitas Muhammadiyah Yogyakarta. There are two reasons why the researcher took this place as the setting of study. First, it is because the researcher was a student of English Education
Department of Universitas Muhammadiyah Yogyakarta. This is for the accessibility. This setting can help the researcher in accessing and collecting the data. Second, the researcher as a student of EED knows the EEDs’ teachers personality. It can help the researcher in
investigating the students’ interest in each personality of EED lecturers.
Population, Sample, and Sampling
this study was 433 students. The researcher got this total number for each batch from the EED administration office by approval the head of English Education Department of Universitas Muhammadiyah Yogyakarta.
The researcher chose the EEDs’ student batch 2013, 2014, and 2015 as the
populations of this study because they have fulfilled the categories that the researcher wanted to study. The population should have at least CGPA for four semesters because it can obtain the stable CGPA. They also should have enough experience in interacting with the lecturer of EED of UMY at least two years. If the student experiences more in interacting with the EED lecturer either in class or outside class, it made the students more understand the lecturers’ personality. This category was made for helping the researcher to choose an appropriate population.
Sample. The sample is the part of all population. It also can be defined as a smaller group or subset of the total population (Cohen et al, 2011). Based on the Creswell (2012), the sample is the group of participants in a study selected from the target population which researcher generalizes to the target population. The sample in this research was calculated from the total population. To determine the sample size, the researcher used the formula from Notoadmodjo (2010) as follows:
� = + � �� 2
Explanation: � = Large sample
� = Large population
� = + . . 2
� = 81
Based on the formula above, the sample size of this study was 81 students. The researcher took this number of the sample as the minimum number of the respondent. Yet, in the process of collecting the data, the researcher got the 99 students as the respondents.
Sampling. The sampling is the way or the technique to take the sample. The type of sampling was used in this study was non-probability sample. Cohen et al (2011) defined that a non-probability sample is a sampling technique which the sample is targeted or expected. Therefore, the researcher used the convenience sampling which included in non-probability because the researcher decided to gather the data from the nearest people, convenient, and available to access the data. Cohen et al (2011) stated that the convenience sampling is the sampling that the researcher chooses the sample from the nearest individual or the people who are available and accessible at the time. The researcher chose this sampling technique because of the limited time in gathering the data. Thus, it helped the researcher to be faster in collecting the data.
Data Collection Method
directly or by face to face. The researcher used the direct method to distribute the
questionnaire to students batch 2014 and 2015. The researcher asked the permission to the lecturer who teaches the student batch 2015 class A on May 8, 2017 and the lecturer who teaches the student batch 2014 class D on May 13, 2017 for distributing the questionnaire in their class. The researcher distributed the questionnaire for about twenty minutes before the class ended. The allocation time that the researcher needed to distribute the questionnaire in each class was about fifteen to twenty minutes. In the class of student batch 2014, the researcher distributed the 33 questionnaires and in the class of student batch 2015, the
researcher distributed the 21 questionnaires. Thus, the total questionnaire that was distributed by direct method was 54 questionnaires. The researcher also distributed the questionnaire by indirect method which means the researcher shared the link of the questionnaire by social media or email. However, the researcher used the “Google Form” to distribute the
questionnaire to the students batch 2013. The researcher used it because the students batch 2013 are no longer having the class, so it difficult for the researcher to distribute the
questionnaire directly. The researcher used the “WhatsApp” to share the questionnaire to the WhatsApp group of student batch 2013. The researcher waited the response of the
questionnaire about two days. The students who responded to the questionnaire were 45 students. In order to gather the accurate and valid data, the researcher chose the respondent to fill the questionnaire voluntarily. The original of this questionnaire in English but the
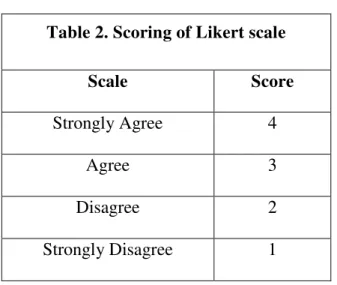
Table 2. Scoring of Likert scale
Scale Score
Strongly Agree 4
Agree 3
Disagree 2
Strongly Disagree 1
To obtain the data of student’s academic achievement the researcher used the
documentation method. The data of students’ academic achievement was collected from the score of Cumulated Grade Point Average (CGPA). This document was taken from the EED administration office. The researcher asked the permission to the respondent before accessing the students’ academic achievement. This score was used to measure the level of students’ academic achievement. The researcher divided the CGPA into three categories to determine the level of students’ academic achievement at EED of UMY.
The researcher gained the data from 45 students batch 2013, 33 students batch 2014, and 21 students batch 2015. Firstly, the respondent targeted in this study was 81 students, but the researcher got the data from 99 students. These respondents were gained based on their willingness, volunteerism, accessible, and available to be a respondent. Based on this
distribution, the researcher claimed that the data obtained in this research can be categorized as the valid data.
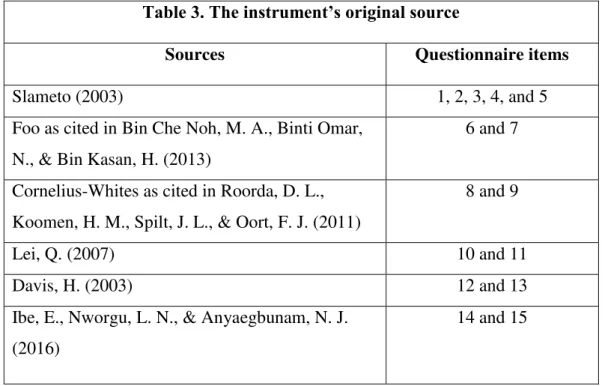
The researcher used the validity test to verify whether the instrument was valid or invalid to measure the variable of the study. The instrument that was invalid can affect the result or finding of the research. If a part of the research is invalid, then it will be useless (Cohen et al, 2011). The researcher used the content validity to test the items of the instrument whether it can measure the hypothetical concept or not. Content validity is used to measure that the instrument “fairly and comprehensively covers the domain or items that it purports to cover” (Cohen et al, 2011, p. 137). The instrument of this study was adapted from the statement of Slameto (2003), Foo (1998), Cornelius-White’s (2007), Lei (2007), Davis (2003), and Ibe et al. (2016). The instrument’s original source was presented on the table below:
Table 3. The instrument’s original source
Sources Questionnaire items
Slameto (2003) 1, 2, 3, 4, and 5
Foo as cited in Bin Che Noh, M. A., Binti Omar, N., & Bin Kasan, H. (2013)
6 and 7
Cornelius-Whites as cited in Roorda, D. L., Koomen, H. M., Spilt, J. L., & Oort, F. J. (2011)
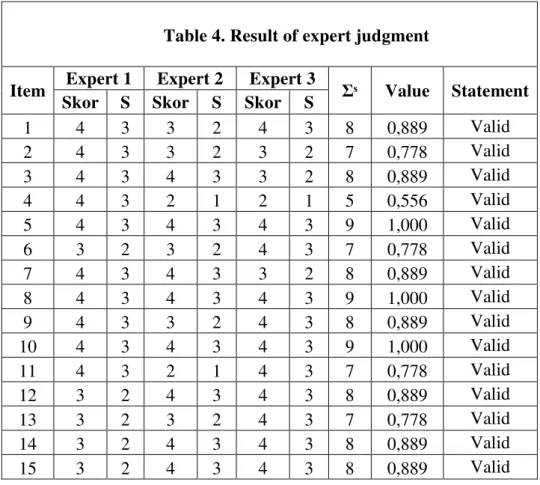
questionnaire and the statement of the expert. This rate number was used as the validity instrument. The researcher used the formula from Aiken (1985) to measure the content validity coefficient based on the score that was obtained from the expert judgment. The result of content validity as follows:
Table 4. Result of expert judgment
Item Expert 1 Expert 2 Expert 3 Ʃˢ Value Statement
Instruments reliability. Furthermore, the researcher also tested the reliability of the research. Reliability of the instrument was used to measure whether the instrument was dependent and consistent or not. According to Cohen et al (2011), reliability in quantitative research is related to dependability, consistency, and stability of time, instruments, and group of respondents. Thus, the reliability was important to this study because it can also affect the result of the study. The researcher measured the reliability value in this study by using the
Cronbach’s alpha. The value obtained from each item should be higher than 0.40, so it can
be categorized as reliable items. Beside, Sekaran (2000) categorized the level of reliability based on the value obtained such as:
1. 0.8 – 1.0 = Good 2. 0.6 – 0.799 = Moderate 3. < 0.6 = Not Good
Furthermore, after the researcher conducted the reliability test using SPSS, it obtained the value 0.851. The value obtained was categorized as the good reliability. It indicated that the instrument was reliable to measure. The result of reliability test as follows:
Table 5. Reliability
into two types which were the descriptive statistical analysis and inferential statistical analysis. In this study, the researcher used these two techniques or steps to analyze the data. The researcher analyzed the data of this study on June 2017.
Descriptive statistical analysis. Based on Cohen et al (2011), descriptive analysis is an analysis that only describes and presents the data such a summary of frequencies. In descriptive analysis included mode, mean, and median. The mode is the score obtained by the greatest number of people, while mean is the average score, and then median is the score obtained by the middle person in a ranked group of people (Cohen et al, 2011). Besides, the researcher also used the maximum, minimum, mean, and standard deviation to find the interval. From the interval, the researcher can formulate the frequency of each variable in this study. Based on the formula from Azwar (2004), the researcher divided three categories of students’ interest in teachers’ personality with the formula as follow:
High = X > M + SD
Moderate = M – SD < X < M + SD
Low = X < M – SD
Explanation: M : Mean
SD : Standard Deviation
Moreover, this formula answered the first and second research question. However, this analysis is used to find the level of students’ interest in teachers’ personality and
Inferential statistical analysis. Cohen et al (2011) defined the inferential analysis is an analysis that strives to make inferences and prediction based on the data gathered. The inferential statistical analysis included normality testing, hypothesis testing, and correlation. Normality testing is a test that measures whether the dependent variable and independent variable were normally distributed or not. The researcher used the Kolmogorov-Smirnov to test the normality of data before analyzing it. Besides, hypothesis testing is a test to measure whether the researcher hypothesis was rejected or accepted. Correlation testing is a test aimed to find whether there is a correlation between variable X and variable Y or not, then it also to measure the positive or negative correlation between them with referred to the significant value. In this study, the correlation was analyzed trough the correlation coefficient Pearson’s Product moment (r). The researcher referred to the r table to find the association or the
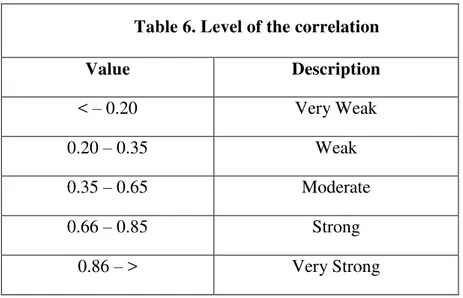
correlation between variable X and variable Y. If the obtained r value was higher than r table, it stated that there is a significant and positive correlation between variable X and Y. Based on the Cohen and Manion (1994), the degree of Coefficient (r) as follows:
Table 6. Level of the correlation
Value Description
< – 0.20 Very Weak
0.20 – 0.35 Weak
0.35 – 0.65 Moderate
0.66 – 0.85 Strong
0.86 – > Very Strong