i
MOLECULAR BASED
CLASSIFICATION AND PHYLOGENETIC ANALYSIS OF
INDONESIAN BANANA CULTIVARS
AMIN RETNONINGSIH
POST GRADUATE SCHOOL
BOGOR AGRICULTURAL UNIVERSITY
BOGOR
ii
STATEMENT OF RESEARCH ORIGINALITY AND
INFORMATION SOURCE
This is to verify that my dissertation entitled: Molecular Based Classification and Phylogenetic Analysis of Indonesian Banana Cultivars is my own work and never been submitted to any institution before. All of the incorporated data and information here are valid and stated clearly in the text, and list in the references.
iii Indonesia Berdasarkan Penanda Molekuler, dibimbing oleh RITA MEGIA, MIEN A. RIFAI, dan ALEX HARTANA.
Kultivar pisang adalah hibrid kompleks yang telah dimodifikasi oleh berbagai macam mutasi. Nenek moyang spesifik kultivar pisang sulit ditelusuri sehingga status taksonomi dan tatanamanya menjadi rumit. Penelitian ini bertujuan mengkarakterisasi aksesi pisang dari berbagai wilayah di Indonesia menggunakan penanda mikrosatelit untuk mendapatkan klasifikasi yang stabil dan akurat dan mengungkap hubungan kekerabatan filogeni kultivar pisang menggunakan sekuen DNA kloroplas trnL-F intergenic spacer. Penelitian ini menggunakan 151 aksesi pisang yang telah diklasifikasi berdasarkan karakter morfologi dan 116 aksesi yang belum diklasifikasi. Analisis filogeni dilakukan pada 39 aksesi yang mewakili berbagai grup genom dan 12 sekuen takson Musa yang diunduh dari GenBank. Aksesi pisang dikarakterisasi menggunakan 12 primer mikrosatelit. Hasil penelitian menunjukkan 8 primer: MaCIR108; MaCIR332a; MaCIR327b; Ma-1-17; Ma-1-27; Ma-1-132; 90; dan Ma-3-139 menghasilkan alel yang jelas dan pola pita yang polimorfik. Total 267 aksesi pisang berhasil diklasifikasikan ke dalam 3 jenis hanya berdasarkan: 4 alel MaCIR108 yang berukuran lebih dari 270 bp; alel-alel MaCIR108 yang berukuran sama dengan atau kurang dari 270 bp; dan 1 alel Ma-3-90 yang berukuran 152 bp. Seratus tigapuluh aksesi AA atau AAA; dan AAA diklasifikasikan ke dalam Musa acuminata, 10 aksesi ke dalam M. balbisiana; 64 aksesi AAB dan 63 aksesi ABB ke dalam jenis hibrid M. x paradisiaca. Sebelas aksesi yang telah diidentifikasi berdasarkan karakter morfologi mengandung genom A murni dan 9 aksesi yang diidentifikasi mengandung genom B berhasil diklasifikasi ulang berturut-turut ke dalam M. x paradisiaca dan M. acuminata. Kajian ini juga memperlihatkan bahwa mikrosatelit adalah penanda yang efektif untuk mengidentifikasi kultivar pisang. Analisis 267 aksesi menggunakan 8 primer hanya mendeteksi 208 genotipe karena 88 aksesi diantaranya membentuk 29 genotipe yang identik. Secara umum aksesi pisang mengelompok sesuai dengan grup genomnya, kecuali 15 aksesi AAB, aksesi AA atau AAA; dan AAA. Hasil analisis filogeni berdasarkan sekuen trnL-F intergenic spacer menunjukkan bahwa 40 aksesi pisang yang memiliki kloroplas tipe A yang terdiri atas jenis liar AA; kultivar AA; AA atau AAA; AAA; AAB; dan ABB dapat dibedakan dengan tegas dari 11 aksesi yang memiliki kloroplas tipe B yang terdiri atas kultivar BB, AAB, dan ABB. Aksesi yang memiliki kloroplas tipe A kemungkinan diturunkan dari betina M. acuminata sedangkan aksesi yang memiliki kloroplas tipe B kemungkinan diturunkan dari betina M. balbisiana. Meskipun demikian nenek moyang acuminata spesifik masing-masing kultivar tidak teridentifikasi. Hubungan kekerabatan diantara kultivar pisang berdasarkan daerah trnL-F tidak sejalan dengan klasifikasi berdasarkan mikrosatelit kemungkinan karena ke dua penanda DNA tersebut diwariskan dengan cara yang berbeda.
iv Analysis of Indonesian Banana Cultivars, supervised by RITA MEGIA, MIEN A. RIFAI, and ALEX HARTANA.
Banana cultivars are complex hybrids and have been further modified by various mutations. The specific ancestor of the cultivars was difficult to be elucidated. Therefore, the taxonomic status and nomenclature have long been a complicated issue. The goals of the study were to characterize banana accessions from various regions in Indonesia based on microsatellite markers to obtain classification which is stable and accurate and to elucidate phylogenetic relationships of banana cultivars inferred from trnL-F intergenic spacer of cpDNA. The study was conducted using 151 accessions that have been morphologically classified and unclassified 116 accessions. Thirty nine accessions which represented various genomic groups and 12 sequences of different taxa of Musa downloaded from GenBank were used for phylogenetic analysis. Banana accessions were characterized using 12 microsatellite primers. Only 8 primers: MaCIR108; MaCIR332a; MaCIR327b; Ma-1-17; Ma-1-27; Ma-1-132; Ma-3-90; and Ma-3-139 produced clear alleles and exhibited polymorphic banding patterns. Total 267 banana accessions were effectively classified into 3 species based only on: 4 alleles of MaCIR108 with the size of more than 270 bp; alleles of MaCIR108 with the size of 270 bp or less; and 1 allele of Ma-3-90 with the size of 152 bp. There are 130 accessions of AA or AAA; and AAA designated under Musa acuminata, 10 accessions of BB designated under M. balbisiana, 64 accessions of AAB and 63 accessions of ABB designated under hybrid species M. x paradisiaca. Eleven accessions of pure the A genome and 9 accessions containing the B genome previously identified based on morphology have been reclassified into M. x paradisiaca and M. acuminata. The study also exhibited that microsatellites are an effective marker for identifying banana cultivars. Analysis of 267 banana accessions using the 8 primers detected only 208 genotypes because 88 accessions formed 29 identical genotypes. In general, the banana accessions clustered according to their genomic groups, except 15 accessions of AAB; accessions of AA or AAA; and AAA. In the phylogeny inferred from the trnL-F region, 40 accessions having the A-type chloroplast consisting of AA wild; AA; AA or AAA; AAA; AAB; and ABB cultivars were clearly differentiated from 11 accessions having the B-type chloroplast consisting of BB, AAB, and ABB cultivars. The A-type chloroplast accessions are most probably derived from female M. acuminata, while those with the B-type chloroplast may be derived from female M. balbisiana. However, the specific acuminata ancestor of each cultivar remains unidentified. Genetic relationships among banana accessions based on the trnL-F region are not in agreement with those based on the microsatellite most probably due to the differences of inheritance mode of both DNA markers.
v These cultivars are not simple but rather complex hybrids and have been further modified by various mutations. The specific ancestor of the cultivated bananas was difficult to be elucidated therefore taxonomic status and nomenclature of banana cultivars have long been a complicated issue. The objectives of the study were to characterize banana accessions from various regions in Indonesia based on microsatellites to obtain classification which is stable and accurate and to elucidate phylogenetic relationships of banana cultivars inferred from trnL-F intergenic spacer of cpDNA. The study was conducted using 151 accessions that have morphologically been classified into AA and AAA genomic groups (banana with the A genome alone) and BB; BB or BBB; AAB; and ABB genomic groups (banana containing the B genome). Unclassified 116 accessions which are recognized by local names and unknown also included in this study. Thirty nine accessions which represented various genomic groups and 12 sequences of different taxa of Musa downloaded from GenBank were employed to infer phylogeny of Indonesian banana cultivars.
To obtain convincingly diagnostic characters for the genomic groups, in the first study, 12 microsatellite primers included primer which provided diagnostic characters for the B genome were used for analyzing 59 accessions of Musa acuminata. The result showed that only 8 primers: MaCIR108; MaCIR332a; MaCIR327b; Ma-1-17; Ma-1-27; Ma-1-132; Ma-3-90; and Ma-3-139 produced clear alleles and exhibited polymorphic banding patterns. Eleven of the 59 accessions studied were incorrectly identified. They should be classified into hybrid species M. x paradisiaca due to the presence of the A and B genomic alleles in these accessions. The largest three of the MaCIR108 alleles which longer than 270 bp were included in a length range of the B genomic alleles, whereas the other 12 alleles fell into a length range of the A genomic alleles. Forty eight accessions neither exhibited status changes, nor possessed specific alleles to distinguish AA from AAA genomic groups. Difficulties in separating AA from AAA genomic groups may also as a result of the dosage effects of a microsatellite allele. The acuminata accessions having maximum 2 alleles in each primer should be designated as AA or AAA genomic group. Genetic relationship analysis showed that genomic groups of those pure acuminata cultivars could not be differentiated significantly, though most of them tend to be clustered according to ploidy level.
vi 3 genomic groups, including 2 species: which are 8 accessions of BB designated under M. balbisiana, 33 accessions of AAB and 42 accessions of ABB designated under M. x paradisiaca. These accessions clustered according to their genomic groups. At the same similarity coefficient, ABB forming fewer clusters than the AAB genomic groups indicated that the contribution of the B genome is less diverse than that of the A genome. The similarity coefficient at 0.61 produced 11 subclusters of AAB, 4 subclusters of ABB, and 1 subcluster of BB. These accessions also tend to be clustered according to their subgroups.
In the third study, the 116 banana accessions were classified into genomic groups using the determination key. These accessions were classified into 5 genomic groups, including 3 species. Twenty seven accessions of AA or AAA; and 46 accessions of AAA were classified into M. acuminata, 2 accessions of BB were classified into M. balbisiana, 21 accessions of AAB and 20 accessions of ABB were included in M. x paradisiaca. The third study also detected 1 allele of the Ma-3-139 with the size of 132 bp which can support separation of banana containing the B genome from the A genome alone. All accessions belonging to BB, AAB, and ABB genomic groups clustered together with most banana accessions of the A genome alone in the first main cluster. The second main cluster was belonging to 11 accessions consisting of AA or AAA; and AAA. BB, AAB and ABB genomic groups were clearly separated from each other. The BB appear closer to ABB than AAB genomic group. All banana accessions containing the B genome were clustered according to their genomic groups, except 4 accessions of AAB clustering together with the pure A genome accessions.
For the first time, total 267 accessions were effectively classified based only on the primers MaCIR108 and Ma-3-90 into 3 species. There are 50 accessions of AA or AAA; and 80 accessions of AAA designated under M. acuminata, 10 accessions of BB designated under M. balbisiana, 64 accessions of AAB and 63 accessions of ABB designated under M. x paradisiaca. The study also exhibited that microsatellites are an effective marker for identifying banana cultivars. Analysis of the 267 accessions detected only 208 genotypes because 88 accessions were genetically identical and grouped into 29 identical genotypes. The accessions commonly clustered according to their genomic groups, except 15 accessions of AAB and accessions of AA or AAA; and AAA.
vii Copyright © 2009, Bogor Agricultural University
All Right Reserved
1. It is prohibited to cite all or part of this dissertation without referring to and mentioning the source.
a. Citation only permitted for the sake of education, research, scientific writing, report writing or reviewing scientific problems.
b. Citation does not inflict the name and honor of Bogor Agricultural University.
viii
MOLECULAR BASED
CLASSIFICATION AND PHYLOGENETIC ANALYSIS OF
INDONESIAN BANANA CULTIVARS
AMIN RETNONINGSIH
Dissertation
Submitted as a part of requirement for the fulfillment of Doctor Degree in Biology
POST GRADUATE SCHOOL
BOGOR AGRICULTURAL UNIVERSITY
BOGOR
ix Examiner of close examination:
Dr. Ir. Tatik Chikmawati, MSi.
Lecturer of the Department of Biology,
Faculty of Mathematic and Sciences, IPB, Bogor
Examiners of open examination: 1. Dr. Ir. Sobir, MS
Lecturer of the Department of Agronomy and Horticulture, Faculty of Agriculture, IPB, Bogor
2. Dr. Dedy Darnaedi, MSc.
x Regristation number : G361020031
Approved by Advisory Committees
Dr. Rita Megia, DEA Chairman
Prof. Dr. Mien A. Rifai Prof. Dr. Ir. Alex Hartana, MSc. Member Member
Study Program of Biology Post Graduate School
Dr. Ir. Dedy Duryadi Solihin, DEA Prof. Dr. Ir. Khairil A. Notodiputro, MS Head Dean
xi To
My parents
My husband Syaiful Anwar My lovely daughters and son, Carlina Nurul Fithria
Dianthi Nurul Fadhilah
Abdurrakhman Hamid Al Azhari
xii Cultivated bananas in Indonesia are the main object of this research conducted in September 2004 to September 2007. The study highlight two topics namely classification of cultivated bananas and phylogenetic relationships of cultivated bananas developed to be four chapters in dissertation entitles: Molecular Based Classification and Phylogenetic Analysis of Indonesian Banana Cultivars.
I understand that I could not have done this dissertation without direct and indirect contributions of many others.
First, I am extremely grateful to the advisory committees, Dr. Rita Megia, DEA (Department of Biology, IPB); Prof. Dr. Mien A. Rifai (Herbarium Bogoriense, LIPI); and Prof. Dr. Ir. Alex Hartana, MSc. (Department of Biology, IPB) for all the advice, support and encouragement during every step of this dissertation. I also thank for their criticism of the manuscript and giving me the freedom to explore into this particular topic of my interest.
I gratefully acknowledge the BPPS scholarship from Directorate General of Higher Education (DIKTI), Department of National Education Republic Indonesia; PKBT IPB for funding this research through “Riset Unggulan Nasional” (Rusnas) in 2004 to 2005; and DIKTI Fundamental Research Grant in 2005 to 2006.
I would like to thank Ir. Agus Sutanto, MSc., Ir. HS. Edison and the other colleagues from Research Institute for Fruits (Balitbu) Solok, West Sumatra; Bambang and Partomo from Diperta Yogyakarta; Adi (PPSHB, IPB), and Margareta Rahayuningsih, SSi., MSi. (Department of Biology, UNNES) for their help in collection of plant materials and providing information about the accessions.
I would like to appreciate Dr. Nunik Sri Ariyanti, MSi. (Department of Biology, IPB); Dr. Karno, MAppl.Sc. and Dr. Ir. Syaiful Anwar, MSi. (Department of Animal Nutrition, Undip) for their helpful suggestions and comments on earlier drafts of the manuscript. I also thank Dr. Ir. Dedy Duryadi S, DEA, Dr. Ir. Tatik Chikmawati, MSi., Dr. Dedy Darnaedi, MSc. and Dr. Ir. Sobir, MS for their suggestions and corrections. I would like to sincerely thank Dr. Teguh Triono, Prof. Dr. Ir. Setyati Haryadi and Prof. Dr. Sudarsono for the fruitful discussion and technical support.
I am indebted to all my colleagues at Department Biology Faculty of Mathematic and Sciences, UNNES and all my friends at subprogram Plant Taxonomy Program Study Biology Post Graduate School IPB.
I would like to thank all the people who work in our laboratory, especially Ir. Donata Pandin, MSi., Dr. Fitmawati, MSi., Dr. Soaloon Sinaga, MSi., Ir. J. Eva M, MSi., Sutiyo and Heri for their cooperation and friendly help in the laboratory.
Last but not least, I remain indebted to my parents, my brothers and sisters, my husband and my children for their patience, support and persistent encouragement throughout my study.
xiii as the third child of Abdoel Masroeri and Sangadah. She graduated from Agricultural Faculty at Institut Pertanian Bogor (IPB) in 1983. She studied plant taxonomy and got master degree in Biology from Universitas Gadjahmada (UGM) in 2002. In the same time, she got scholarship for study at doctoral program at Program Study of Biology IPB from Indonesian Government, Directorate General of Higher Education, National Education Department.
She has been faculty member of Department of Biology, Faculty of Mathematic and Sciences, Universitas Negeri Semarang (UNNES) since 1990 and a member of “The Indonesian Plant Taxonomist Society” (Penggalang Taksonomi Tumbuhan Indonesia) since 2001.
xiv
LIST OF TABLES... xv
LIST OF FIGURES... xvii
ABBREVIATIONS... xviii
I. GENERAL INTRODUCTION Backgrounds... 1
Objectives... 5
II. CHARACTERIZATION AND EVALUATION OF Musa acuminata CULTIVARS IN INDONESIA BASED ON MICROSATELLITE MARKERS Abstract……..………... 7
Introduction.……...………... 7
Materials and Methods Plant materials and microsatellite primers…...………...………... 9
DNA extraction and PCR condition……....………... 10
Electrophoresis and polymorphism detection…...……...……….. 12
Data analysis..………..……….. 12
Results and Discussion..…….……….. 12
Conclusion..……..….………... 21
III. VERIFICATION AND GENETIC DIVERSITY ANALYSIS OF INDONESIAN BANANA CULTIVARS CONTAINING B GENOME BY MICROSATELLITE Abstract ……….………... 23
Introduction..………..………... 23
Materials and Methods Plant materials………...……. 25
Microsatellite analysis..……..………..……….. 27
Data analysis..………..……….. 29
Results and Discussion...………….………...……….. 29
Conclusion...….……….………... 38
IV. MICROSATELLITE MARKERS FOR CLASSIFIYNG AND ANALYZING GENETIC RELATIONSHIP OF BANANA CULTIVARS IN INDONESIA Abstract.……….………... 40
Introduction..………..………... 40
Materials and Methods Plant materials and primers.………...……….... 43
xv
Conclusion...….……….………... 58
V. PHYLOGENETIC RELATIONSHIPS OF INDONESIAN BANANA CULTIVARS INFERRED FROM trnL-F INTERGENIC SPACER OF CHLOROPLAST DNA Abstract.……….………... 60
Introduction..………..………... 60
Materials and Methods. Plant materials....……..……….. 62
DNA extraction.………..….……….. 63
DNA amplifications and sequensing... 64
Data analysis..………..……….. 64
Results.………….………..……….. 65
Discussion...……….……… 67
Conclusion...….……….………... 72
VI GENERAL DISCUSSION……….. 73
VII CONCLUSION……… 81
VIII REFERENCES………. 83
xvi 2.1 List of 59 accessions used in study of M. acuminata cultivars ..…….. 9 2.2 Primers used for detecting genetic variations among the 59 banana
accessions of M. acuminata cultivars ...……… 11 2.3 Discrete and repeatable alleles produced by the 8 mcrosatellite
primers in pure acuminata cultivars .……….... 16 3.1 List of 92 accessions used in study of banana containing the B
genome... 25 3.2 Primers used for verification and genetic diversity analysis of banana
containing the B genome ...………..………. 28 3.3 Microsatellite alleles revealed from analysis of banana containing the
B genome using the 8 microsatellite primers ..………... 30 3.4 List of the 9 banana accessions incorrectly classified into banana
containing the B genome ………..……… 30 3.5 Classification of banana accessions into genomic groups based on
the primers MaCIR108 and Ma-3-90 ..………...…….. 31 3.6 Number of accessions classified into the genomic groups based on
the primers MaCIR108 and Ma-3-90..………..……… 34 4.1 List of 116 accessions used in study of cultivated banana
classification and genetic relationship analysis………... 43 4.2 Primers used to classify the cultivated bananas and to investigate the
genetic relationships among the 116 banana accessions ……….. 46 4.3 List of 73 accessions classified into AA or AAA; and AAA genomic
groups based on the primers MaCIR108 and Ma-3-90 ...………. 48 4.4 List of 43 accessions classified into BB, AAB and ABB genomic
groups based on the primers MaCIR108 and Ma-3-90..………... 51 4.5 Alleles size, number of alleles and observed heterozygosity value
produced from analysis of the 116 accessions using the 8
microsatellite primers ………….…...……..………. 54 4.6 Nine identical genotypes observed in the 116 banana accessions
xvii 6.1 Recapitulation of the accessions number classified into their genomic
groups based on alleles of the MaCIR108 and allele of the Ma-3-90
with the size of 152 bp………...……….. 75 6.2 Homonymous cultivars observed in the 267 Indonesian banana
xviii 2.1 Allele pattern of primer MaCIR327b……… 13 2.2 Sequences comparison of acuminata and balbisiana alleles of locus
MaCIR108………. 14 2.3 Dendrogram generated from analysis of the 48 accessions of pure
acuminata cultivars using the 8 microsatellite primers ….…………... 19 3.1 Dendrogram from analysis of the 83 banana containing the B
genome based on the 8 microsatellite primers...………... 36 4.1 UPGMA clustering of the 116 banana accessions in Indonesia based
on the 8 microsatelite primers..………. 55 5.1 A strict consensus tree from analysis data sets in trnL-F intergenic
spacer of cpDNA………..……… 66
5.2 Slanted cladogram depicting relationships among banana accessions supposed have the A- and the B-type chloroplast using the trnL-F
intergenic spacer of cpDNA………….……… 69 6.1 The 208 genotypes resulted from UPGMA clustering of the 267
xix AP-PCR: arbitrarily primed PCR
bp: base pairs C: celcius
CI: consistency index
CIRAD: Centre de Cooperation Internationale en Recherche Agronomique pour le Development
cpDNA: chloroplast DNA
CYMMIT: International Maize and Wheat Improvement Center DNA: dioxyribonucleic acid
dNTPs: deoxynucleotide triphosphates Deptan: Departemen Pertanian
EDTA: ethylene diamintetra acetic acid EtBr: ethidium bromide
ICBN: International Code of Botany Nomenclature
ICNCP: International Code of Nomenclature for Cultivated Plants
INIBAP: International Network for the Improvement of Banana and Plantain IPGRI: International Plant Genetic Resources Institute
ISSR: Inter- simple sequence repeat M: molar
MgCl2: magnesium chlorida mg/ml: miligram per mililitre
MGIS: Musa Germplasm Information System min: minute
mM: milimolar
m.p.t: most parsimony tree n: gametic chromosome number NaCl: natrium chlorida
ng µl-1: nanogram per microlitre
xx PEG: polyethylene glycol
pH: power of hydrogen
RFLP: restriction fragment length polymorphism RI: retention index
RNAse: ribonuclease s: second
SAHN: Sequential, Agglomerative, Hierarchical and Nested SDS: sodium dodecyl sulfate
SSR: simple sequence repeat
SYMQUAL: Similarity of Qualitative Data TAG: Taxonomy Advisory Group
Taq: Thermus aquaticus
TBR: tree bisection reconnection
TE: tris ethylene diaminetetra-acetic acid
Tris: 2-amino-2-(hydroxymethyl)-1,3-propanediol trnL: transfer RNA gene for leucine
trnF: transfer RNA gene for phenylanaline u µl-1: unit per microlitre
UNCST: Uganda National Council for Science and Technology
UPGMA: Unweighted Pair-Grouping Method with Arithmatic Average W: watt
Indonesia is one of the main areas of banana diversity. Besides 9 subspecies
of wild Musa acuminata recorded by Daniells et al. (2001), there were more than 325 banana cultivars, 14 cultivars of them have been commercially cultivated
(Setyadjit et al. 2003). Pollefeys et al. (2004) recorded 15 subspecies but some of them were not entered in Musa Germplasm Information System (MGIS) due to the lacking of geographical data. The cultivars are not simple but rather complex
hybrids and have been further modified by various mutations (Pillay et al. 2003). The specific ancestor of these cultivars was difficult to be elucidated. Therefore,
the taxonomic status and nomenclature of banana cultivars have long been a
complicated issue (Valmayor et al. 2000).
M. paradisiaca L. and M. sapientum L., the original scientific names applied to cultivated (edible) bananas were refused either by Cheesman (1948) or
by Simmonds and Shepherd (1955) because the cultivars are quite distinct from
each other. M. paradisiaca and M. sapientum which were known as plantain and dessert bananas were described using very limited specimens (Valmayor et al. 2002). The descriptions which were very simple could not be used to deal with the
high variability of cultivated bananas in the centre of diversity. Therefore, the
adoption of Linnaeus classification in Southeast Asia often led to
misunderstanding.
Edible bananas were believed arise from wild and seedy M. acuminata Colla (2n, AA genome) and M. balbisiana Colla (2n, BB genome) (Simmonds and Shepherd 1955). The balbisiana species is also widely distributed in Indonesia, although some authors believed that it did not originate from this
region. Sterility and parthenocarpy occurring in both species yielded the diploid
primitive clones. The clones retained the unique morphological characteristics of
their wild ancestors due to the seedless of the clones. Therefore they should be
classified under the same species as their ancestors (Valmayor et al. 2002). Seedless triploid cultivars developed through chromosome restitution. These
cultivars should also be designated under the same species because
al. 2000). The cultivars which have intermediate characteristics between the two species should be named under the hybrid species M. x paradisiaca L. This name is an agreement with the priority of usage principles as Linnaeus first applied this
term to a hybrid clone in 1753 ahead of his description of M. sapientum in 1759. The prefix x is inserted for indicating their hybrid nature as instructed by the
International Code of Nomenclature for Cultivated Plants (ICNCP).
Two natural species and a hybrids complex make up the edible bananas in
existence (Stover and Simmonds 1987; Espino et al. 1997). M. acuminata and M. balbisiana are recognized in their wild and cultivated forms. A number of AA diploid cultivars was derived from intraspecific hybridization between various
subspecies of M. acuminata (Simmonds 1962), while AAA triploids have arisen either from the AA diploid cultivars or subspecies of AA wild by meiotic
chromosome restitution. A similar development also occurred to lead appearance
of diploid and triploid balbisiana cultivars. On the other hands, the hybrids of M. x paradisiaca emerged in different genomic combination and ploidy levels. The AAB and ABB cultivars were originated from interspecific hybridization between
M. acuminata (AA) and or maybe AAA; and M. balbisiana (BB) (Stover and Simmonds 1987; Pillay et al. 2004). Hybridization between heterogenomic parents also produced a range of genotypes. Crossing between the AAB and a
wild diploid parent of AA or BB could produce progeny within various genomic
groups (Karamura 1998).
Banana taxonomic status and nomenclature could be determined by their
genomic groups (Pilley et al. 2004). After determining genomic groups, the species can be easily identified or vice versa. The cultivars then are described
following the Descriptors for Banana (Musa spp) published by IPGRI-INIBAP/CIRAD (1996). Finally, the banana cultivars are classified following the
three tier system consisting of species, genomic group and cultivar (Valmayor et al. 2002).
The banana cultivars were morphologically classified into genomic groups
based on scoring system of 15 diagnostic characters. Using these characters, wild
Each character similar to acuminata was scored 1 and this with extreme balbisiana appearance was scored 5. Intermediate expressions were scored 2, 3 and 4 depending on intensity of each character. The scorecard provides a range
from 15 to 75. The AA and AAA genomic groups of pure acuminata cultivars should have scores from 16 to 25 whereas the score of pure balbisiana BB and BBB cultivars ranged from 70 to 74. The hybrids between M. acuminata and M. balbisiana should have scores from 26 to 69.
Based on morphological characters, several banana accessions in the study
of Jumari (2000) have been classified into different genomic groups from those
reported by Pudjoarinto et al. (1994) and Hadisunarso et al. (1995). Morphological characters have high heritability and easily observed with naked
eyes (Ferreira 2005), but they are sometimes hardly interpreted because they are
mostly qualitative and do not have distinct boundaries. Morphological characters
are also affected by environmental factors, so that the phenotypic identification is
frequently incorrect. It is clear that morphological characters alone could not be
employed to precisely determine banana genomic groups.
Characterization and evaluation of cultivars based on molecular markers
were more accurate than morphological characters (Guzow-Krzeminska et al. 2001; Vicente et al. 2005). The occurrence of intra and interspecific hybridization, clonal propagation, and polyploidization sometimes exhibited different variation
patterns which are difficult to be recognized (Spooner et al. 2003). Therefore, cultivar identification to obtain characteristics such as differences, uniformity, and
stability (Rifai 2006) need conducting through molecular approaches (Vicente et al. 2005). Stability and predictability of cultivars are important for agronomist and horticulturist. Based on a specific character or combination of characters, each
cultivar should be clearly identified and exhibit unique differences. When
propagated by suitable methods either reproduced by seeds or cuttings, the plant
retains its distinguishing characteristics (Brickell et al. 2004).
The cultivar characteristics were recognized through a classification system
providing information of natural variation of the cultivar or culton units and
information of its phylogenetic relationships (Brandenberg 1986). The
Currently, cultivars were only identified with scientific names of the species.
Several important crops have been developed up to the cultivar level, but the
nomenclature given is usually not following the international codes. Since many
cultivated plants in Indonesia provide a large contribution to the national
economy, Rifai (2006) proposed the priority of the cultivated plant classification
system should be given to agricultural commodities which can be mass produced
and prospective to be exported.
Bananas are a strategic commodity to the export market (Areas et al. 2003) which is potential to increase income and foreign exchange (Deptan 2005).
Besides it grows easily, banana is also cheap sources of energy during the "hunger
gap" between crop harvests. Therefore it contributes significantly to food and
income security of people (Lustig 2004; UNCST 2007). The banana produces
fruit in any season with a relatively short period of a life cycle, can be propagated
using in vitro technique, and cultivated in a mass (Deptan 2005). Therefore, the studies on classification of cultivated bananas in Indonesia become urgent today.
The molecular markers provide an objective way for genomic classification
in Musa (Pillay et al. 2006). Microsatellites or simple sequence repeats (SSRs) are DNA sequences with repeat lengths of a few base pairs (Innan et al. (1997). This marker analysis is one of the most useful methods to expose diversity of banana
cultivars (Kaemmer et al. 1997; Crouch et al. 1998). They were abundant and widely dispersed throughout the whole Musaceae genomics (Lagoda et al. 1997) and they have been used for genotypic identification of many plant species (Perera
et al. 2001; Chakravarthi and Naravaneni 2006). Microsatellites are flanked by two conserved sequences and detected in a specific locus (Spooner et al. 2004; Semagn et al. 2006). Their polymorphisms could easy to be detected using primers designed from these flanking regions (Innan et al. 1997). In previous study of banana, a few microsatellite primers were proven to provide diagnostic
characters for genomic groups (Kaemmer et al. 1997; Creste et al. 2003, 2005). Banana cultivars could be incorrectly identified may be due to the plasticity of
morphological characters. Therefore, a classification of cultivated bananas using
The banana production around the world trends is triploid banana cultivars
(Sharrock and Frison 1999). These cultivars are currently threatened by several
pests and diseases, so the new resistant cultivars are urgently needed. There is a
continuing effort to improve the new resistant cultivars by introducing useful
genes from their wild diploid parent, hence the phylogenetic relationships
between the wild diploid progenitors and the cultivars need to be elucidated
(Carreel et al. 2002). The use of molecular genetic analysis may significantly improve breeding efficiency (Tenkouano et al. 1999). According to Carreel et al. 2002) chloroplast DNA (cpDNA) which is sitoplasmic DNA was considered an
essential tool for phylogeny analysis and may suggest a powerful tool to conform
hybrid origins of banana cultivars. The transmission monoparental of cpDNA
provide an exceptional opportunity for studying maternal lineages. In banana,
cpDNA heredity could be used for distinguishing maternal from paternal lineages.
According to Gielly and Taberlet (1996), the intergenic spacer of the trnL-F is noncoding regions in cpDNA which was suitable for phylogenetic studies due to
its small size. The size only ranged from 120 to 350 bp in flowering plant. This
region is also uniparentally inherited, not recombining and structurally relatively
stable (Barcaccia et al.2007). As compared to coding regions in cpDNA, the trnL-F intergenic spacer may develop at rates three times faster than that the coding regions. Therefore, this region may give reasonable resolution within Musa, although it was lower than that of a nuclear based phylogeny (Gielly et al. 1996).
Objectives
The main objective of this study is to obtain a classification which is stable
and accurate and a phylogenetic inference of cultivated bananas in Indonesia
based on molecular approaches. The banana accessions previously classified
based on morphological characters and accessions that have not been classified
were characterized and identified, verified, classified, and analyzed their genetic
relationships using molecular characters. The phylogenetic inference of cultivated
bananas was elucidated using the noncodingof cpDNA.
To achieve the goals of the study, the research was performed following
morphological characters was tested. In the first study, the microsatellite primers
included primer which provided diagnostic characters for the B genome
(Kaemmers et al. 1997) was employed for analyzing M. acuminata cultivars containing the A genome alone. The accessions were correctly classified into AA
or AAA genomic groups when the allele indicating the B genome were absent in
the acuminata accessions. In the second study, the primers were employed to confirm banana accessions containing the B genome and to create a determination
key, and then in the third study, the microsatellite determination key was used to
classify banana accessions which were previously unidentified yet. Finally, in the
fourth study, several accessions representing various genomic groups from the
first, the second, and the third study were used for phylogenetic analyzing of
II. CHARACTERIZATION AND EVALUATION OF
Musa acuminata
CULTIVARS IN INDONESIA BASED ON
MICROSATELLITE MARKERS
ABSTRACT
Difficulties in identifying Musa acuminata cultivars are caused by their large variations, numerous names and synonyms. The morphological characters provide limited information therefore identifying cultivars could be difficult. The objectives of this study were to verify taxonomic status, to identify and to reveal genetic relationships among banana accessions based on microsatellite markers. The DNA of 59 banana accessions which have morphologically been classified into AA and AAA genomic groups was analyzed using 12 primers. The results showed that only 8 primers producing discrete and repeatable alleles. The number of alleles per primer ranged from 5 for the MaCIR327b to 15 for the MaCIR108 and the Ma-1-139. The largest three of the MaCIR108 alleles included in length range of the B genomic alleles, whereas the other 12 alleles fell into length range of the A genomic alleles. Hence, the 11 accessions having alleles of the A and B genomes have been incorrectly classified into M. acuminata cultivars. They should be placed in hybrids species M. x paradisiaca. Forty eight accessions studied neither exhibited status change, nor possessed specific alleles to distinguish between AA and AAA genomic groups. Difficulties in separating AA from AAA may also as a result of the dosage effects of a microsatellite allele. Therefore, the accessions having maximum 2 alleles in each primer should be designated as AA or AAA genomic group. Due to the presence of 6 identical genotypes consisting of 12 accessions, there were detected only 42 genotypes resulted from analysis of the 48 accessions using the 8 primers. Genetic relationship analysis showed that genomic groups of those pure acuminata cultivars could not be differentiated significantly, though most of them tend to be clustered according to ploidy level.
Key words: banana, genomic group, microsatellite, M. acuminata, taxonomic status
INTRODUCTION
Large variations, numerous names and synonyms in Musa acuminata cultivars led to difficulties in cultivar identification (Valmayor et al. 2000). The differences in the A genome size as reported by Lysak et al. 1999, Kamate et al. 2001 and Dolezel et al. 2004 was indicated to contribute large variations within M. acuminata cultivars. Distinguishing cultivars based on morphological characters could be difficult because the information provided by morphological
cultivars (Sefe et al. 2001). Therefore, International Network for the Improvement of Banana and Plantain (INIBAP) (2006a) proposed to investigate synonymy and
variation among cultivars through molecular studies.
Molecular markers have played essential role in plants identification
(Schulman 2006; Heslop-Harrison and Schwarzacher 2007). These techniques
were more capable in distinguishing one individual or group of individuals from
the others than morphological method (Ford-Lloyd et al. 1997). Several molecular techniques have been employed for analyzing genetic diversity of Musa, such as AFLP (Ude et al. 2002; Wong et al. 2002), cpDNA PCR-RFLP (Ge et al. 2005), ISSR (Racharak and Eiadhong 2007), AP-PCR (Agoreyo et al. 2008), and SSR or microsatellite (Creste et al. 2003, 2004).
Microsatellite marker analysis is one of the most informative methods for
exposing diversity of banana cultivars (Kaemmer et al. 1997; Crouch et al. 1998). The markers are abundant and widely dispersed throughout Musaceae genomics (Lagoda et al. 1997). Microsatellies are highly polymorphic since their length may vary among individuals (Creste et al. 2005). In additions, the markers were codominant, reproducible, and easy to be interpreted (Crouch et al. 1999). Microsatellites were easier to be used than RFLP (Holton 2001) because they can
be amplified using PCR methods. The methods have some advantages compared
to hybridization-based techniques, particularly if large numbers have to be
investigated (Kaemmer et al. 1997). Microsatellites are also indicated as a well-suited method for marker-assisted selection in Musa (Crouch et al. 1998). Kaemmer et al. (1997) suggested that microsatellite should be used as an anchor marker for a core map of banana genetic.
The purposes of this study were to clarify taxonomic status, to determine the
importance of microsatellite markers in identifying M. acuminata cultivars previously identified based on morphological characters, and to reveal their
MATERIALS AND METHODS
Plant materials and microsatellite primers
Fifty nine accessions of M. acuminata cultivars from various regions in Indonesia were used in this study (Table 2.1). These accessions have been
previously identified based on morphological characters, and classified into AA
and AAA genomic groups (Jumari 2000; Jumari and Pudjoarinto 2000; Edison et al. 2004; INIBAP 2002a; Siddiqah 2002).
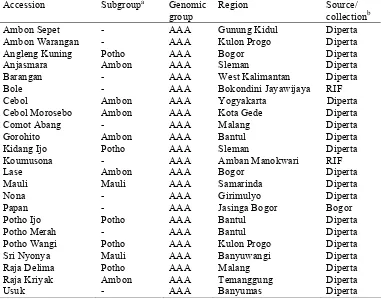
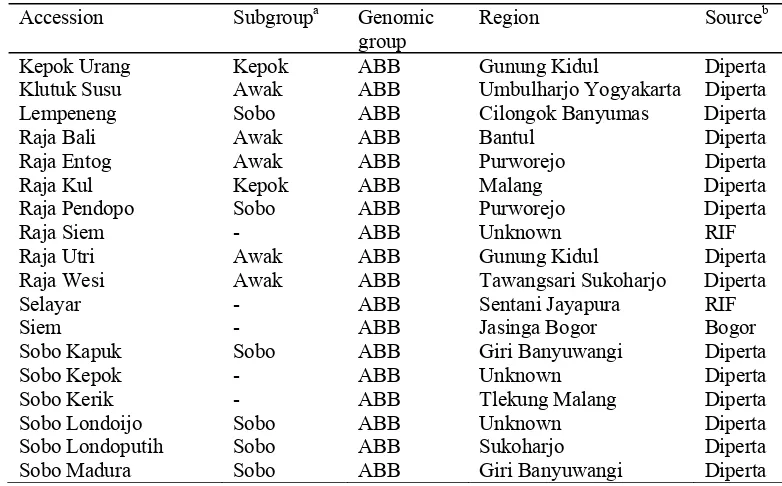
Table 2.1 List of 59 accessions used in the study of M. acuminata cultivars Accession Subgroupa Genomic
group
Region Source/ collectionb Berlin Pisang Mas AA Banyuwangi Diperta Cici Gading Pisang Becici AA Tegalsari Diperta Cici Kuning - AA Tegalsari Diperta Cici Merah - AA Sukoharjo Diperta Emas Batangmerah - AA Bukit tinggi RIF Fungkah Mos - AA Amban Manokwari RIF Keja - AA Sentani Jayapura RIF Koja Pretel Pisang Mas AA Gunung Kidul Diperta Koumus - AA Amban Manokwari RIF Lilin Pisang Becici AA Palembang Diperta Mas - AA Jasinga Bogor Bogor Mas Besar Pisang Mas AA Uknown Diperta Mas 40 Hari Pisang Mas AA Uknown Diperta Monyet Pisang Becici AA East Java Diperta Mulih Hijau - AA Jasinga Bogor Bogor Mulih Putih - AA Jasinga Bogor Bogor Neij Sehi - AA Ransiki Jayapura RIF Penjalin Pisang Mas AA Sleman Diperta Pinang Pisang Mas AA Banyuwangi Diperta Raja Wligi Pisang Mas AA Purworejo Diperta Rejang Pisang Mas AA Sleman Diperta
Rejang - AA Unknown RIF
Tegetmolo - AA Bokondini Jayawijaya RIF
Tolu - AA Unknown RIF
Table 2.1 List of 59 accessions used in the study of M. acuminata cultivars (continued)
Accession Subgroupa Genomic group
Region Source/ collectionb Ambon Sepet - AAA Gunung Kidul Diperta Ambon Warangan - AAA Kulon Progo Diperta Angleng Kuning Potho AAA Bogor Diperta Anjasmara Ambon AAA Sleman Diperta Barangan - AAA West Kalimantan Diperta Bole - AAA Bokondini Jayawijaya RIF Cebol Ambon AAA Yogyakarta Diperta Cebol Morosebo Ambon AAA Kota Gede Diperta Comot Abang - AAA Malang Diperta Gorohito Ambon AAA Bantul Diperta Kidang Ijo Potho AAA Sleman Diperta Koumusona - AAA Amban Manokwari RIF Lase Ambon AAA Bogor Diperta Mauli Mauli AAA Samarinda Diperta Nona - AAA Girimulyo Diperta Papan - AAA Jasinga Bogor Bogor Potho Ijo Potho AAA Bantul Diperta Potho Merah - AAA Bantul Diperta Potho Wangi Potho AAA Kulon Progo Diperta Sri Nyonya Mauli AAA Banyuwangi Diperta Raja Delima Potho AAA Malang Diperta Raja Kriyak Ambon AAA Temanggung Diperta Usuk - AAA Banyumas Diperta
a.
following the subgroup determination key constructed by Jumari (2000) and Jumari and Pudjoarinto (2000)
b1
Diperta, Dinas Pertanian dan Kehewanan, Yogyakarta b2
RIF, Research Institute of Fruits, Solok West Sumatera
Characterization and evaluation of AA and AAA genomic groups was
conducted using 12 microsatellite primers synthesized by Invitrogen life
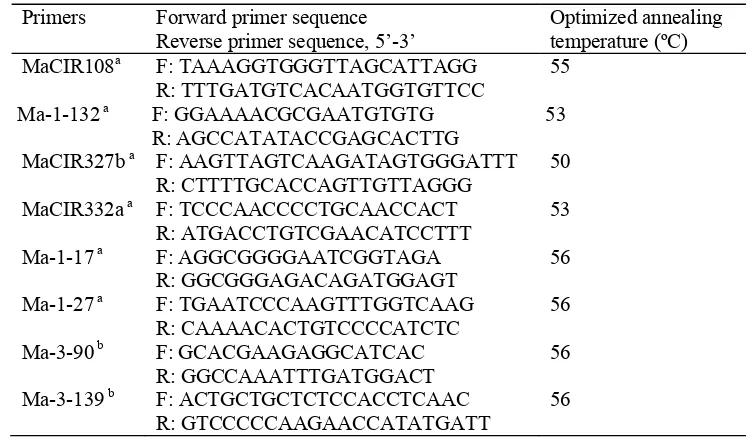
technologies Japan® (Table 2.2). The eight primers were designed by Kaemmer et al. (1997) while the remaining 4 primers were designed by Crouch et al. (1998). The MaCIR108 designed by Kaemmer et al. (1997) was known to provide diagnostic characters for banana accessions containing B genome (Kaemmers et al. 1997; Creste et al. 2003). The B genomic characters were derived from the other ancestral parent of most cultivated bananas namely M. balbisiana Colla (Stover and Simmonds 1987).
DNA extraction and PCR condition
Total DNA was extracted from youngest fresh leaves for each accession by
without PEG solution, quantified using spectrophotometer, and then diluted to an
estimated concentration of 10 ng μl-1. Amplification of microsatellite region was
performed following modified Kaemmer et al. (1997) procedure. PCR reactions were mixture of 10 μl volume containing 1.5 μl DNA template, 1 μl 10 x PCR
buffer with 20 mM MgCl2, 0.2 μl 10 mM dNTPs, 0.2 μl 10 µM of each primer,
and 0.06 μl 5 u μl-1 Taq DNA Polymerase Native (GenScript Corporation®). The
amplifications were performed in a Perkin Elmer 2400 thermocycler®,
programmed with an initial denaturing step at 94ºC for 5 min, followed by 35
amplification cycles consisting of 30 s denaturation at 94ºC, 30 s annealing at
specific melting temperature of each primer (Table 2.2), and 30 s extension at
[image:31.612.117.510.335.654.2]72ºC, and ending with a final extension at 72ºC for 10 min.
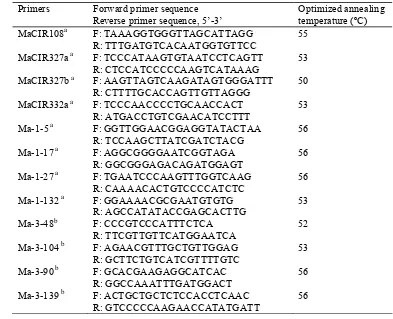
Table 2.2 Primers used for detecting genetic variations among the 59 banana accessions of M. acuminata cultivars
Primers Forward primer sequence Reverse primer sequence, 5’-3’
Optimized annealing temperature (ºC) MaCIR108a F: TAAAGGTGGGTTAGCATTAGG
R: TTTGATGTCACAATGGTGTTCC
55
MaCIR327a a F: TCCCATAAGTGTAATCCTCAGTT R: CTCCATCCCCCAAGTCATAAAG
53
MaCIR327b a F: AAGTTAGTCAAGATAGTGGGATTT R: CTTTTGCACCAGTTGTTAGGG
50
MaCIR332a a F: TCCCAACCCCTGCAACCACT R: ATGACCTGTCGAACATCCTTT
53
Ma-1-5 a F: GGTTGGAACGGAGGTATACTAA R: TCCAAGCTTATCGATCTACG
56
Ma-1-17 a F: AGGCGGGGAATCGGTAGA R: GGCGGGAGACAGATGGAGT
56
Ma-1-27 a F: TGAATCCCAAGTTTGGTCAAG R: CAAAACACTGTCCCCATCTC
56
Ma-1-132 a F: GGAAAACGCGAATGTGTG R: AGCCATATACCGAGCACTTG
53
Ma-3-48b F: CCCGTCCCATTTCTCA R: TTCGTTGTTCATGGAATCA
52
Ma-3-104 b F: AGAACGTTTGCTGTTGGAG R: GCTTCTGTCATCGTTTTGTC
53
Ma-3-90 b F: GCACGAAGAGGCATCAC R: GGCCAAATTTGATGGACT
56
Ma-3-139 b F: ACTGCTGCTCTCCACCTCAAC R: GTCCCCCAAGAACCATATGATT
56
a
Primers designed by Kaemmer et al. 1997 b
Electrophoresis and polymorphism detection
Electrophoresis was performed in 6% denaturized polyacrylamide gels 7 M
Urea (Sigma-Aldrich Chemie Germany®), and its product was visualized by
silver staining according to modified Creste et al. (2001) method. Though all solutions were prepared using distilled water, all chemicals used for staining were
analytical grade.
Data analysis
Characterization and evaluation were carried out based on the presence of
microsatellite bands from each accession. Each band variant was treated as an
allele. Different sizes of these alleles were estimated by a 100-bp ladder molecular
size standard (Invitrogen life technologies Japan®). Alleles were scored for
presence (1) or absence (0). Heterozygous genotype exhibited 2 alleles for diploid
or triploid and 3 alleles for triploid, while homozygous genotype exhibited only 1
allele. Similarity estimation was conducted based on Jaccard coefficient using
Similarity of Qualitative Data (SYMQUAL) procedure. Sequential,
Agglomerative, Hierarchical and Nested (SAHN) clustering was performed using
procedure of Unweighted Pair-Grouping Method with Arithmatic Average
(UPGMA) and plotted in a dendrogram using the Tree Plot function of the
NTSYSpc version 2.02 (Rohlf 1998).
RESULS AND DISCUSSION
Eight of the 12 primers used for analyzing the accessions generated discrete
and repeatable alleles and showed polymorphic banding patterns. The size of
alleles approximately from 110 to 436 bp with polymorphism degree per primer
ranged from 5 to 15 alleles. The highest degree of polymorphism was observed in
the Ma-3-139 and the MaCIR108, and the lowest was detected in the MaCIR327b.
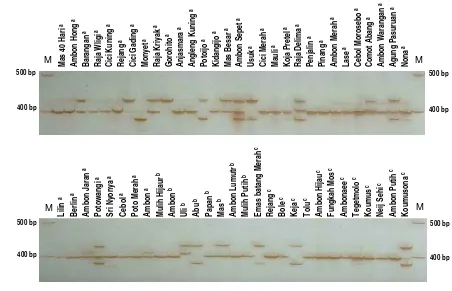
The allele polymorphism obtained from primer MaCIR327b is shown in Figure
Figure 2.1 Allele pattern of primer MaCIR327b. Lane M is 100-bp DNA ladder, accessiona obtained from collection of Diperta, Yogyakarta, accessionb obtained from fields of cultivated bananas in Jasinga Bogor, West Java, and accession c obtained from collection of RIF Solok, West Sumatera
The largest three of 15 alleles of the MaCIR108 were indicated as
diagnostic characters for banana containing the B genome. The length of those
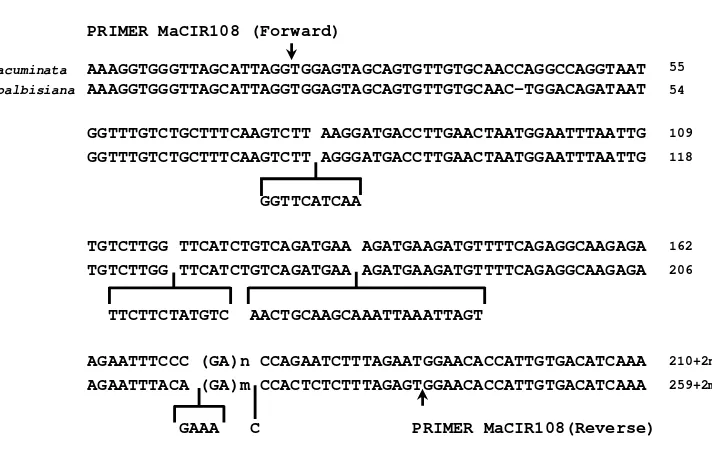
alleles was within the size rangeof M. balbisiana alleles, whereas the size of other 12 alleles fell into the length range of M. acuminata alleles. Similar allele sizes were discovered firstly by Kaemmer et al. (1997), and then have been used for characterizing banana germplasm in Brazil (Creste et al. 2003). According to Kaemmer et al. (1997), the flanking region size of the B genomic allele is 259 bp which is 49 bp longer than that of the A genomic allele (Figure 2.2). The number
of perfect repeat varied between 4 and 30 units, depending on the microsatellite
consensus. Besides that, the perfect sequence repeats of the MaCIR108 are
dinucleotide types. Thus, expectation of minimum size of the B genomic alleles
was 259 plus 8 bp and maximum size of the A genomic alleles was 210 plus
60 bp.
500 bp
400 bp
500 bp
400 bp
500 bp 500 bp
400 bp 400 bp
Mas 40 H ar i a Am bo n Ho ng a Ba ra n ga n a Raja Wli g i a Cic i K u n ing a Re ja n g a Cic i Ga d in g a Mony et a Raja Kriy ak a Gorohito a An ja sm ar a a An glen g Ku nin g a Potoijo a Kidangijo a Mas B esar a Am bo n Sepet a Us u k a Cic i M era h a Mauli a Koja Prete l a Raja Del ima a Penjalin a Pinang a Am bo n Merah a Lase a Ce b o l M o ro se bo a Co mo t Ab an g a Am bo n Warang an a Ag un g Pasu ru an a No na a Lilin a Berlin a A m bo n J aran a Po to wa n g i a Sri N yonya a Ce bo l a Po to M era h a Amb on a Mulih Hi jaur b Amb on b Uli b Abu b Pa p an b Mas b Amb on Lumut r b Mulih P u tih b E m as batan g M erah c Re ja ng c Bole c Ke ja c Tolu c A m bo n H ijau c Fun gkah Mo s c A m bo nae e c Teget m o lo c K o um us c Neij Seh i c A m bo n P ut ih c K o um uso n a c
M M
Figure 2.2 Sequences comparison of acuminata and balbisiana alleles of locus MaCIR108. n, m= number of repeats (Kaemmer et al. 1997).
Accessions containing the number of perfect repeat of less than 5 tended to
produce a monomorphic banding pattern (Kaemmer et al. 1997). For that reason, alleles of the MaCIR108 that longer than 270 bp were assumed as alleles of the B
genome. This result supported the study of Creste et al. (2003) which also obtained alleles for the B genome from the same primer. The MaCIR108
microsattelite marker could be used for evaluating taxonomic status of banana
cultivars, especially for the accessions derived from inter and intraspecific
hybridization of M. acuminata (AA) and M. balbisiana (BB). The presence of alleles of the MaCIR108 with the size of more than 270 bp in the 11 accessions
indicated that they should not be classified into M. acuminata cultivar. In addition to the B genomic allele, they also possessed the A genomic alleles derived from
interspecific crosses between M. acuminata and M. balbisiana. As reported by Kaemmer et al. (1997), the present study also exhibited that the A genomic alleles of the MaCIR108 tend to be shorter than alleles of the B genome.
Ten of the 11 accessions consisting of ‘Keja’, ‘Abu’, ‘Agung Pasuruan’,
‘Ambon’, ‘Ambon Jaran’ ‘Ambon Sepet’, ‘Koumusona’, Photo Wangi’, ‘Raja
Delima’, and ‘Usuk’ showed 1 allele from the alleles size range of the B genome,
while the other accession namely ‘Comot Abang’ showed 2 alleles from the same PRIMER MaCIR108 (Forward)
M. acuminata AAAGGTGGGTTAGCATTAGGTGGAGTAGCAGTGTTGTGCAACCAGGCCAGGTAAT 55
M. balbisiana AAAGGTGGGTTAGCATTAGGTGGAGTAGCAGTGTTGTGCAAC-TGGACAGATAAT 54
GGTTTGTCTGCTTTCAAGTCTT AAGGATGACCTTGAACTAATGGAATTTAATTG 109
GGTTTGTCTGCTTTCAAGTCTT AGGGATGACCTTGAACTAATGGAATTTAATTG 118
GGTTCATCAA
TGTCTTGG TTCATCTGTCAGATGAA AGATGAAGATGTTTTCAGAGGCAAGAGA 162
TGTCTTGG TTCATCTGTCAGATGAA AGATGAAGATGTTTTCAGAGGCAAGAGA 206
TTCTTCTATGTC AACTGCAAGCAAATTAAATTAGT
AGAATTTCCC (GA)n CCAGAATCTTTAGAATGGAACACCATTGTGACATCAAA 210+2n
AGAATTTACA (GA)m CCACTCTCTTTAGAGTGGAACACCATTGTGACATCAAA 259+2m
size range. The Ambon group may be mislabeled due to the names used were
well-known to designate M. acuminata cultivars. Nomenclature of banana cultivars was determined by their genomic composition (Pillay et al. 2004) and how cultivars arising in the cultivation (Brickell et al. 2004). According to International Code of Botanical Nomenclature (ICBN) appendix I and
International Code of Nomenclature for Cultivated Plants (ICNCP) article 16, the
correct name for the 11 banana accessions is M. x paradisiaca L.
The study observed 2 accessions containing the B genome, ‘Keja’ and
‘Koumusona’ have been documented in Musa Germplasm Information System (MGIS) (Guinard et al. 2004), as AA and AAA genomic groups, respectively. This incorrect identification may due to subjectivity of scoring systems of the
morphological characters (Silayoi & Chomchalow 1987). A cultivar having score
between the ranges of 2 genomic groups was difficult to be classified (Karamura
1998). In this case, a genomic group is usually determined based on general
appearance of the plant; such as leaf habit, canal of leaf petiole and leaf blade
base. As an example, ‘Potho Wangi’ which possessed score 25 (between AA,
AAA, and AAB genomic groups), was classified into the AAA genomic group
because the canal of leaf petiole is opened with margins spreading and the both
side of leaf blade base is rounded. Both characters are usually found in the AAA
genomic group (Jumari 2000). The present analysis of ‘Potho Wangi’ using
microsatellite markers detected 1 allele of the B genome and 2 alleles of the A
genome. Therefore, the accession should be placed into the AAB genomic group
and should be designated under the name M. x paradisiaca.
Classification and nomenclature of cultivated banana remain to be
complicated issue (Valmayor et al. 2000; INIBAP 2006b). There is no publication or consensus that could be used as a reference by the banana community.
Therefore, Taxonomy Advisory Group (TAG) for Musa attempts to develop an accepted nomenclature and glossary of terms by which the Musa research community can communicate and understand each other (INIBAP 2006b). It is
hope that molecular analysis in this study could provide important contribution for
Taxonomic status of the 48 accessions studied did not change. These
accessions should be included in M. acuminata cultivars. Using the 8 primers in Table 2.2 minus the primers Ma-1-5; MaCIR327a; Ma-3-48; and Ma-3-104, a
total of 82 alleles were produced, with the mean value of 10.3 alleles per primer.
The number of alleles per primer from the 48 accessions of pure acuminata ranged from 4 to 14. The highest degree of polymorphism was observed in the
Ma-3-139 and the lowest in the MaCIR327b, with the mean observed
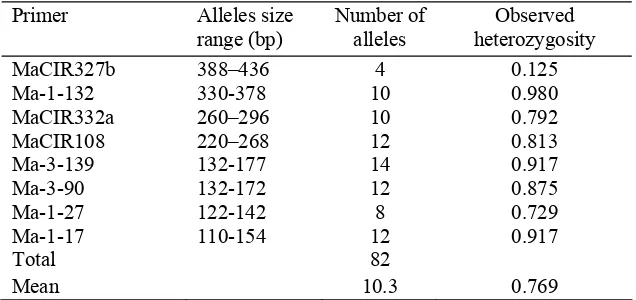
heterozygosity of 0.769. The range of allele MaCIR108 size of pure acuminata groups was from approximately 220 to 268 bp (Table 2.3). Expectation of
maximum size of the A genomic alleles is 270 bp, therefore the length range from
220 to 268 bp should be used as a diagnostic character for the A genome. This
result illustrated a variation in the A genome supported by the cytometric analysis
[image:36.612.161.479.377.527.2](Lysak et al. 1999, Kamate et al. 2001, Dolezel et al. 2004).
Table 2.3 Discrete and repeatable alleles produced by the 8 microsatellite primers in pure acuminata cultivars
Primer Alleles size range (bp)
Number of alleles
Observed heterozygosity MaCIR327b 388–436 4 0.125 Ma-1-132 330-378 10 0.980 MaCIR332a 260–296 10 0.792 MaCIR108 220–268 12 0.813 Ma-3-139 132-177 14 0.917 Ma-3-90 132-172 12 0.875 Ma-1-27 122-142 8 0.729 Ma-1-17 110-154 12 0.917
Total 82
Mean 10.3 0.769
The number of alleles obtained in the study was larger than in previous
study. Using the primers MaCIR108; Ma-1-17; Ma-3-90; and Ma-3-139, Creste et al. (2003) obtained 29 alleles from 35 accessions containing the A and B genomes. By the same primers, the present study observed 50 alleles from the 48
accessions of the A genome alone. Accessions investigated also exhibited a
greater value of observed heterozygosity than those of banana germplasm in
The high genetic diversity supported the hypothesis that Indonesia is one of the
main centre of diversity and most likely the centre of origin of M. acuminata cultivars (Daniells et al. 2001), although according to Heslop-Harisson and Schwarzacher (2007) the diversity can be found throughout Southeast Asia.
The number of alleles per accession per primer ranged from 1 to 3 either for
diploid or triploid accessions. Some accessions exhibited greater alleles than
expected from their level of ploidy. The primers Ma-1-17; Ma-3-90; Ma-3-139;
and MaCIR332a detected 3 alleles in the diploid ‘Koja Pretel’; primer Ma-1-17
detected 3 alleles in ‘Tolu’ and primer Ma-3-90 detected 3 alleles in ‘Tegetmolo’.
This result may explain the occurrence of duplicated alleles or duplicated
chromosomal regions as reported in previous study in banana (Kaemmer et al. 1997; Creste et al. 2003, 2004). The level of ploidy probably has also been incorrectly determined due to the subjectivity of morphological characters.
Therefore, based on microsatellite markers, the accessions which have 3 alleles at
least in one of the primers used should be grouped into the triploid cultivars.
However, the homozygous and heterozygous accessions having only 1 and 2
alleles respectively could not be determined their ploidy level. It may due to the
dosage effects of a microsatellite allele (Provan et al. 1996). Those accessions should be designated as AA or AAA genomic group.
The genomic group of AA was difficult to be differentiated from the AAA.
It is due to the polyploidy nature of banana. The dosage effects of a microsatellite
allele, either simplex or duplex can not be distinguished because each allele is
interpreted as unique character without considering the effect of its gene dosage
(Provan et al. 1996; Cerenak et al. 2004). For an example, the diploid and triploid cultivars having the same 2 alleles in a certain locus, the first cultivar has simplex
dosage for A1A2 and the second, duplex for A1A1A2, both seem identical by
microsatellite markers. According to Creste et al. (2003) the 2 cultivars were only possible distinguished using methods that allow the estimation of allele dosage
such as qualitative PCR. Although the genomic groups could not be differentiated
by microsatellite markers, the taxonomic status of these cultivars did not change.
primer MaCIR108, the pure acuminata accessions can be significantly distinguished from accessions containing the B genome.
The study recorded that some alleles were present only in AA and the others
existing only in AAA accessions. Among the identified alleles, 24 alleles were
located only in AA accessions, while 45 were found only in AAA accessions.
Most alleles were discovered in accessions of both banana genomic groups. None
of these alleles were consistent detected only in AA or AAA. Therefore, none of
alleles were could be considered as a marker for separating AA from AAA
genomic groups. Microsatellite markers used in this study could not distinguish
AA from AAA genomic groups because a specific microsatellite allele either for
the diploid or the triploid accessions was not found. Similar result was also
reported by Creste et al. (2004). The AA genomic groups most probably closely related to AAA because they were derived from the same subspecies of M. acuminata having continuous variation (Simmonds 1962). According to Valmayor et al. (2000), the addition of one set of chromosomes through autopolyploidy also did not change the cultivar genetic constitutions.
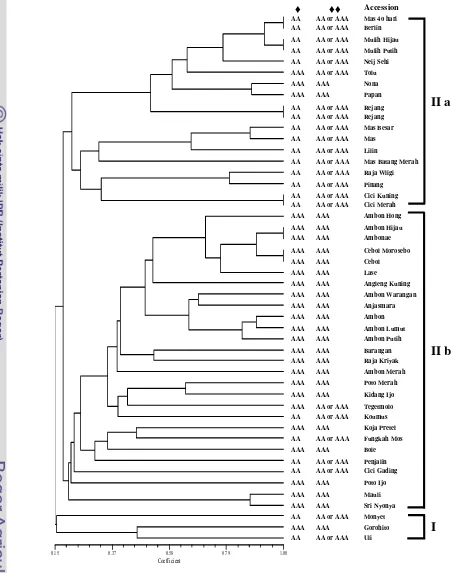
The dendrogram generated from UPGMA clustering revealed the genetic
relationship of the 48 accessions of M. acuminata cultivars (Figure 2.3). The genetic similarity coefficients ranged from 0.15 to 1.00. Coefficient 0.15 to 0.95
indicated different cultivars, and 1.00 indicated identical cultivars. The most
resemble similarity in all primers was found in 6 pairs of banana accessions.
The eight primers combination in Table 2.2 minus the primers Ma-1-5;
MaCIR327a; Ma-3-48; and Ma-3-104 detected only 42 genotypes that allowed the
discrimination of all cultivars except 6 pairs of identical accessions. Accession
‘Mas 40 Hari’ had identical genotype with ‘Berlin’, ‘Mulih Hijau’ with ‘Mulih
Putih’, ‘Rejang’ from Diperta with ‘Rejang’ from RIF collections, ‘Cici Kuning’
with Cici Merah’, ‘Ambon Hijau’ with ‘Ambonaae’, and ‘Cebol Morosebo’ with
‘Cebol’ (Figure 2.3). Justification of the 6 identical genotypes will clear using
greater number of locus. Courtois (2002) suggested commonly that at the
beginning, characterization using 8 to 9 microsatellites loci amplifying 6 to 10
alleles was adequate, but at least 15 loci were required to get an accurate identity
Figure 2.3 Dendrogram generated from analysis of the 48 accessions of pure acuminata cultivars using the 8 microsatellite primers. ♦ genomic group based on morphological characters and ♦♦ genomic group based on primer MaCIR108.
I II
Coefficient
0.15 0.37 0.58 0.79 1.00
2 85 163 171 S86 S54 76 S42 14 S40 36 169 80 S27 12 63 13 44 3 S57 S76 68 102 67 20 72 19 164 170 S93 4 17 65 104 34 S78 S85 50 S67 S41 58 15 21 47 94 16 18 165
♦ ♦♦ Accession
AA AA or AAA Mas 40 hari
AA AA or AAA Berlin
AA AA or AAA Mulih Hijau
AA AA or AAA Mulih Putih
AA AA or AAA Neij Sehi
AAA AA or AAA Tolu
AAA AAA Nona
AAA AAA Papan
AA AA or AAA Rejang
AA AA or AAA Rejang
AA AA or AAA Mas Besar
AA AA or AAA Mas
AA AA or AAA Lilin
AA AA or AAA Mas Batang Merah
AA AA or AAA Raja Wligi
AA AA or AAA Pinang
AA AA or AAA Cici Kuning AA AA or AAA Cici Merah
AAA AAA Ambon Hong
AAA AAA Ambon Hijau
AAA AAA Ambonae
AAA AAA Cebol Morosebo
AAA AAA Cebol
AAA AAA Lase
AAA AAA Angleng Kuning
AAA AAA Ambon Warangan
AAA AAA Anjasmara
AAA AAA Ambon
AAA AAA Ambon Lumut
AAA AAA Ambon Putih
AAA AAA Barangan
AAA AAA Raja Kriyak
AAA AAA Ambon Merah
AAA AAA Poto Merah
AAA AAA Kidang Ijo
AAA AA or AAA Tegetmolo
AA AA or AAA Koumus
AAA AAA Koja Pretel
AA AA or AAA Fungkah Mos
AAA AAA Bole
AA AA or AAA Penjalin
AA AA or AAA Cici Gading
AAA AAA Poto Ijo
AAA AAA Mauli
AAA AAA Sri Nyonya
AA AA or AAA Monyet
AAA AAA Gorohito
AA AA or AAA Uli
II a
II b
Clustering analysis based on the 82 alleles could not completely separate
AA or AAA; from AAA genomic groups because several accessions of AA or
AAA were clustered together with AAA or vice versa. Nevertheless, most
accessions tend to be clustered according to ploidy level. Ploidy levels of
acuminata accessions were difficult to be determined because accessions only having 1 or 2 alleles could be considered as diploid or triploid. Valmayor et al. (2000) illustrated the development of the triploid cultivar that always involved
cultivated diploid, with or without its wild type of M. acuminata. In the taxonomic scorecard suggested by Silayoi and Chomchalow (1987), AA and AAA genomic
groups have the same of score range (15-25). This explained that the diploid AA
also has morphological characteristics of triploid AAA (Simmonds 1962; Stover
and Simmonds 1987).
The dendrogram grouped the 48 accessions into 2 clusters at similarity
coefficient of 0.15. The accessions of diploid ‘Monyet’ and ‘Uli’ and triploid
‘Gorohito’ grouped in one cluster (I) presented the lowest similarity values than those of the main cluster (II). The main cluster consisted of two subclusters, IIa and IIb. The subcluster IIa was dominated by the accessions of AA or AAA genomic group, whereas the subcluster IIb was dominated by AAA genomic group.
Based on morphological characters, ‘Monyet’ was the most closely related
to wild type of M. acuminata (Jumari 2000). Taxonomically, this accession was classified into M. acuminata subsp. zebrina (Simmonds 1962). The cultivated bananas were commonly derived from subsp. banksii or subsp. errans (Carreel et al. 2002). The development of ‘Gorohito’ and ‘Uli’ perhaps associate with a wild type of M. acuminata subsp. zebrina.
Most accessions especially for AA or AAA genomic groups collected from
Diperta, based on microsatellite markers tend to be clustered according to their
subgroups constructed based on fruit morphology (Jumari 2000; Jumari and
Pudjoarinto 2000). The subcluster IIa most probably consisted of diploid AA. The diploid AA was divided into 2 subgroups: Pisang Mas and Pisang Becici, while
the triploid AAA was separated into 3 subgroups: Ambon, Mauli and Potho as
each other by the number of seeds and taste of fruits, while subgroups of the
triploid AAA were separated by the length, apex and peel color of fruits.
Generally, the subcluster IIa contained accessions of subgroup Pisang Mas bearing seedless and sweet fruit, but in the subcluster IIb, there are not found specific alleles which could differentiate subgroups of the triploid AAA.
This study also detected the presence of variability of accessions from the
same subgroup. On the other hands, Creste et al. 2003 reported high level genetic similarity between cultivars in Brazil from the same subgroup. The results showed
that banana accessions in Indonesia most probably have a larger diversity than
those in Brazil. A high degree polymorphism within the subgroups of the A
genome alone was possible to indicate a high degree of variability which present
within the M. acuminata complex (Carreel et al. 2002) discovered throughout Indonesia (Daniells et al. 2001; Pollefeys et al. 2004).
CONCLUSION
Taxonomic status of cultivated bananas in Indonesia could be determined
using only one microsatellite primer namely the MaCIR108. The eleven
accessions previously classified using morphological characters as M. acuminata should be changed into M. x paradisiaca. The key character for this alteration is 3 alleles of the MaCIR108 which longer than 270 bp. These alleles included in the
length range of the B genomic alleles, whereas the other alleles which less than
270 bp fell into the length range of the A genomic alleles. Due to possessing the A
and the B genomic alleles, the 11 accessions should be placed in hybrids species
M. x paradisiana. Taxonomic status of the 48 banana accessions studied did not change. The analysis result of the 48 accessions based on the 8 primers indicated
that no specific alleles which could differentiate AA from AAA genomic groups.
Difficulties in separating these genomic groups may also due to the dosage effects
of a microsatellite allele. Therefore, the accessions having maximum 2 alleles in
each primer were designated as AA or AAA genomic group. Analysis of pure
Genetic relationship analysis showed that genomic groups of those pure
III. VERIFICATION AND GENETIC DIVERSITY ANALYSIS
OF INDONESIAN BANANA CULTIVARS CONTAINING
B GENOME BY MICROSATELLITE
ABSTRACT
Genetic diversity of bananas in Indonesia is considered to be high. Phenotypic identification of banana accessions is sometimes incorrect due to instability of morphological characters. The aims of this study were to verify banana accessions containing the B genome previously identified based on morphological characters, to construct molecular determination key for the genomic groups, and to reveal genetic relationships among the accessions based on the microsatellite markers. The DNA of 92 banana accessions containing the B genom