This art icle was dow nloaded by: [ Yohandri Azw ir] On: 16 Oct ober 2013, At : 02: 22
Publisher: Taylor & Francis
I nform a Lt d Regist ered in England and Wales Regist ered Num ber: 1072954 Regist ered office: Mort im er House, 37- 41 Mort im er St reet , London W1T 3JH, UK
Journal of Electromagnetic Waves and
Applications
Publicat ion det ails, including inst ruct ions f or aut hors and subscript ion inf ormat ion:
ht t p: / / www. t andf online. com/ loi/ t ewa20
A low sidelobe level of circularly
polarized microstrip array antenna for
CP-SAR sensor
Mohamed Hussein a , Yohandri bc , Josaphat Tet uko Sri Sumant yo c & Ashraf Yahia a
a
Facult y of Science, Depart ment of Physics , Ain Shams Universit y , 11566 Abbassia, Cairo , Egypt
b
Depart ment of Physics , St at e Universit y of Padang , Kampus UNP, Jl. Prof . Hamka Air Tawar, Padang , West Sumat era , 25131 , Indonesia
c
Josaphat Microwave Remot e Sensing Laborat ory , Cent er f or Environment al Remot e Sensing, Chiba Universit y , 1-33 Yayoi-cho, Inage-ku, Chiba , 263-8522 , Japan
Published online: 13 Aug 2013.
To cite this article: Mohamed Hussein , Yohandri , Josaphat Tet uko Sri Sumant yo & Ashraf Yahia (2013) A low sidelobe level of circularly polarized microst rip array ant enna f or CP-SAR sensor, Journal of Elect romagnet ic Waves and Applicat ions, 27: 15, 1931-1941, DOI: 10. 1080/ 09205071. 2013. 828577
To link to this article: ht t p: / / dx. doi. org/ 10. 1080/ 09205071. 2013. 828577
PLEASE SCROLL DOWN FOR ARTI CLE
subst ant ial or syst em at ic reproduct ion, redist ribut ion, reselling, loan, sub- licensing, syst em at ic supply, or dist ribut ion in any form t o anyone is expressly forbidden. Term s & Condit ions of access and use can be found at ht t p: / / w w w.t andfonline.com / page/ t erm s-and- condit ions
A low sidelobe level of circularly polarized microstrip array antenna
for CP-SAR sensor
Mohamed Husseina, Yohandrib,c*, Josaphat Tetuko Sri Sumantyocand Ashraf Yahiaa
a
Faculty of Science, Department of Physics, Ain Shams University, 11566 Abbassia, Cairo, Egypt;bDepartment of Physics, State University of Padang, Kampus UNP, Jl. Prof. Hamka Air
Tawar, Padang, West Sumatera 25131, Indonesia;cJosaphat Microwave Remote Sensing Laboratory, Center for Environmental Remote Sensing, Chiba University, 1-33 Yayoi-cho,
Inage-ku, Chiba 263-8522, Japan
(Received 8 December 2012; accepted 19 July 2013)
In this paper, an elliptical microstrip array antenna with a low sidelobe level for circularly polarized synthetic aperture radar (CP-SAR) sensor is investigated. The low sidelobe level is obtained by implementing the Chebyshev synthesis method to distribute the power unevenly to each element of the patch. A Method of Moment is employed for optimizing the design and achieving a good circular polarization at the working frequency (L-Band). The simulated axial ratio (AR) bandwidth (<3 dB) for
thefive elements elliptical array antenna is around 11.2 MHz (0.88%), which is
con-sistent with the measured value of 13.3 MHz (1.05%). The maximum sidelobe level of the proposed antenna is 23.3 and 21.4 dB for measured and simulated value, respectively. The simulated and measured results considerably agree with the theoret-ical design calculated using Chebyshev polynomial of 20 dB. The low sidelobe level
and reasonable AR values indicate that the proposed antenna satisfies the specifi
ca-tions of the CP-SAR sensor.
1. Introduction
Circularly polarized synthetic aperture radar (CP-SAR) sensor is currently being developed in the microwave remote sensing laboratory (MRSL), Chiba University, Japan.[1] This sensor is expected to reduce the effect of Faraday rotation in the ionosphere, which is occurred in the linearly polarized synthetic aperture radar.[2,3] In addition, this sensor gives the possibility to obtain additional information from the retrieved data such as axial ratio (AR), ellipticity, and tilt angle. The performances of the sensor will be verified and experimented onboard an unmanned aerial vehicle (UAV), and subsequently will be installed in a small satellite, planned to be launched in 2014.
To realize the CP-SAR sensor, the antenna as a transmitter is expected to satisfy the CP-SAR requirements. One of the critical parameters is the sidelobe level of the antenna radiation pattern. The sidelobe is the radiation in undesired direction and become noises in the SAR system. A high value sidelobe leads to resolution degradation of the SAR images. On the other hand, for hilly areas or lofty objects under platforms, the high side-lobe level is potential to produce the error data. This indicates that a low sideside-lobe level can be closely considered to produce correct output responses and high quality of the
*Corresponding author. Emails: [email protected]; [email protected] Journal of Electromagnetic Waves and Applications, 2013
Vol. 27, No. 15, 1931–1941, http://dx.doi.org/10.1080/09205071.2013.828577
Ó2013 Taylor & Francis
SAR images.[4] The sidelobe compression can be attained through developing a low sidelobe level of the array antenna radiation.
In our previous work [5], a 26 array antenna for CP-SAR was presented. The performance of this antenna, however, was not satisfactory in term of the sidelobe level. Hence, in this work, a Chebychev synthesis method is implemented to distribute the power on each element of the antenna array. The purpose of this paper is to present a low sidelobe level circularly polarized (CP) array antenna. The excitation coefficients are referenced in designing the weight of the power divider in the fed network leads to provide maximum sidelobe level reduction. An elliptical patch is adopted in an array configuration based upon the measured satisfactory results in terms of reflection coeffi -cient, AR, and gain.[6] The description of the CP-SAR sensor is introduced in Section 2, and the theoretical analysis and design of the proposed antenna in Section 3. The mea-surement of the antenna performance is explained in Section 4. In Section 5, the results and discussion are presented. The conclusions and remarks on this work will be given in Section 6.
2. The CP-SAR sensor
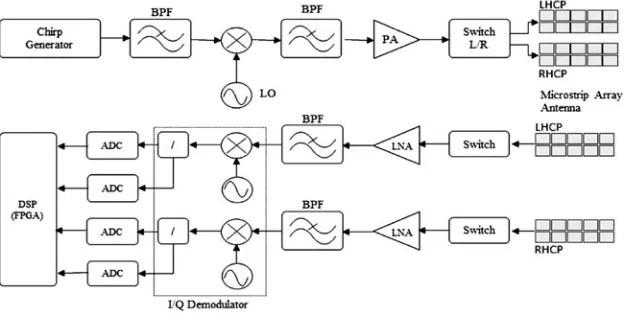
SAR is an active sensor that can illuminate the target area with coherent radiation and capture the echoes signal. A CP-SAR sensor is composed of a transmitter, a receiver, and CP antennas (see Figure 1). The transmitter is split up to a chirp generator, bandpassfilter (BPF), a local oscillator, a power amplifier, and switches. The switches are used to select the CP antenna to radiate microwaves. The receiver, on the other hand, is composed of the low-noise amplifier, switch to reduce the coupling between the transmitter and receiver antenna, a BPF, an I/Q demodulator to generate the inphase and quadrature data (phase), an analog/digital (A/D) converter, and a digital signal processing (DSP) unit. In the DSP unit, the range compression, corner turn, and azimuth compressions are utilized to produce the SAR image. The antenna consists of four panels, two panels are left handed circularly polarized (LHCP) and two other panels are right handed circularly polarized (RHCP) as shown in Figure 1. Upon operating these antennas, a full polarimetry experiment of the CP-SAR can be executed.
Figure 1. Design of CP-SAR sensor system.
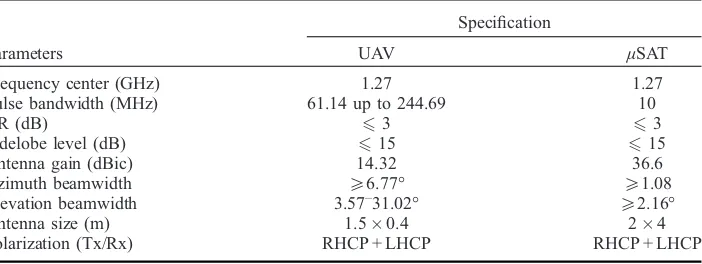
In general, the specification of the CP-SAR system onboard UAV and small satellite (μSAT) are listed in Table 1.[7,8] Our CP-SAR sensor is designed to operate in the L-band area with frequency center 1.27 GHz. This frequency has been chosen since of the ability to through the atmosphere and responding to parameters of the surface such as soil moisture and ocean salinity.[9] In this L-band, the large antenna size is an unavoidable and the sharp beamwidth is rather challenging to be realized. To maintain the resolution of image data, the pulse bandwidth system is designed ranging from 61.14 to 244.69 MHz and 10 MHz for onboard UAV and small satellite, respectively. The circularly polarized radiation can be achieved as long as the bandwidth requirement is compatible with a low AR (<3 dB). For CP-SAR onboard UAV, it is rather challenging for the AR bandwidth is to reach to 250 MHz. To satisfy the matching of the input impedance, the return loss must be smaller than 10 dB in this bandwidth range. The sidelobe level of the antenna is set up more than 15 dB to minimize the effect of the undesired radiation and error data from backscattering signal.
3. Analysis and design of the proposed antenna
3.1. Chebyshev array factor
The array antenna consists of five elements having elliptical patches with uniform spacing (d=λ0/2). The Chebychev synthesis method is applied to manage the power distribution in the corporate feed network. The power distribution in the feed network is arranged based upon the excitation coefficients, namely; ai(i= 0, 1, 2,…) of the array antenna for 20 dB sidelobe level. For thefive elements array antenna (p= 5, N= 2), the array factor (AF) takes the form [10]
AFðuÞ ¼a0þ2a1cosuþ2a2cos 2u; ð1Þ
whereu =2π (d/λ) cosh, for uniform space between the element half wavelength (d =λ/ 2), u =π cosh. Upon substitution using the Chebychev polynomials in Equation (1), the excitation coefficients are obtained with a0, a1 and a2 being 2.698, 2.247, and 1.398, respectively. Hence, the array factor of the proposed antenna is given as:
AFðuÞ ¼2:698þ2ð2:247Þcosuþ2ð1:398Þcos 2u ð2Þ
Table 1. Specification of CP-SAR system.
Parameters
Specification
UAV μSAT
Frequency center (GHz) 1.27 1.27
Pulse bandwidth (MHz) 61.14 up to 244.69 10
AR (dB) 63 63
Sidelobe level (dB) 615 615
Antenna gain (dBic) 14.32 36.6
Azimuth beamwidth P6.77° P1.08
Elevation beamwidth 3.57–
31.02° P2.16°
Antenna size (m) 1.50.4 24
Polarization (Tx/Rx) RHCP + LHCP RHCP + LHCP
Journal of Electromagnetic Waves and Applications 1933
Normalizing with respect to the center element a0, the array factor of the antenna becomes:
AFðuÞ ¼1þ1:6654 cosuþ1:038 cos 2u ð3Þ
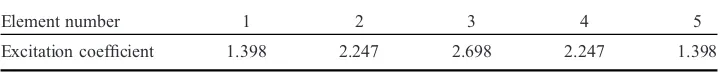
Equation (3) can be used to calculate the radiation pattern of the array antenna. The excitation coefficient for each element is listed in Table 2.
The power distribution is optimized using the T-junction power divider through Z1,
Z2, andZ3(see Figure 5). Based upon the excitation coefficients, the power ratio (α) for every T-Junction can be calculated. According to the T-junction power divider calcula-tion,[11] the ratio of each divider is found to beα1= 1.74, α2= 1.35, and α3= 1.61. The impedance for each port can be determined and optimized using simulation software, as appears in Table 3.
3.2. Geometry of proposed antenna
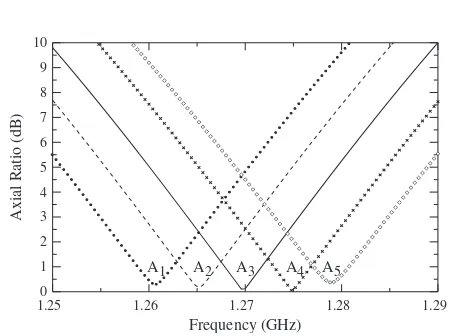
The main requirement for a patch element to generate circularly polarized radiation is that the patch must have orthogonal (in phase and quadrature) fields of equal amplitudes. In general, an elliptical antenna element generates elliptically polarized radi-ation. The slightly elliptical patch has a circular polarization radiation with a single feed when the feeding point of the antenna element is located on the radial line rotated 45° counter clockwise (or clockwise) to the semi-major-axis of the ellipse.[12] In the pres-ent design, the circular polarization radiation is obtained by adjusting the ratio (r) of the length of the major axis to the minor axis of the elliptical patch. Figure 2 shows the effect of the axis ratio of the ellipse (r) on the AR for thefixed area of the ellipse. As shown in this graph, the best circular polarization of the antenna can be attained for a ratio of 1.031. Hence, this ratio can be implemented to design the elliptical antenna at different working frequencies. In Figure 3, several working frequencies of the antenna can be designed by adjusting the ellipse area (A) while keeping the axis ratio (r). The larger ellipse area (A1) produces a lower working frequency and vice versa for smaller area (A5).
According to the single ellipse analysis, a design of array antenna configuration is arranged. In executing the power distribution related to the array factor calculations, the proximity-coupled feeding method is adopted in this feed network design.[13] The geo-metrical design of the antenna array (see Figure 4) is optimized using the method of moment (MoM) by assuming a finite ground model. The optimum radiation pattern of the array antenna is affected by the distance between the patches.[14] Figure 5 displays the radiation pattern of the array antenna at the elevation angle, for four different spaces (d) between the elements. Clearly, at a distance (d =0.53λ) results are slightly better than at (d =0.5λ). However, for reasons such as substrate size limitation and fabrication processes, the distance (d= 0.5λ) is selected for this design. The dimensions of the elliptical patch are a =45.2 mm, b= 46.6 mm, and the distance between them d=λ0/2. The fabricated model is implemented on two substrates (NPC-H220A), each having
Table 2. Excitation coefficients of the antenna elements.
Element number 1 2 3 4 5
Excitation coefficient 1.398 2.247 2.698 2.247 1.398
thickness t =1.6 mm, conductor thickness tc= 0.035 mm, relative permittivity ɛr=2.17,
and dissipation factor = 0.0005, as well as the size of the ground LgWg=
180 mm600 mm.
4. Measurement of antenna performance
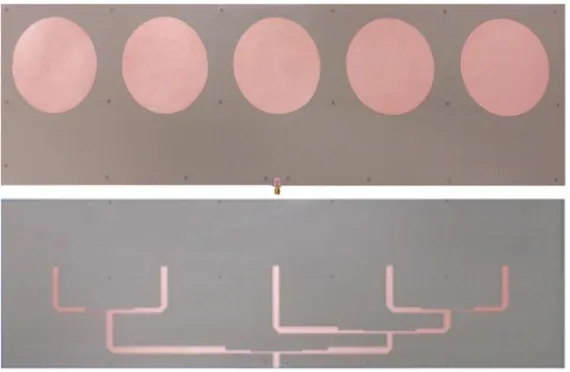
A photograph of the elliptical array antenna was shown in Figure 6 and its properties were tested in comparison with the simulation results. Careful and precise fabrication
Table 3. Impedance of each port on T-Junction power divider.
Port Z11 Z12 Z21 Z22 Z31 Z32
Calculation (Ohm) 109.61 62.98 94.03 69.61 56.77 91.26
Simulated (Ohm) 109.60 63.00 94.00 69.60 64.00 77.00
1.25 1.26 1.27 1.28 1.29 0
Figure 2. Simulated AR plotted as a function of frequency for 4 values of the ellipse axis ratio (r).
1.250 1.26 1.27 1.28 1.29
Figure 3. Simulated AR plotted as a function of frequency for a variety of antenna areas;
A1= 3320.1 mm
Journal of Electromagnetic Waves and Applications 1935
Figure 4. The geometrical design of the low sidelobe level array antenna.
Figure 6. Photograph of the fabricated feed network and radiation path.
-90 -60 -30 0 30 60 90
-30 -25 -20 -15 -10 -5 0
Elevation Angle (deg)
Gain (dBi)
d = 0.47 d = 0.50 d = 0.53 d = 0.60
Figure 5. Simulated radiation pattern of the array antenna in elevation angle (theta plane) for 4
different values of the spaces between elements (d) atf= 1.27 GHz.
processes were undertaken to insure the production radiating behavior similar to the simulated model. The reflection coefficient and voltage standing wave ratio (VSWR) were measured with an RF vector network analyzer (Agilent, E5062A). The antenna gain, AR, and radiation patterns were measured inside the anechoic chamber of MRSL, having the dimensions 48.52.4 m3.
The frequency dependence of the AR, gain, and radiation patterns are measured assuming the conical log spiral LHCP, RHCP, and dipole antennas as the standard refer-ences. Precise alignment between the antenna under test (AUT) and the conical log spiral antenna is indispensable to obtain accurate measurement results.
5. Results and discussion
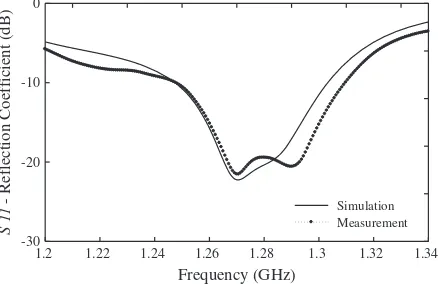
The comparison between the simulated and measured results is presented in Figures 7–12, in terms of the reflection coefficient (S11), VSWR, AR, gain (G), and radiation pattern. In Figure 7, the reflection coefficient (S11-parameter) is plotted as a function of frequency at the center of the working frequency (1.27 GHz). The measured reflection coefficient is 21.55 dB, which is quite consistent with the simulated value of 22.2 dB. A good agree-ment concerning the 10 dB impedance bandwidth of 60.9 MHz is obtained for the mea-sured and 55.3 MHz for the simulated data. The dissimilarity in this result is suspected due to the slight difference in the line size between simulated and fabricated model.
Simulated and measured results of the VSWR vs. frequency are displayed in Figure 8. Apparently, the measured and simulated results are in good agreement. The measured impedance bandwidth for VSWR62 is 6.45% ranging from 1.217 to 1.299 GHz, while the simulation result shows a 4.57% bandwidth achieved from 1.243 to 1.301 GHz. Good agreements are also observed between the simulated and the mea-sured results throughout the whole operating bandwidth. The meamea-sured value of VSWR at the working frequency of 1.27 GHz is 1.18 and the simulated value is 1.17. Both the simulated and measured results presented the highly acceptable matching between antenna and feeding line at the operating frequency.
The relation between AR and frequency is shown in Figure 9. The 3 dB AR bandwidth achieved in the direction of theta = 0° (i.e. the AUT is set perpendicular to the standard reference antenna) is about 13.3 MHz, which corresponds to 1.04% of the operating frequency of 1.27 GHz. In the simulation data, on the other hand, the value is
1.2 1.22 1.24 1.26 1.28 1.3 1.32 1.34
- Reflection Coefficient (dB)
Figure 7. Simulated and measured reflection coefficients plotted as a function of frequency.
Journal of Electromagnetic Waves and Applications 1937
1.2 1.22 1.24 1.26 1.28 1.3 1.32 1.34
Figure 8. Simulated and measured VSWR plotted as a function of frequency.
1.250 1.26 1.27 1.28 1.29
Figure 9. Simulated and measured AR plotted as a function of frequency.
1.25 1.26 1.27 1.28 1.29 0
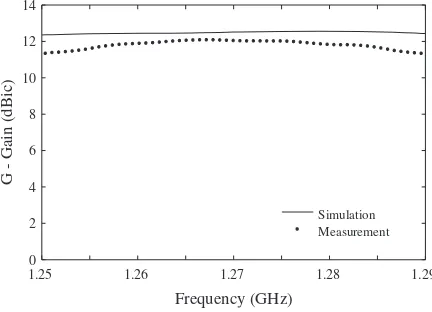
Figure 10. Relationship between antenna gain and frequency athangle = 0°.
11.2 MHz or around 0.87% of the operating frequency. The AR bandwidth of the simu-lated and measured models has satisfied the target specification (10 MHz) of CP-SAR. The AR range is slightly shifted from the center frequency of 1.27 to 1.273 GHz. This shift is probably caused by fabrication imperfections. The minimum values of AR are obtained to be 0.49 and 0.37 dB for simulation and measurement, respectively. A possi-ble cause of this discrepancy is the difference in the ground plane size, which can also lead to such a slight degradation of the 3 dB AR bandwidth. When the ground plane size is increased, the edge-diffracted fields cause tilting of the beam in the direction of low elevation angles, thus reducing the maximum gain and ultimately affecting the characteristics of the AR.
The simulated and measured antenna gain as a function of frequency is shown in Figure 10. From this figure, the simulated value of the gain is about 12.5 dBic, whereas the measured gain is at 12 dBic. The 0.5 dBic lower value than the expected can proba-bly be ascribed to the fabrication imperfections (such as etching processes, connector soldering and holes with plastic screws, etc.). The substrate losses, cable losses, and the infinite lateral extension of the substrate in the IE3D could contribute to this slight difference.
Figure 11. Normalized radiation patterns of the array antenna in the theta plane (negative theta
forAz= 180° and positive forAz= 0°) (x–zplane) atf= 1.273 GHz.
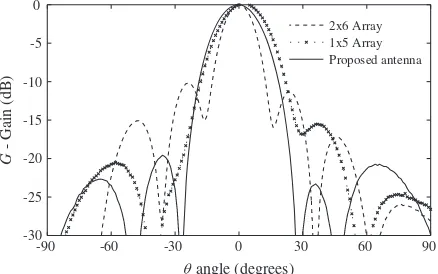
Figure 12. Normalized radiation patterns of the proposed antenna design.
Journal of Electromagnetic Waves and Applications 1939
The radiation pattern (gain vs. theta angle) in the theta plane (Az= 0° and 180°) (x–zplane) is shown in Figure 11. In the samefigure, the main beam is radiated in the
direction of Az= 0°. The first side lobes appear at h= + 35° with a peak amplitude of 8.5 dB and at h= 36° with a peak amplitude of 6.1 dB. Hence, the differences in amplitude between the main and side lobes are nearly 20.5 and 18 dB for h= + 35° and h= 36°, respectively. The simulated and measured results of the proposed antenna are
in good agreement with the calculated model. The slight difference in the gain patterns attributed to the imperfections in the measurement process, namely insignificant variations in antenna alignment during rotation.
Figure 12 shows the performance of the proposed antenna as compared to our previous work (26 and 15 array antenna).[4,15] On the 26 array antenna, the differences in amplitude between the main and sidelobes are around 10.22 and 11.36 dB for h= 24° and 23°, respectively. In case of the 15 array antenna, the asymmetry sidelobe level is obtained 21 dB for h= 61° and 16 dB for h= 34°. The best performance is achieved in the proposed antenna with the sidelobe level of about 20 and 22 dB forh= 39° and 35°, respectively.
6. Conclusions
A low sidelobe level array antenna based on the Chebychev synthesis method with uniform spacing (d=λ0/2) has been designed and manufactured. The measured results are in good agreement with the simulated model and a 20 dB sidelobe level is achieved. A satisfactory circular polarization performance is attained over a 3 dB AR bandwidth of around 13 MHz with a fairly high gain of about 12 dBic in the operating band. Numerical analysis using the MoM can lead to a good agreement with experimental results. Compared with our previous work, the proposed antenna using Chebychev synthesis method shows significant improvement on sidelobe level reduction. With its good performance, this proposed antenna is promising for CP-SAR sensor.
Acknowledgments
The author would like to thank Takafumi Kawai and Takahiro Miyazaki for assisting in antenna
development, Egyptian Ministry of Higher Education and State for Scientific research for a grant
to travel and stay in Japan during this research. The authors would like also to thank professor Josaphat Tetuko Sri Sumantyo for permitting to use of the facilities available in his laboratory to carry out this research.
References
[1] Josaphat Tetuko Sri Sumantyo. Development of circularly polarized synthetic aperture radar onboard microsatellite for earth diagnosis. In: International Geoscience and Remote Sensing Symposium (IGARSS); 978-1-4577-1005-6; Vancouver, Canada; 2011.
[2] Freeman A, Saatchi S. On the detection of Faraday rotation in linearly polarized, L-band
SAR backscatter signatures. IEEE Trans. Geosci. Remote Sens. 2004;42:1607–1616.
[3] Meyer FJ, Nicoll JB. Prediction, detection, and correction of Faraday rotation in
full-polari-metric L-band SAR data. IEEE Trans. Geosci. Remote Sens. 2008;46:3076–3086.
[4] Kim SY, Myung NH, Kang MJ. Antenna mask design for SAR performance optimization.
IEEE Geosci. Remote Sens. Lett. 2009;6:443–447.
[5] Yohandri, Wissan V, Firmansyah I, Rizki Akbar P, Sri Sumantyo JT, Kuze H. Development of circularly polarized array antenna for synthetic aperture radar sensor installed on UAV.
Prog. Electromagnet. Res. 2011;19:119–133.
[6] Baharuddin M, Wissan V, Sri Sumantyo JT, Kuze H. Elliptical microstrip antenna for
circu-larly polarized synthetic aperture radar. Int. J. Electron. Commun. 2011;65:62–67.
[7] Rizki Akbar P, Sri Sumantyo JT, Kuze H. CP-SAR UAV development. In: International Archives of the Photogrammetry, Remote Sensing and Spatial Information Science, Vol.
XXXVIII, Part 8; Kyoto; 2010. p. 203–208.
[8] Rizki Akbar P, Sri Sumantyo JT, Kuze H. A novel circularly polarized synthetic aperture
radar (CP-SAR) onboard spaceborne platform. Int. J. Remote Sens. 2010;31:1053–1060.
[9] David MLV. Remote sensing at L-band with the synthetic aperture radiometer ESTAR. XXVIIth General Assembly of the International Union of Radio Science; 2002 Aug
17–24; Netherlands.
[10] Stutzman WL, Thiele GA. Antenna theory and design. 2nd ed. New York: Wiley; 1998.
p. 537–541.
[11] Visser HJ. Array and phased array antenna basics. New York: Wiley; 2005. p. 150–151.
[12] Shen CS. The elliptical microstrip antenna with circular polarization. IEEE Trans. Antennas
Propag. 1981;29:90–94.
[13] Pozar DM, Kaufman B. Increasing the bandwidth of a microstrip antenna by proximity
coupling. Electr. Lett. 1987;23:368–369.
[14] Raffaelli S, Sipus Z, Kildal P. Effect of element spacing and curvature on the radiation pat-terns of patch antenna arrays mounted on cylindrical multilayer structures. Antennas Propag.
Int. Symp. 1999;4:2474–2477.
[15] Yohandri, Sri Sumantyo JT. A low sidelobe level array antenna for CP-SAR sensor. In: The
5th Indonesia-Japan Joint Scientific Symposium; Chiba; 2012 Oct. p. 528–533.
Journal of Electromagnetic Waves and Applications 1941